. 2020 Sep;14(3):335-347.
doi: 10.1007/s12079-020-00567-2. Epub 2020 Jun 5.

Circulating miR34a levels as a potential biomarker in the follow-up of Ewing sarcoma

Affiliations

Circulating miR34a levels as a potential biomarker in the follow-up of Ewing sarcoma

Marika Sciandra et al. J Cell Commun Signal. 2020 Sep.

Abstract

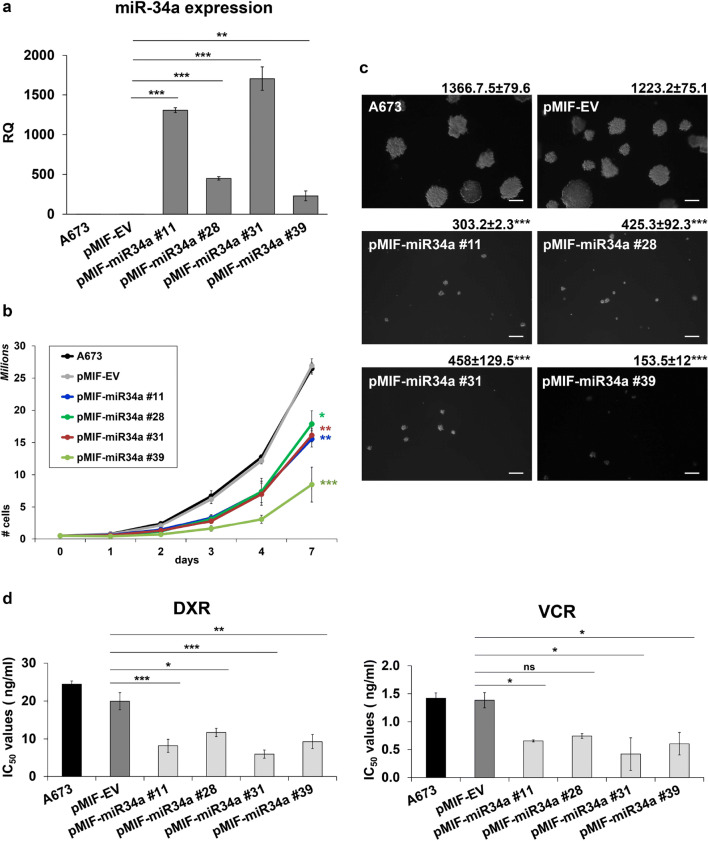
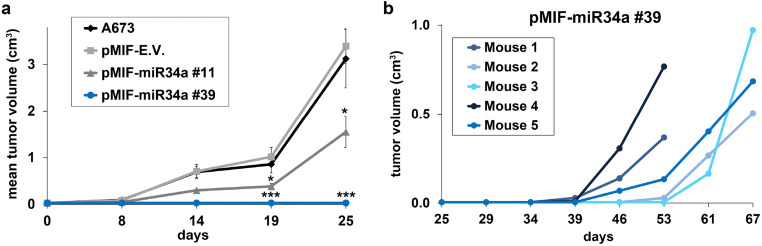
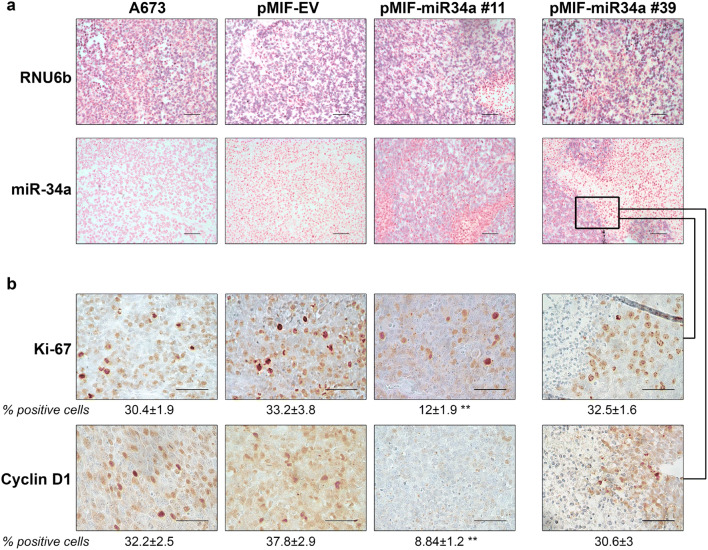
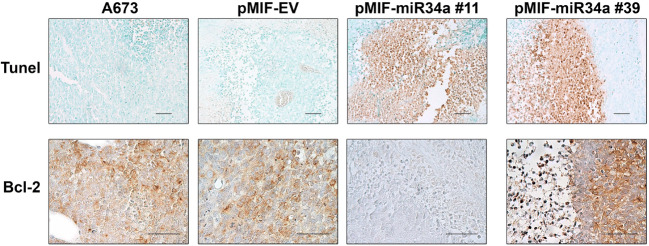
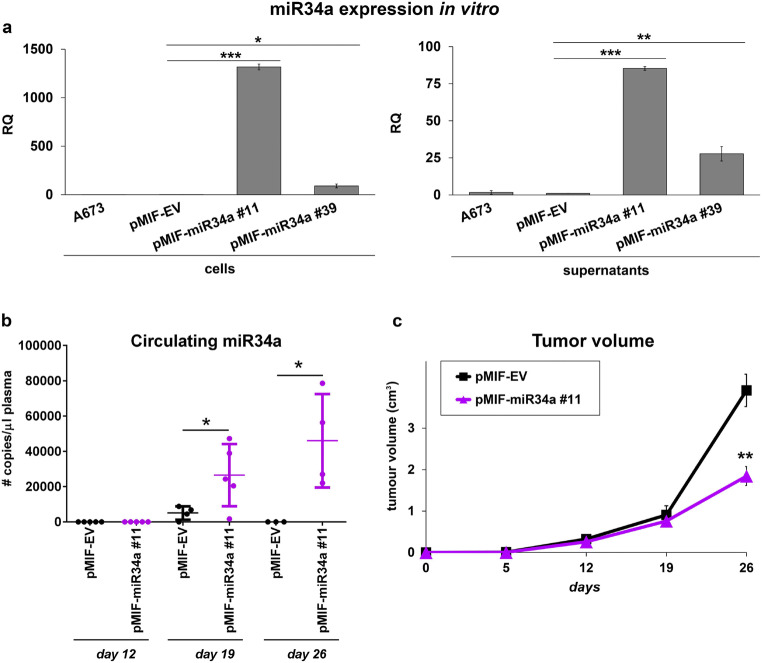
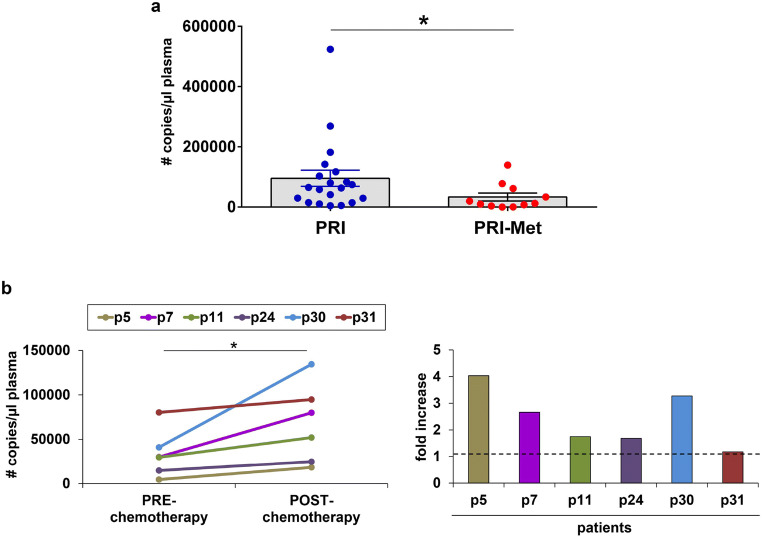
Appropriate tools for monitoring sarcoma progression are still limited. The aim of the present study was to investigate the value of miR-34a-5p (miR34a) as a circulating biomarker to follow disease progression and measure the therapeutic response. Stable forced re-expression of miR34a in Ewing sarcoma (EWS) cells significantly limited tumor growth in mice. Absolute quantification of miR34a in the plasma of mice and 31 patients showed that high levels of this miRNA inversely correlated with tumor volume. In addition, miR34a expression was higher in the blood of localized EWS patients than in the blood of metastatic EWS patients. In 12 patients, we followed miR34a expression during preoperative chemotherapy. While there was no variation in the blood miR34a levels in metastatic patients at the time of diagnosis or after the last cycle of preoperative chemotherapy, there was an increase in the circulating miR34a levels in patients with localized tumors. The three patients with the highest fold-increase in the miR levels did not show evidence of metastasis. Although this analysis should be extended to a larger cohort of patients, these findings imply that detection of the miR34a levels in the blood of EWS patients may assist with the clinical management of EWS.

Keywords: Circulating biomarkers; Ewing sarcoma; Metastases; miR34a; miRNAs.


Conflict of interest statement

The authors declare that no conflicts of interest exist.

Figures

Fig. 1
Fig. 1
miR34a reduces tumor growth and improves EWS cell chemosensitivity. The effects of miR34a on EWS cells were evaluated and the controls (parental cell line A673 and the empty vector pMIF-EV) and the miR34a-overexpressing variants (pMIF-miR34a #11, pMIF-miR34a #28, pMIF-miR34a #31, and pMIF-miR34a #39) were compared. (a) Evaluation of miR34a expression by RT-qPCR in all transduced selected clones (pMIF-miR34a #11, #28, #31, and #39) compared to controls (A673 and pMIF-EV). The relative miRNA levels were normalized to the expression of RNU6b. The data are shown as the mean ± SE (**p < 0.01; ***p < 0.001, one-way ANOVA). (b) Cell growth in monolayer conditions is displayed. Data are represented as the mean value ± SE (*p < 0.05; **p < 0.01; ***p < 0.001, one-way ANOVA). (c) The ability to grow in anchorage-independent conditions is shown by the pictures; the number above each picture represents the mean number of colonies observed in soft-agar ± SE (scale bar: 200 μm) (***p < 0.001, one-way ANOVA). (d) Cell sensitivity to DXR and VCR is represented. The columns show the mean values ± SE (*p < 0.05; **p < 0.01; ***p < 0.001, one-way ANOVA)
Fig. 2
Fig. 2
Stable expression of miR34a impairs EWS tumor growth in mice. (a) Tumor growth in mice after s.c. injection of A673, pMIF-EV, pMIF-miR34a #11, and pMIF-miR34a #39 cells. Volume values are shown as the mean ± SE (*p < 0.05, ***p < 0.001; one-way ANOVA, compared to pMIF-EV). (b) Single tumor growth curves of mice injected with pMIF-miR34a #39. Animals became positive starting from 39 days after cell injection, when animals of the other groups had already been sacrificed but then tumor growth was very rapid
Fig. 3
Fig. 3
In situ expression of miR34a and evaluation of proliferation markers in tumors developed from injection of EWS cells expressing or not expressing miR34a. (a) The tissue sections were hybridized with miR34a or RNU6b (used as positive control) probes to perform ISH. Positivity to miR34a or RNU6b is shown as blue precipitates. All slides were counterstained with nuclear fast red. The pink sections are negative. Positive sections or those with positive zones are in blue, and the intensity depends on the amount of expression. Representative images are shown for tumors developed from injection of control (A673, pMIF-EV) or miR34a transduced cells (pMIF-miR34a #11, pMIF-miR34a #39) (magnification 20x. Scale bar: 50 μm). (b) Expression of Ki-67 and Cyclin D1 in the same tumors. Representative images of cell positivity for Ki-67 and Cyclin D1 are displayed (magnification 40x. Scale bar: 50 μm). For pMIF-miR34a #39 tumors, details are presented to show their differential expression in the area with or without expression of miR34a. The % of positive cells is shown ± SE (**p < 0.01; one-way ANOVA). All the pictures were taken from tumor samples isolated at the time of mouse sacrifice.
Fig. 4
Fig. 4
Evaluation of cell death in tumors developed from the injection of EWS cells expressing or not expressing miR34a. A general evaluation of cell death in the different tumors was obtained by a TUNEL assay. The nuclei were counterstained with methyl green and representative images are shown (magnification 20x. Scale bar: 50 μm). In the same tumors, expression of the antiapoptotic protein Bcl-2 was detected by IHC (magnification 40x. Scale bar: 50 μm)
Fig. 5
Fig. 5
Detection of released miR34a in vitro and in the plasma of mice bearing EWS cell-induced tumors expressing or not expressing miR34a. (a) miR34a expression levels were analyzed by RT-qPCR in controls (A673 and pMIF-EV) and miR34a transduced cells (pMiF-miR34a #11 and pMIF-miR34a #39), as well as in their supernatants. pMIF-EV was used as the calibrator. The data are presented as the mean ± SE (*p < 0.05; **p < 0.01; ***p < 0.001, one-way ANOVA). (b) Circulating levels of miR34a in the plasma of mice bearing xenografts (pMIF-EV and pMIF-miR34a #11 cells) are shown at days 12, 19, and 26 after cell injection. miR34a amounts were measured by RT-qPCR absolute quantification and expressed as # copies/μl plasma. The results are represented as the mean ± SE (*p < 0.05; Student’s t test). (c) Tumor volumes from the same mice bearing xenografts are plotted at days 5, 12, 19, and 26 from cell injection and are presented as the mean ± SE (**p < 0.01; Student’s t test)
Fig. 6
Fig. 6
Detection of circulating miR34a in the plasma of EWS patients. (a) Absolute expression of circulating miR34a at diagnosis in patients with localized disease (PRI, n = 20) or with detectable metastases (PRI-Met, n = 11). The miR34a amounts were measured by RT-qPCR absolute quantification and expressed as # copies/μl plasma. Data are expressed as the mean ± SE (*p < 0.05, Student’s t test). (b) Detection of miR34a levels in the plasma of 6 PRI patients before (PRE-chemotherapy) and after the last cycle of preoperative chemotherapy (POST-chemotherapy). miR34a amounts were measured by RT-qPCR absolute quantification and expressed as # copies/μl plasma. Data are plotted as the mean ± SE (*p < 0.05, Wilcoxon test) (left panel). The difference in miR34a copies between PRE- and POST-chemotherapy plasma samples is represented as the fold increase for each patient (right panel)

Similar articles

Cited by

References

    1. Bacci G, Mercuri M, Longhi A, Bertoni F, Barbieri E, Donati D, Giacomini S, Bacchini P, Pignotti E, Forni C, Ferrari S (2002) Neoadjuvant chemotherapy for ewing's tumour of bone: recent experience at the rizzoli orthopaedic institute. Eur J Cancer 38(17):2243–2251 - PubMed
    1. Bardelli A, Pantel K (2017) Liquid biopsies, what we do not know (yet). Cancer Cell 31(2):172–179 - PubMed
    1. Bertaina A, Zecca M, Buldini B, Sacchi N, Algeri M, Saglio F, Perotti C, Gallina AM, Bertaina V, Lanino E, Prete A, Barberi W, Tumino M, Favre C, Cesaro S, del Bufalo F, Ripaldi M, Boghen S, Casazza G, Rabusin M, Balduzzi A, Fagioli F, Pagliara D, Locatelli F (2018) Unrelated donor vs hla-haploidentical alpha/beta t-cell- and b-cell-depleted hsct in children with acute leukemia. Blood 132(24):2594–2607 - PubMed
    1. Brohl AS, Solomon DA, Chang W, Wang J, Song Y, Sindiri S, Patidar R, Hurd L, Chen L, Shern JF, Liao H, Wen X, Gerard J, Kim JS, Lopez Guerrero JA, Machado I, Wai DH, Picci P, Triche T, Horvai AE, Miettinen M, Wei JS, Catchpool D, Llombart-Bosch A, Waldman T, Khan J (2014) The genomic landscape of the Ewing sarcoma family of tumors reveals recurrent stag2 mutation. PLoS Genet 10(7):e1004475 - PMC - PubMed
    1. Crompton BD, Stewart C, Taylor-Weiner A, Alexe G, Kurek KC, Calicchio ML, Kiezun A, Carter SL, Shukla SA, Mehta SS, Thorner AR, de Torres C, Lavarino C, Sunol M, McKenna A, Sivachenko A, Cibulskis K, Lawrence MS, Stojanov P, Rosenberg M, Ambrogio L, Auclair D, Seepo S, Blumenstiel B, DeFelice M, Imaz-Rosshandler I, Schwarz-Cruz y Celis A, Rivera MN, Rodriguez-Galindo C, Fleming MD, Golub TR, Getz G, Mora J, Stegmaier K (2014) The genomic landscape of pediatric Ewing sarcoma. Cancer Discov 4(11):1326–1341 - PubMed