. 2020 Sep-Oct;13(5):1232-1244.
doi: 10.1016/j.brs.2020.06.002. Epub 2020 Jun 3.

A systematic exploration of parameters affecting evoked intracranial potentials in patients with epilepsy

Affiliations

A systematic exploration of parameters affecting evoked intracranial potentials in patients with epilepsy

Bornali Kundu et al. Brain Stimul. 2020 Sep-Oct.

Abstract

Background: Brain activity is constrained by and evolves over a network of structural and functional connections. Corticocortical evoked potentials (CCEPs) have been used to measure this connectivity and to discern brain areas involved in both brain function and disease. However, how varying stimulation parameters influences the measured CCEP across brain areas has not been well characterized.

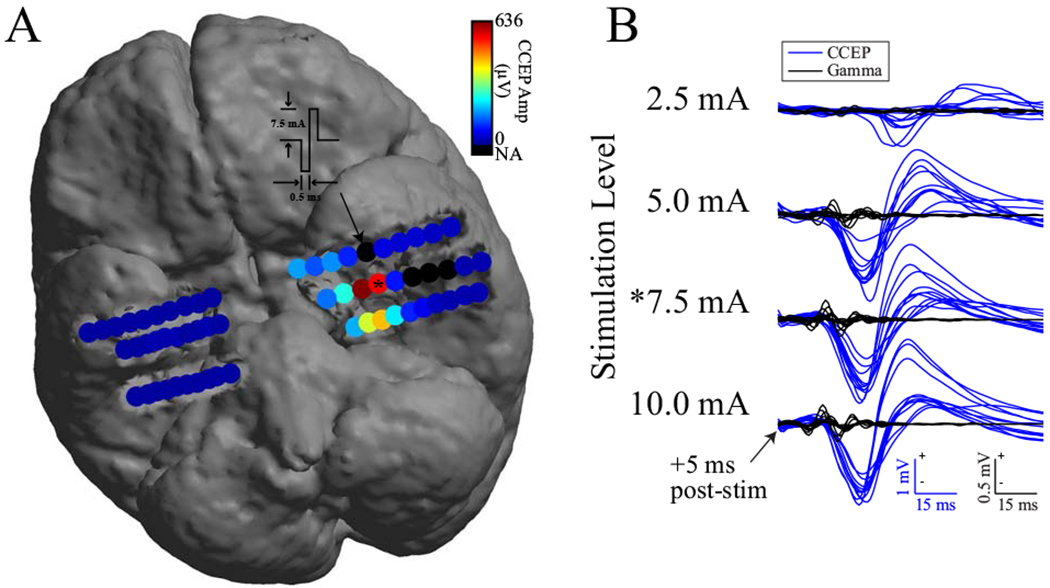
Objective: To better understand the factors that influence the amplitude of the CCEPs as well as evoked gamma-band power (70-150 Hz) resulting from single-pulse stimulation via cortical surface and depth electrodes.

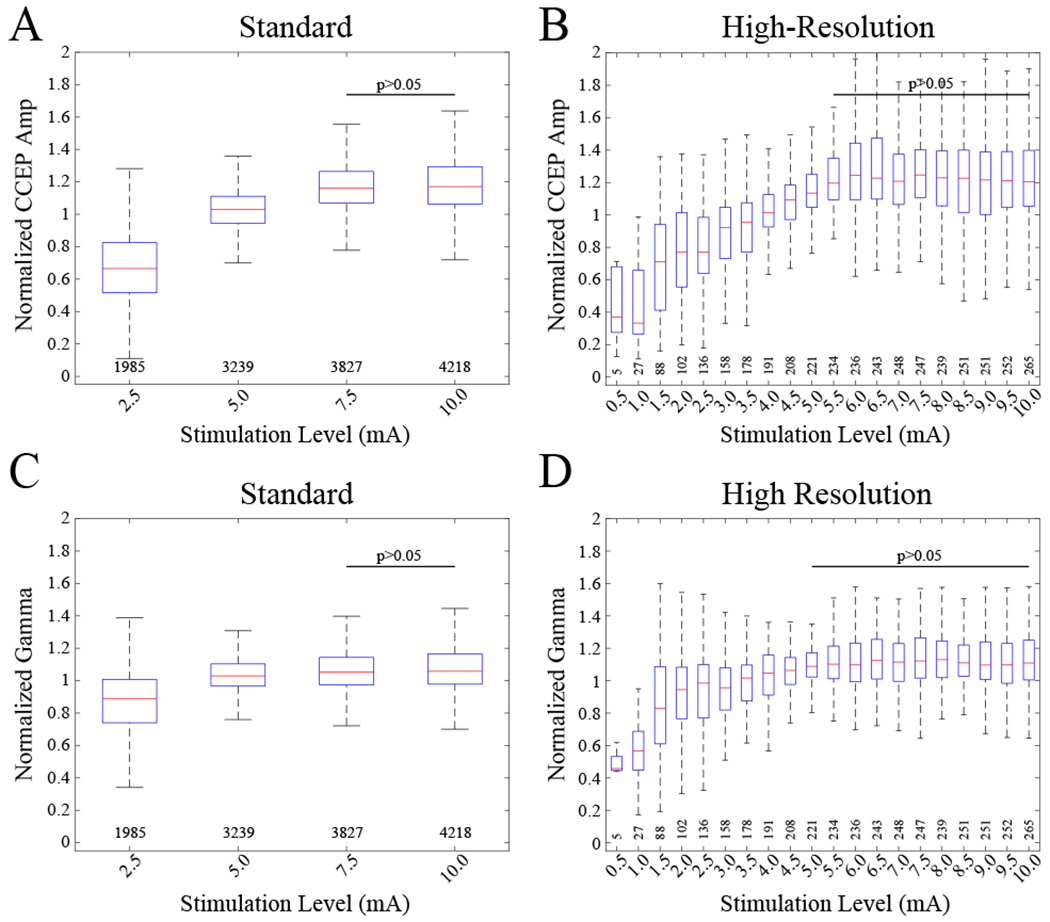
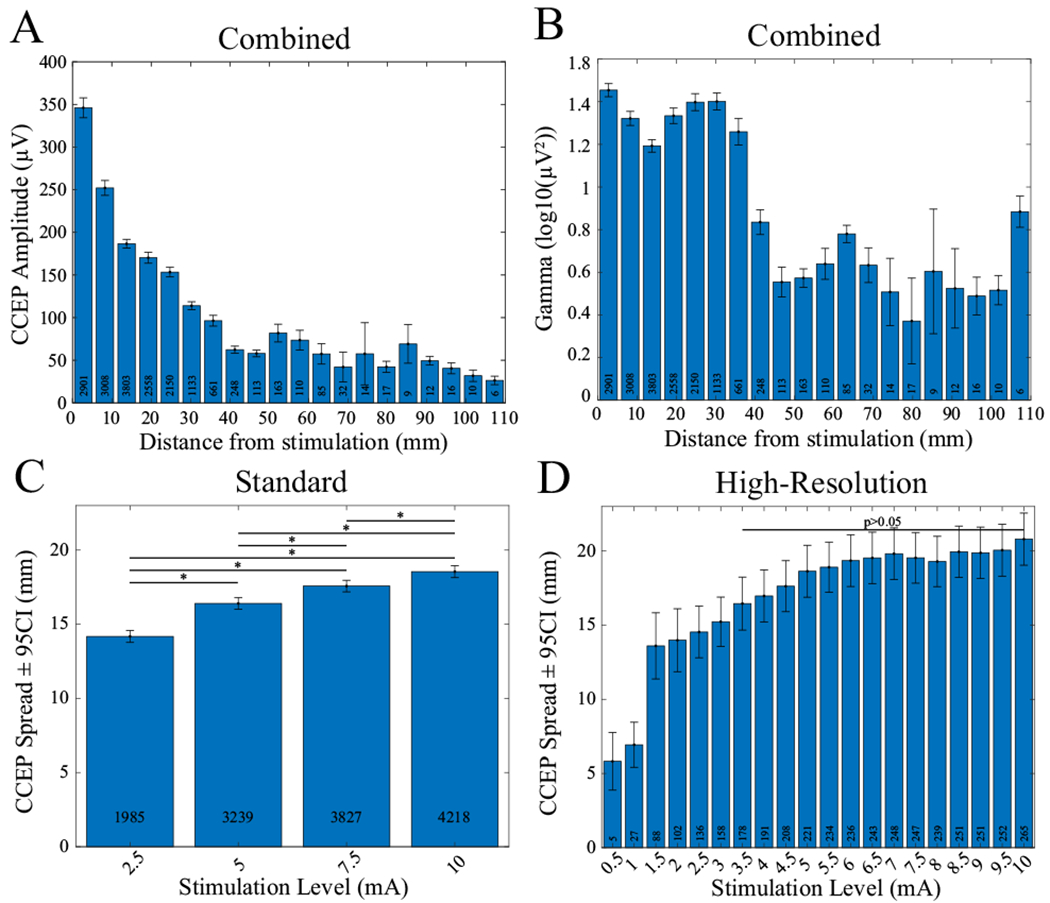
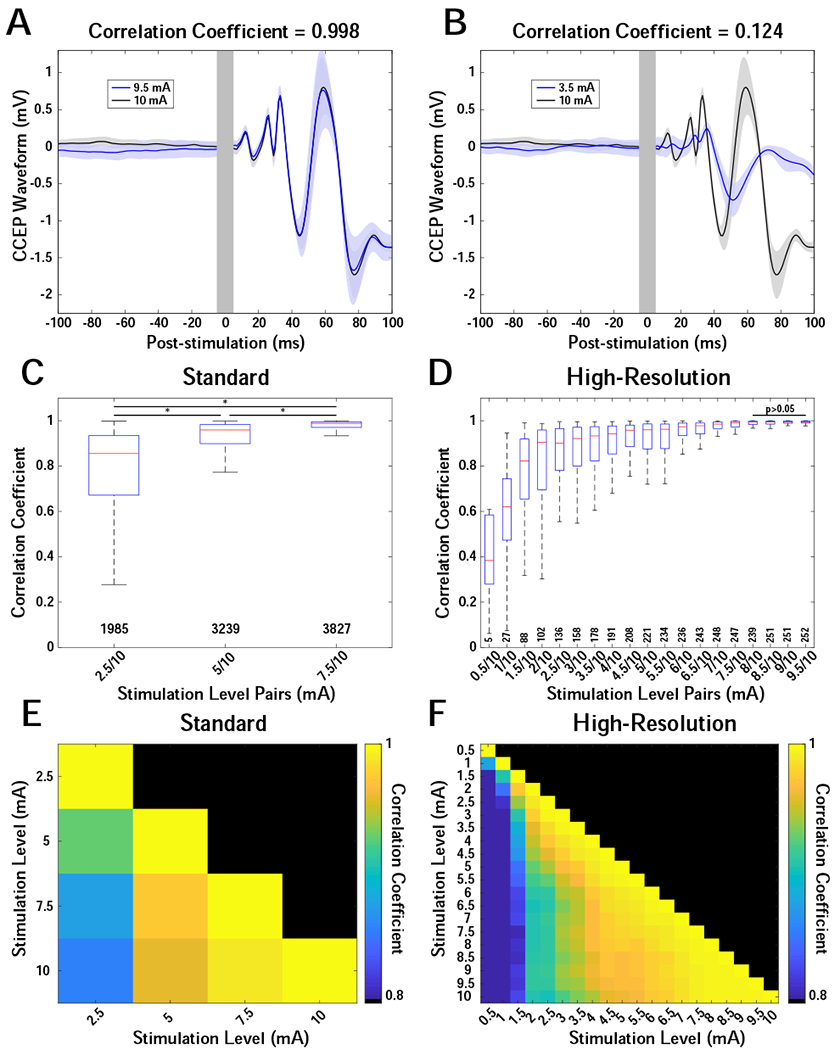
Methods: CCEPs from 4370 stimulation-response channel pairs were recorded across a range of stimulation parameters and brain regions in 11 patients undergoing long-term monitoring for epilepsy. A generalized mixed-effects model was used to model cortical response amplitudes from 5 to 100 ms post-stimulation.

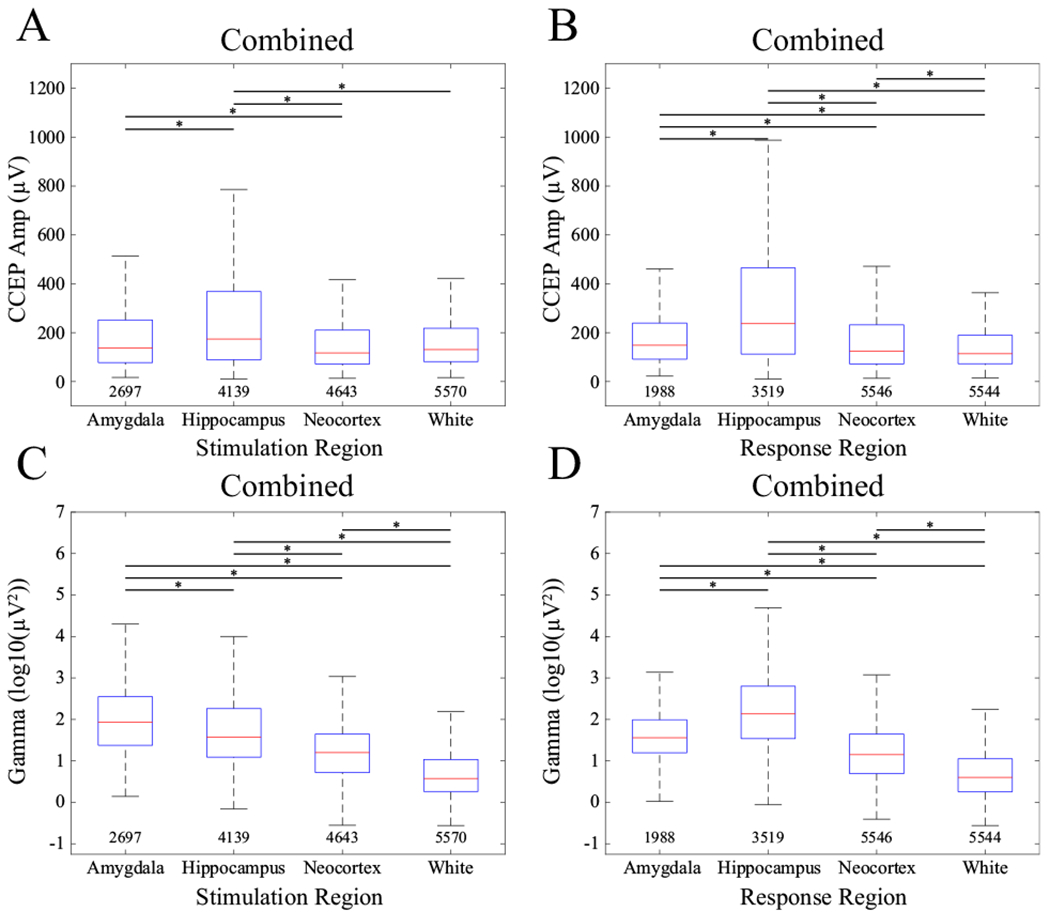
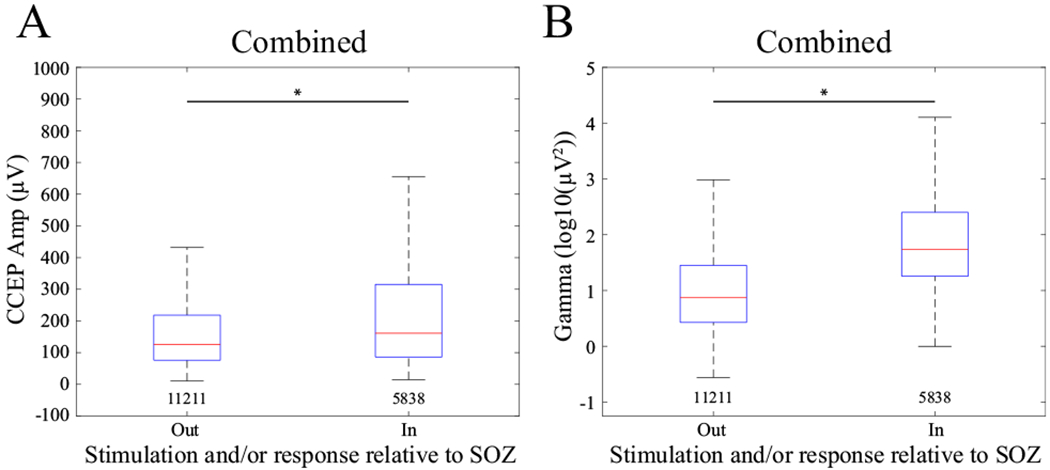
Results: Stimulation levels <5.5 mA generated variable CCEPs with low amplitude and reduced spatial spread. Stimulation at ≥5.5 mA yielded a reliable and maximal CCEP across stimulation-response pairs over all regions. These findings were similar when examining the evoked gamma-band power. The amplitude of both measures was inversely correlated with distance. CCEPs and evoked gamma power were largest when measured in the hippocampus compared with other areas. Larger CCEP size and evoked gamma power were measured within the seizure onset zone compared with outside this zone.

Conclusion: These results will help guide future stimulation protocols directed at quantifying network connectivity across cognitive and disease states.

Keywords: Corticocortical evoked potential (CCEP); Gamma; Power; Single-pulse electrical stimulation (SPES); Stereoelectroencephalography (SEEG).


Conflict of interest statement

Declaration of competing interest The authors confirm there are no known conflicts of interest associated with this publication and there has been no significant financial support for this work that influenced its outcome.

Figures

Figure 1.
Figure 1.
CCEP response pattern to SPES and single-trial CCEPs and gamma responses across levels. (A) CCEP responses to SPES at 7.5 mA on electrode #5 (denoted by arrow) in left amygdala of patient 3 showing spread to anterior and posterior hippocampal leads. Color indicates mean absolute value of trial average CCEPs from 5 to 100 ms post-stimulation. Black electrodes contained artifact or were disabled. Responses remained ipsilateral to the location of stimulation in this example. (B) Single-trial CCEPs (blue) and gamma responses (black) recorded at 4 stimulation levels on electrode #4 in left hippocampus after SPES on electrode #5 in left amygdala. Asterisk indicates same CCEP data (electrode and level) between A and B. Polarity of voltage or power is marked on figure scale, + is up.
Figure 2.
Figure 2.
Normalized CCEP amplitude and gamma power (70-150 Hz) as a function of stimulation level. Boxplots indicate normalized medians, interquartile ranges, and extremes at each level. Normalization was performed by dividing each value by the mean across levels for each unique stimulation-response electrode pair. (A) Normalized CCEP amplitudes across 4 stimulation levels for 7 patients. Raw amplitudes had medians (ranges) of 62 (4-2138), 111 (7-2784), 128 (16-3545), 128 (15-3194) μV for each of the levels, respectively. CCEPs are from 387 stimulated electrodes in amygdala and hippocampus as well as neocortex and white-matter regions of the brain. The number of CCEPs at each level is indicated below each boxplot. Omnibus KW test shows main effect of stimulation amplitude (χ2=4.97*103, df=3, p=0). No difference was found between CCEPs at 7.5 and 10 mA. All other pairwise combinations were significantly different (pairwise rank-sum tests, p<0.05). (B) Omnibus KW test confirms main effect of stimulation amplitude (χ2=999, df=19, p=7.36*10−200). CCEP amplitudes across 20 stimulation levels for 6 patients. CCEPs are from 22 stimulated electrodes in amygdala and hippocampus as well as frontal and white-matter regions of the brain. No difference was found for all pairwise combinations of CCEPs at ≥5.5 mA. A trend of decreasing CCEP amplitude for lower values and a plateau-effect for higher values begins at ~5.0 mA. (C) Normalized gamma power across levels for the standard dataset. Omnibus KW test confirms main effect of stimulation amplitude (χ2=1.37*103, df=3, p=3.27*10−297). No difference was found between 7.5 and 10.0 mA for the “standard” and all pairwise combinations of ≥5.0 mA for the “high-resolution” datasets. (D) Normalized gamma power across levels for the “high-resolution” dataset. Omnibus KW test confirms main effect of stimulation amplitude (χ2=377, df=19, p=2.39*10−68). A plateau-effect begins at ~5.5 mA similar to CCEP amplitude.
Figure 3.
Figure 3.
CCEP amplitude and gamma power as a function of distance. (A) CCEP amplitude versus distance from stimulation combined across all patients and all stimulation levels. A steady decrease in amplitude occurs until ~50 mm. (B) Gamma-band power versus distance across all patients and all stimulation levels. An abrupt drop in power occurs at ~35 mm. (C, D) Spatial spread of CCEPs as a function of stimulation level. Error bars indicate 95% confidence. White boxes indicate total count per bin. C) Mean distance from stimulated electrodes to detected CCEPs across 4 levels and 7 patients. CCEPs are from 387 stimulated electrodes. Distance increases with each level (p<0.05). Significant pairwise comparisons are indicated with an asterisk. Mean distances (ranges) for each level are 14.2 (2.4-95.3), 16.4 (2.4-108.1), 17.6 (2.4108.1), 18.5 (2.4-108.1) mm, respectively. (D) Mean distance from stimulated electrodes to detected CCEPs across 20 levels and 6 patients. CCEPs are from 22 stimulated electrodes. No difference was found for all pairwise combinations of levels ≥3.5 mA. A transition to a plateau occurs at ~5.5 mA similar to CCEP amplitude versus level in Figure 2. A discontinuity occurs between 1 and 1.5 mA. This is because CCEPs at levels <1.5 mA primarily occurred on adjacent electrodes with spacings of ≤5 mm. The range of distances across all levels was 3.5-67.2 mm.
Figure 4.
Figure 4.
CCEP waveform shape comparisons across levels. Trial-averaged CCEP waveforms were compared across levels for individual stimulation-response pairs using the Pearson correlation coefficient. (A, B) Example waveforms demonstrating high and low correlations for 9.5 vs 10 mA (A) and 3.5 vs 10 mA (B), respectively. Stimulation was in the amygdala, and the CCEPs were recorded on an electrode in the hippocampus. Solid traces are the trial-average waveforms, and shaded areas indicate 95% confidence. Gray vertical bars indicate artifact region from −5 to 5 ms relative to stimulation. (C) Correlations of 3 levels (2.5, 5, 7.5 mA) compared with 10 mA for 7 patients. Boxplots show medians, interquartile ranges, and outliers for each comparison. Pairwise comparisons of all distributions showed significant differences (pairwise rank-sum test, p<0.05) and are indicated with an asterisk. (D) Correlations of 19 levels (0.5 by 0.5 to 9.5 mA) compared with 10.0 mA for 6 patients. No pairwise differences were found for the last 4 distributions (≥8 mA). Interquartile range demonstrates a transition to lower values at a level ≥~5.5 mA. (E,F) Heatmaps showing the median correlation for all pairwise combinations of levels for both the “standard” (E) and “high-resolution” (F) datasets. Color indicates median correlation coefficient scaled from 0.8 to 1. X- and Y-axes indicate level combination.
Figure 5.
Figure 5.
CCEP amplitude (A, B) and gamma power (C, D) comparisons by region of stimulation (A, C) and region of response (B, D). Asterisks show pairwise significance (pairwise rank-sum tests, p<0.05, Tukey-Kramer corrected). Numbers below each boxplot indicate count. Data were combined across all stimulation levels and all patients.
Figure 6.
Figure 6.
(A) CCEP amplitude and (B) gamma power response relative to whether the stimulation or response electrode or both were in the SOZ. Asterisks show significant difference between groups as defined by the model. Numbers below each boxplot indicate the count. Data were combined across all stimulation levels and all patients.

References

    1. Bressler SL, Menon V. Large-scale brain networks in cognition: emerging methods and principles. Trends Cogn Sci 2010;14:277–90. doi:10.1016/j.tics.2010.04.004. - DOI - PubMed
    1. Smith EH, Schevon CA. Toward a Mechanistic Understanding of Epileptic Networks. Curr Neurol Neurosci Rep 2016;16. doi:10.1007/s11910-016-0701-2. - DOI - PubMed
    1. Smith EH, Liou J- Y, Davis TS, Merricks EM, Kellis SS, Weiss SA, et al. The ictal wavefront is the spatiotemporal source of discharges during spontaneous human seizures. Nat Commun 2016;7:11098. doi:10.1038/ncomms11098. - DOI - PMC - PubMed
    1. Keller CJ, Honey CJ, Megevand P, Entz L, Ulbert I, Mehta AD, et al. Mapping human brain networks with cortico-cortical evoked potentials. Philos Trans R Soc B Biol Sci 2014;369:20130528-. doi:10.1098/rstb.2013.0528. - DOI - PMC - PubMed
    1. Prime D, Rowlands D, O’Keefe S, Dionisio S. Considerations in performing and analyzing the responses of cortico-cortical evoked potentials in stereo-EEG. Epilepsia 2018;59:16–26. doi:10.1111/epi.13939. - DOI - PubMed

Publication types