. 2020 Jun 6;13(1):26.
doi: 10.1186/s13072-020-00345-9.

Linker histone epitopes are hidden by in situ higher-order chromatin structure

Affiliations

Linker histone epitopes are hidden by in situ higher-order chromatin structure

Vladimir B Teif et al. Epigenetics Chromatin. .

Abstract

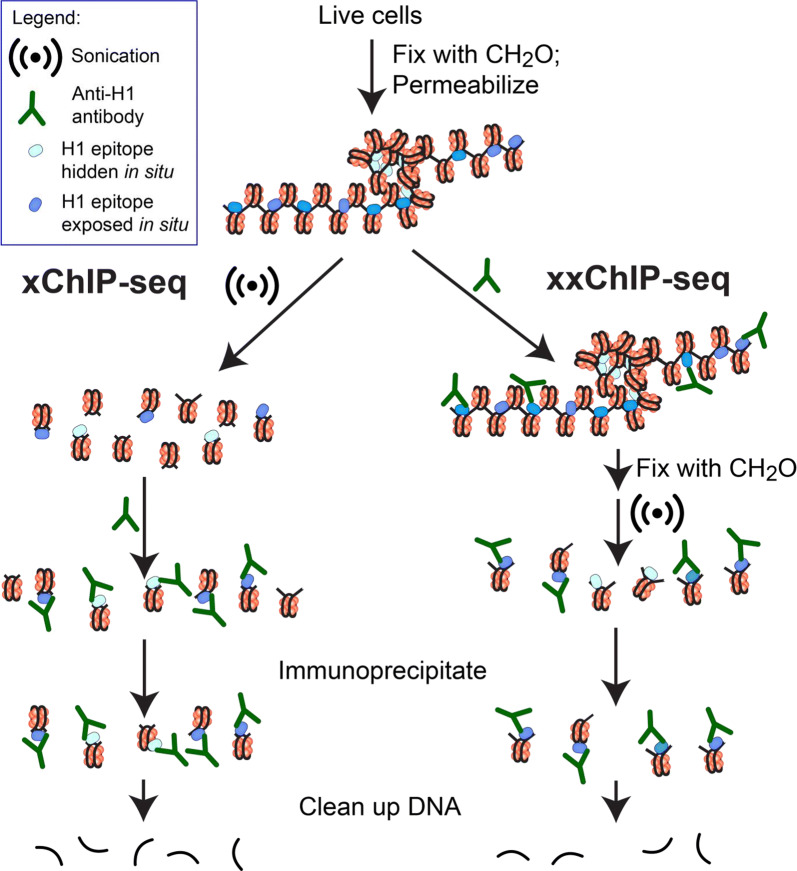
Background: Histone H1 is the most mobile histone in the cell nucleus. Defining the positions of H1 on chromatin in situ, therefore, represents a challenge. Immunoprecipitation of formaldehyde-fixed and sonicated chromatin, followed by DNA sequencing (xChIP-seq), is traditionally the method for mapping histones onto DNA elements. But since sonication fragmentation precedes ChIP, there is a consequent loss of information about chromatin higher-order structure. Here, we present a new method, xxChIP-seq, employing antibody binding to fixed intact in situ chromatin, followed by extensive washing, a second fixation, sonication and immunoprecipitation. The second fixation is intended to prevent the loss of specifically bound antibody during washing and subsequent sonication and to prevent antibody shifting to epitopes revealed by the sonication process. In many respects, xxChIP-seq is comparable to immunostaining microscopy, which also involves interaction of the primary antibody with fixed and permeabilized intact cells. The only epitopes displayed after immunostaining are the "exposed" epitopes, not "hidden" by the fixation of chromatin higher-order structure. Comparison of immunoprecipitated fragments between xChIP-seq versus xxChIP-seq should indicate which epitopes become inaccessible with fixation and identify their associated DNA elements.

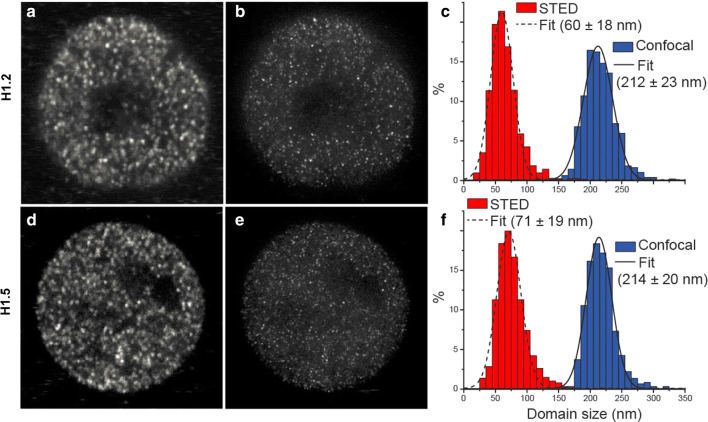
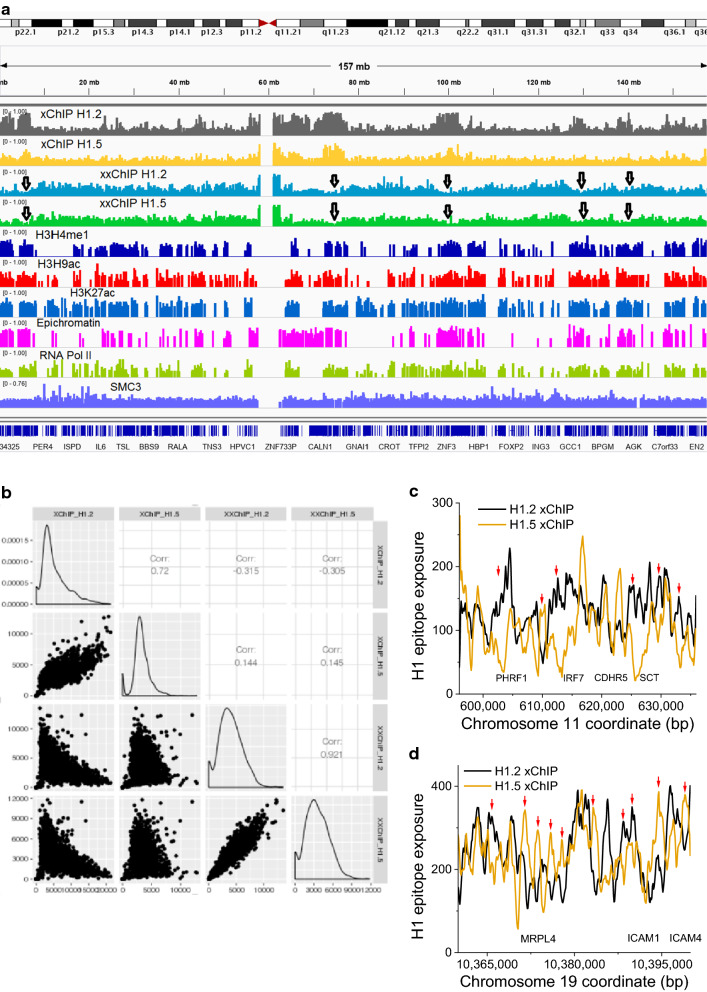
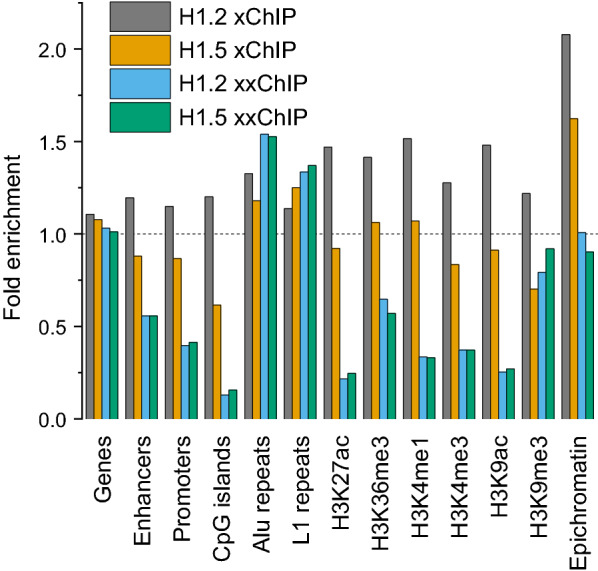
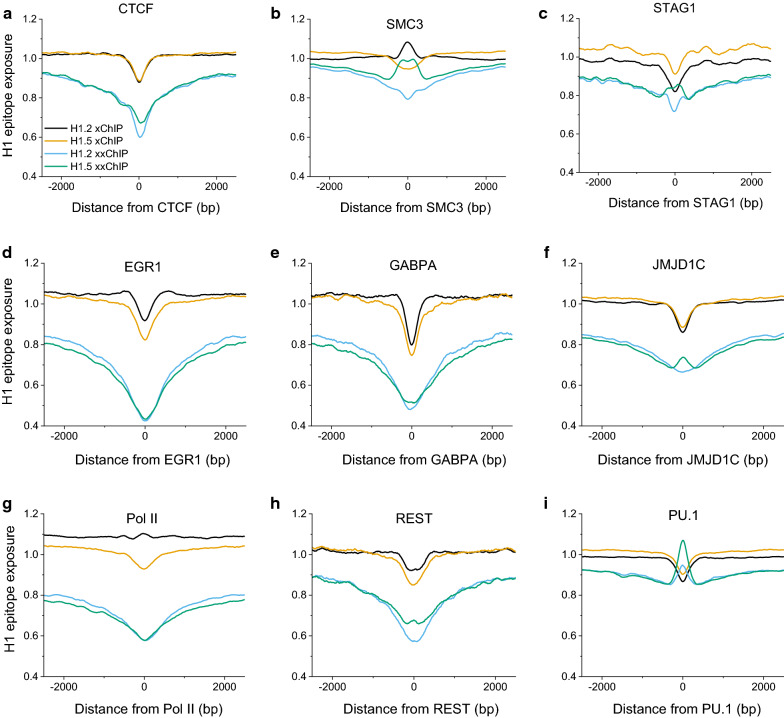
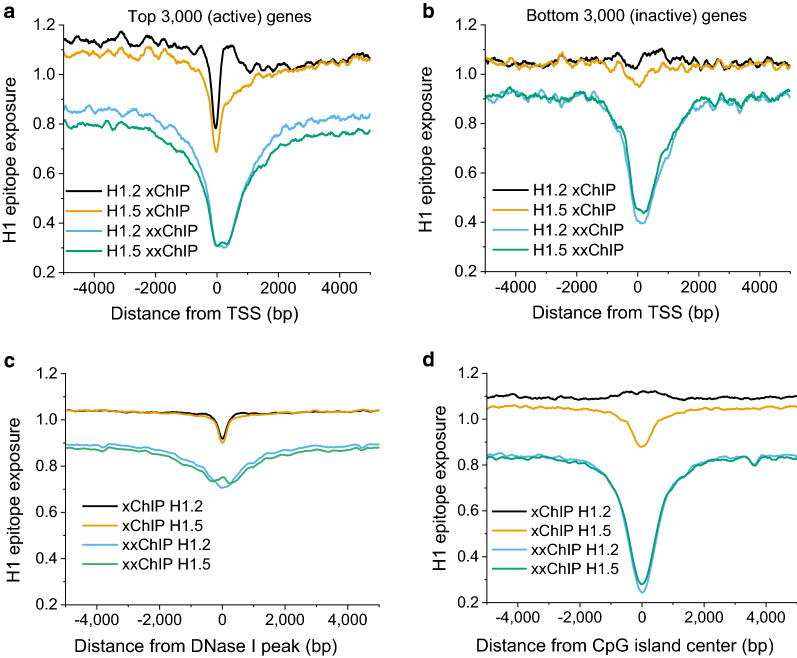
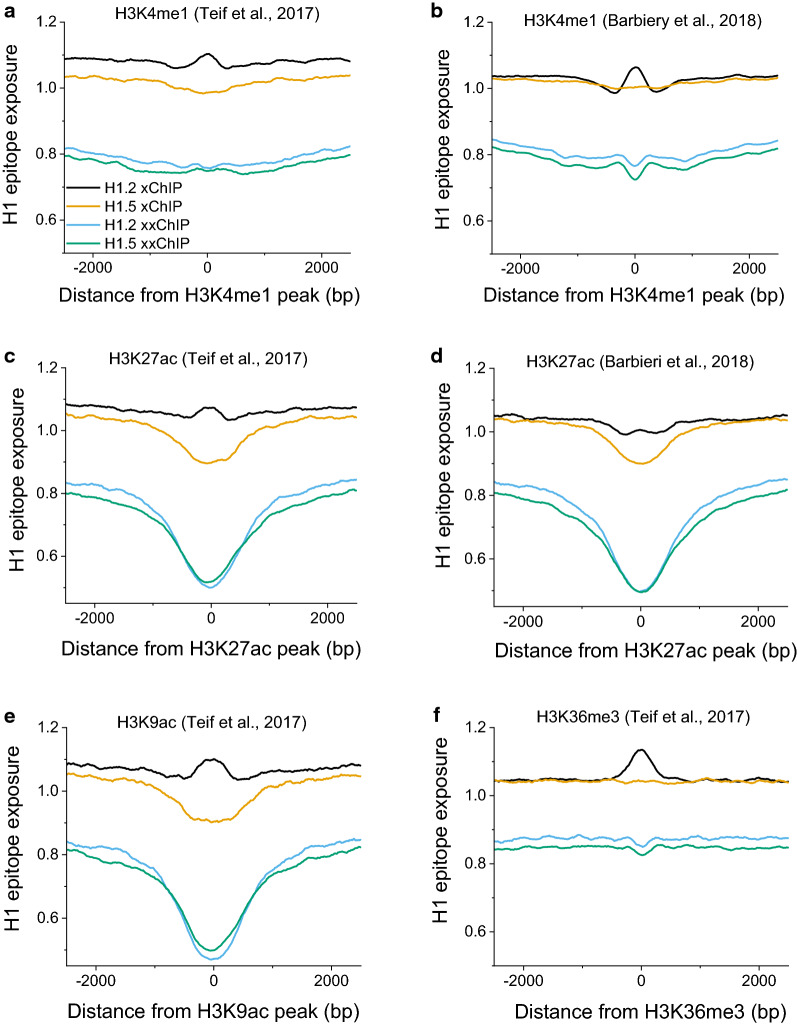
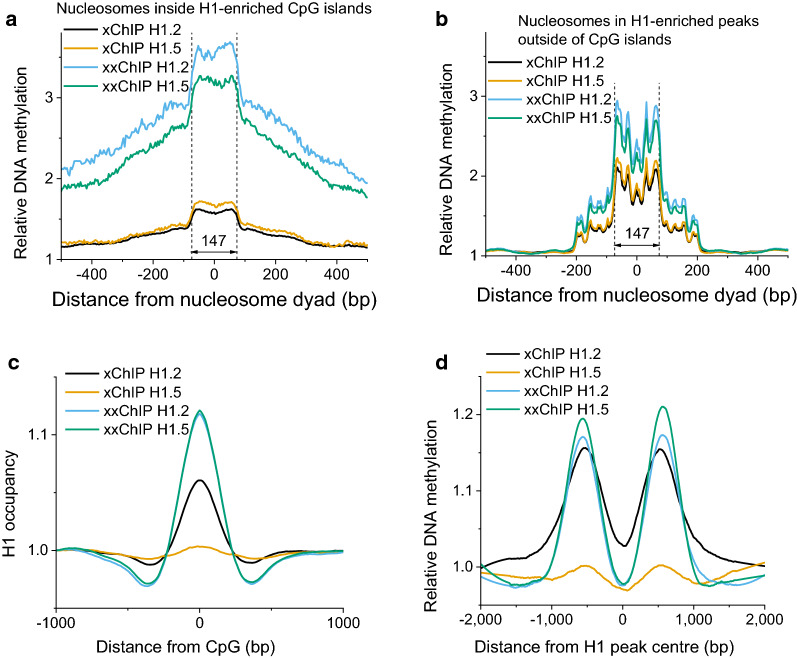
Results: We determined the genomic distribution of histone variants H1.2 and H1.5 in human myeloid leukemia cells HL-60/S4 and compared their epitope exposure by both xChIP-seq and xxChIP-seq, as well as high-resolution microscopy, illustrating the influences of preserved chromatin higher-order structure in situ. We found that xChIP and xxChIP H1 signals are in general negatively correlated, with differences being more pronounced near active regulatory regions. Among the intriguing observations, we find that transcription-related regions and histone PTMs (i.e., enhancers, promoters, CpG islands, H3K4me1, H3K4me3, H3K9ac, H3K27ac and H3K36me3) exhibit significant deficiencies (depletions) in H1.2 and H1.5 xxChIP-seq reads, compared to xChIP-seq. These observations suggest the existence of in situ transcription-related chromatin higher-order structures stabilized by formaldehyde.

Conclusion: Comparison of H1 xxChIP-seq to H1 xChIP-seq allows the development of hypotheses on the chromosomal localization of (stabilized) higher-order structure, indicated by the generation of "hidden" H1 epitopes following formaldehyde crosslinking. Changes in H1 epitope exposure surrounding averaged chromosomal binding sites or epigenetic modifications can also indicate whether these sites have chromatin higher-order structure. For example, comparison between averaged active or inactive promoter regions suggests that both regions can acquire stabilized higher-order structure with hidden H1 epitopes. However, the H1 xChIP-seq comparison cannot define their differences. Application of the xxChIP-seq versus H1 xChIP-seq method is particularly relevant to chromatin-associated proteins, such as linker histones, that play dynamic roles in establishing chromatin higher-order structure.


Conflict of interest statement

The authors declare that they have no competing interests.

Figures

Fig. 1
Fig. 1
A scheme explaining the difference between the xChIP-seq and xxChIP-seq protocols. Note that the DNA sequences that are associated with “hidden” epitopes in situ are revealed by xChIP-seq, but not with xxChIP-seq. This scheme does not specify the type of chromatin higher-order structure involved in creating the “hidden” H1 epitope. “Masking” proteins, capable of “blocking” the H1 epitope in vivo, certainly can exist. Probably, the first formaldehyde fixation will covalently attach these proteins to H1 (and mask the epitope), such that the sonicated products cannot be immunoprecipitated at any point in the protocol. The xxChIP-seq versus the xChIP-seq comparison depends upon the differences in “exposed” H1 epitopes. If the masking protein is “knocked-off” during the xChIP sonication, exposing the H1 epitope, it will “mimic” higher-order structure, which is (presumably) also destroyed during the xChIP sonication, exposing H1 epitopes. “Higher-order chromatin structure” is only detected after anti-H1 binding, washing, a second formaldehyde fixation and sonication (xxChIP). Any exposure of H1 epitopes, at this point, will be undetected, since there is no further incubation with anti-H1 antibodies. Immunoprecipitation occurs because the Protein A/G agarose captures chromatin fragments by their covalently bound IgG (anti-H1) molecules
Fig. 2
Fig. 2
Images and statistics of size distributions of H1.2 (ac) and H1.5 (df) punctate chromatin domains (“chromomeres”) based on confocal (a and d) and STED (b and e) microscopy. Cells were fixed with HCHO, permeabilized with Triton X-100/PBS and blocked with 5% normal goat serum/PBS prior to immunostaining, as described earlier (24)
Fig. 3
Fig. 3
Large-scale (low resolution) and small-scale (high resolution) comparisons between xChIP and xxChIP sequencing strategies. a H1 epitope “exposure” peak densities over chromosome 7, as measured by scanning with a window of 1000 base pairs: for xChIP H1.2 (dark blue), xChIP H1.5 (magenta), xxChIP H1.2 (orange) and xxChIP H1.5 (green). Black arrowheads show enrichments (compared to surrounding regions) of xChIP-seq reads for H1.2 and H1.5, coupled with deficiencies for xxChIP-seq reads of H1.2 and H1.5 at the same locations. Also indicated are cytogenetic road marks, DNA lengths (mb), the epichromatin track [23], and tracks for the density of peaks enriched with H3K4me1, H3K9ac, H3K27ac, Pol II and SMC3. b Pairwise correlations between xChIP H1.2, xChIP H1.5, xxChIP H1.2 and xxChIP H1.5 signals, averaged over three replicates each, using a 1000-bp sliding window. Note that xChIP H1.2 versus xChIP H1.5 and xxChIP H1.2 versus xxChIP H1.5 reveal clear positive correlations; whereas, the xChIP signals reveal negative correlations with the xxChIP signals. c and d Examples of genomic regions at high resolution, showing distinct patterns of histone occupancy for aligned reads of H1.2 (black) and H1.5 (orange) xChIP-seq. The raw xChIP-seq signal was smoothed by averaging with a 100-bp running window
Fig. 4
Fig. 4
Enrichment/depletion of different genomic features within anti-H1.2 and anti-H1.5 immunoprecipitated domains determined with MUSIC peak calling. Fold changes (Y-axis) above 1.0 indicate enrichment, compared to the genomic average; below 1.0, indicate depletion. Indicated are several histone post-translational modifications (PTMs) and their usual functional associations: H3K27ac and H3K4me1, active enhancers; H3K4me3, active promoters; H3K9ac, active regions; H3K9me3, heterochromatin; H3K36me3, gene body of actively transcribed genes
Fig. 5
Fig. 5
Profiles of H1 epitope exposure in HL-60/S4 cells, centered around different protein-binding sites on DNA as defined by ChIP-seq in HL-60 cells (see Methods). The different DNA-binding proteins/functions: CTCF defines chromosome loops; SMC3, subunit of cohesin; STAG1, subunit of cohesin; EGR1, transcription factor (TF); GABPA, TF; JMJD1C, histone demethylase; Pol II, RNA polymerase; REST, TF; SPI1, TF. Note that the xxChIP profiles for H1.2 and H1.5 “track” together, which always display reduced H1 epitope exposure around the center of the binding site (0). Generally, the xChIP profiles track together, sometimes in the same direction as the xxChIP profiles (EGR1, GABPA, JMJD1C, REST and SPI1); sometimes in the opposite direction (CTCF and STAG1). Interestingly, both Pol II and SMC3 indicate a divergence of the xChIP profiles around the center of the binding site
Fig. 6
Fig. 6
Average H1 epitope exposure in undifferentiated HL-60/S4 cells around transcription start sites, “open” chromatin regions and CpG islands. a, b xChIP and xxChIP signals around TSS for two groups of genes, sorted by their normalized expression in HL-60/S4 cells (Teif et al.[ 31]): 3000 genes with expression at the top percentile (a) and 3000 genes with expression at the bottom percentile (b). c xChIP and xxChIP H1 profiles around “open” chromatin regions (ENCODE DNase I hypersensitive regions in HL-60 cells) [34]. d xChIP and xxChIP H1 profiles around CpG islands. Both xChIP and xxChIP datasets reveal an average “dip” in H1 epitope exposure around the middle of TSS regions; but, clearest with the top percentile genes. The “dip” observed with xChIP may represent the occupancy paucity of H1 in the TSS; xxChIP may emphasize an additional steric “hiding” of the H1 epitopes by proteins involved in active gene expression
Fig. 7
Fig. 7
H1 epitope exposure in undifferentiated HL-60/S4 cells surrounding average genomic regions enriched for different histone modifications. Histone modifications have been mapped using ChIP-seq data in HL-60/S4 cells (Teif et al. [31] or HL-60 cells (Barbieri et al. [32]), as specified in the figure. Both H3K4me1 and H3K27ac are usually associated with active enhancers
Fig. 8
Fig. 8
Nucleosome repeat length (NRL) calculated inside chromatin domains enriched with H1.2 and H1.5 based on xChIP and xxChIP, as indicated in the figure. a Normalized frequency distribution of nucleosome–nucleosome distances. b Linear fit of the peak summit positions from the left panel. The slope of the fit line gives the NRL
Fig. 9
Fig. 9
a, b Average profiles of DNA methylation aligned with respect to the centers of nucleosomes determined in HL-60/S4 cells using MNase-assisted xChIP-seq of histone H3 for nucleosomes inside peaks enriched with xChIP H1.2 (black) and xChIP H1.5 (orange), as well as xxChIP-seq of histone H1.2 (blue) and H1.5 (green). a Only nucleosomes inside H1-enriched peaks inside CpG islands are considered. b Only nucleosomes inside H1-enriched peaks outside CpG islands. c Average profiles of H1 epitope exposure around individual CpGs genome-wide. d Average profiles of DNA methylation around centers of H1-enriched peaks

References

    1. Bednar J, Hamiche A, Dimitrov S. H1-nucleosome interactions and their functional implications. Biochim Biophys Acta. 2016;1859:436–443. - PubMed
    1. Bednar J, Garcia-Saez I, Boopathi R, Cutter AR, Papai G, Reymer A, Syed SH, Lone IN, Tonchev O, Crucifix C, et al. Structure and dynamics of a 197 bp nucleosome in complex with linker histone H1. Mol Cell. 2017;66(384–397):e388. - PMC - PubMed
    1. Crane-Robinson C. Linker histones: history and current perspectives. Biochim Biophys Acta. 2016;1859:431–435. - PubMed
    1. Cutter AR, Hayes JJ. Linker histones: novel insights into structure-specific recognition of the nucleosome. Biochem Cell Biol. 2017;95:171–178. - PMC - PubMed
    1. Kalashnikova AA, Rogge RA, Hansen JC. Linker histone H1 and protein-protein interactions. Biochim Biophys Acta. 2016;1859:455–461. - PMC - PubMed

Publication types