

CT Manifestations and Clinical Characteristics of 1115 Patients with Coronavirus Disease 2019 (COVID-19): A Systematic Review and Meta-analysis
- PMID: 32505599
- PMCID: PMC7200137
- DOI: 10.1016/j.acra.2020.04.033
CT Manifestations and Clinical Characteristics of 1115 Patients with Coronavirus Disease 2019 (COVID-19): A Systematic Review and Meta-analysis
Abstract
Rationale and objectives: We aimed to assess the prevalence of significant computed tomographic(CT) manifestations and describe some notable features based on chest CT images, as well as the main clinical features of patients with coronavirus disease 2019(COVID-19).
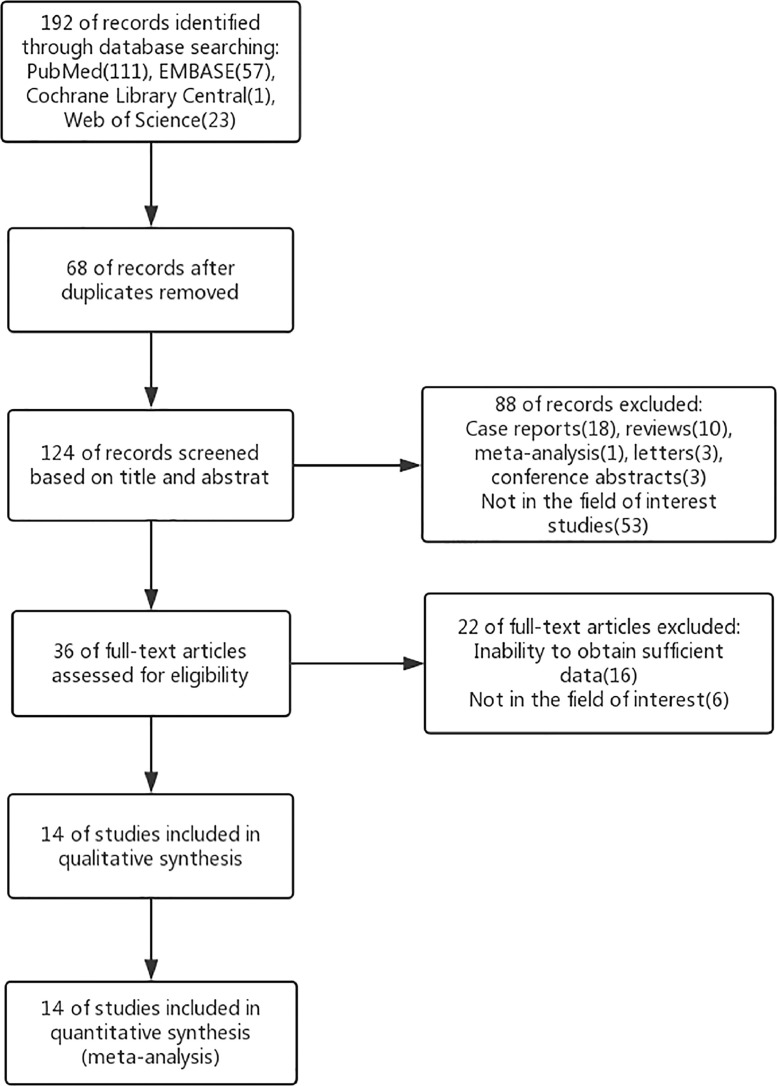
Materials and methods: A systematic literature search of PubMed, EMBASE, the Cochrane Library, and Web of Science was performed to identify studies assessing CT features, clinical, and laboratory results of COVID-19 patients. A single-arm meta-analysis was conducted to obtain the pooled prevalence and 95% confidence interval (95% CI).
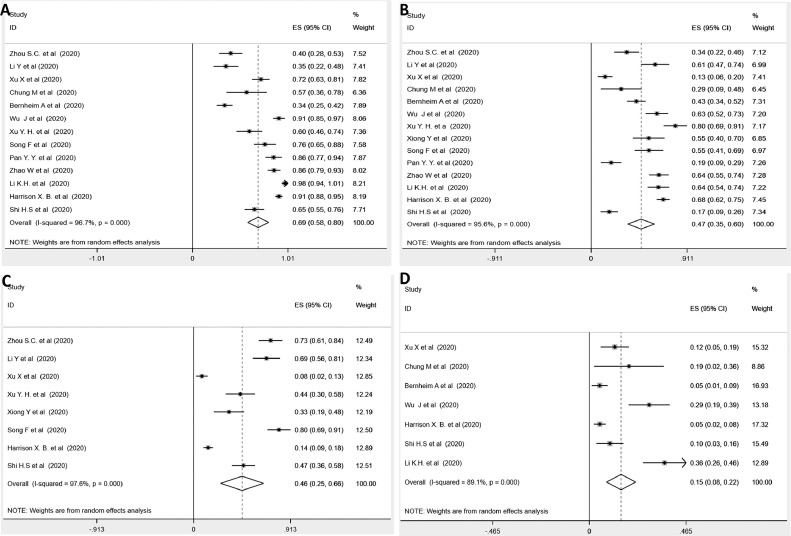
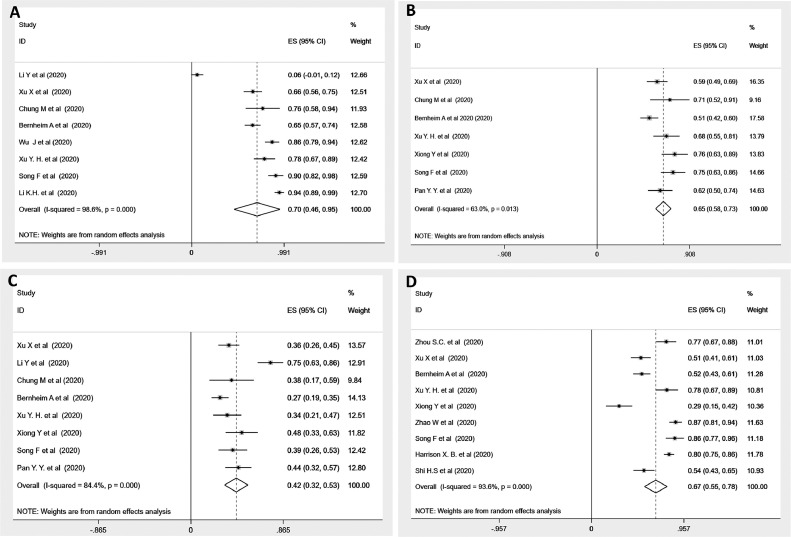
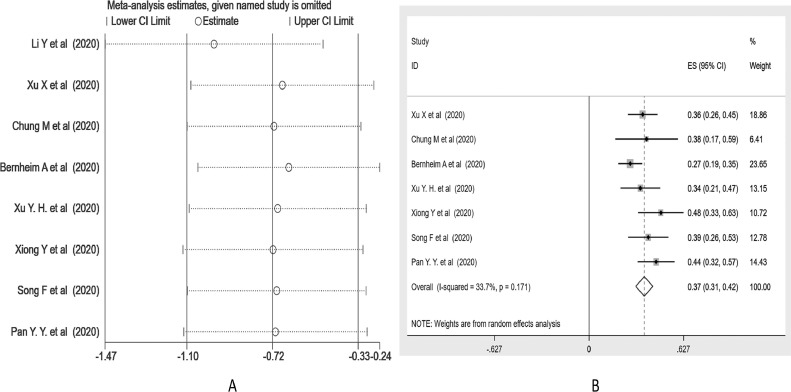
Results: A total of 14 articles (including 1115 patients) based on chest CT images were retrieved. In the lesion patterns on chest CTs, we found that pure ground-glass opacities (GGO) (69%, 95% CI 58-80%), consolidation (47%, 35-60%) and "air bronchogram sign" (46%, 25-66%) were more common than the atypical lesion of "crazy-paving pattern" (15%, 8-22%). With regard to disease extent and involvement, 70% (95% CI 46-95%) of cases showed a location preference for the right lower lobe, 65% (58-73%) of patients presented with ≥3 lobes involvement, and meanwhile, 42% (32-53%) of patients had involvement of all five lobes, while 67% (55-78%) of patients showed a predominant peripheral distribution. An understanding of some important CT features might be helpful for medical surveillance and management. In terms of clinical features, muscle soreness (21%, 95% CI 15-26%) and diarrhea (7%, 4-10%) were minor symptoms compared to fever (80%, 74-87%) and cough (53%, 33-72%).
Conclusion: Chest CT manifestations in patients with COVID-19, as well as its main clinical characteristics, might be helpful in disease evolution and management.
Keywords: COVID-19; CT manifestations; Clinical features; Laboratory; Meta-analysis.
Copyright © 2020 The Association of University Radiologists. Published by Elsevier Inc. All rights reserved.
Figures
References
-
- WHO website. Coronavirus disease (COVID-19) technical guidance: early investigations. Available at: http://www.who.int/emergencies/diseases/novel-coronavirus-2019/technical.... Accessed February 15, 2020.
-
- WHO website. Statement on the second meeting of the International Health Regulations (2005) Emergency Committee regarding the outbreak of novel coronavirus (2019-nCoV). Available at: http://www.who.int/news-room. Accessed February 25, 2020.
-
- KSIAZEK T. A novel coronavirus associated with severe acute respiratory syndrome. N Engl J Med. 2003;348:1953–1966. - PubMed
-
- Drosten C., Günther S., Preiser W. Identification of a Novel Coronavirus in Patients with Severe Acute Respiratory Syndrome. N Engl J Med. 2003;348:1967–1976. - PubMed
-
- Zaki A.M., van Boheemen S., Bestebroer T.M., Osterhaus A.D.M.E., Fouchier R.A.M. Isolation of a Novel Coronavirus from a Man with Pneumonia in Saudi Arabia. N Engl J Med. 2012;367:1814–1820. - PubMed
Publication types
MeSH terms
Substances
LinkOut - more resources
Full Text Sources
Medical
Research Materials
