. 2020 Jul:89:102225.
doi: 10.1016/j.ceca.2020.102225. Epub 2020 May 30.

GCaMP as an indirect measure of electrical activity in rat trigeminal ganglion neurons

Affiliations

GCaMP as an indirect measure of electrical activity in rat trigeminal ganglion neurons

Jane E Hartung et al. Cell Calcium. 2020 Jul.

Abstract

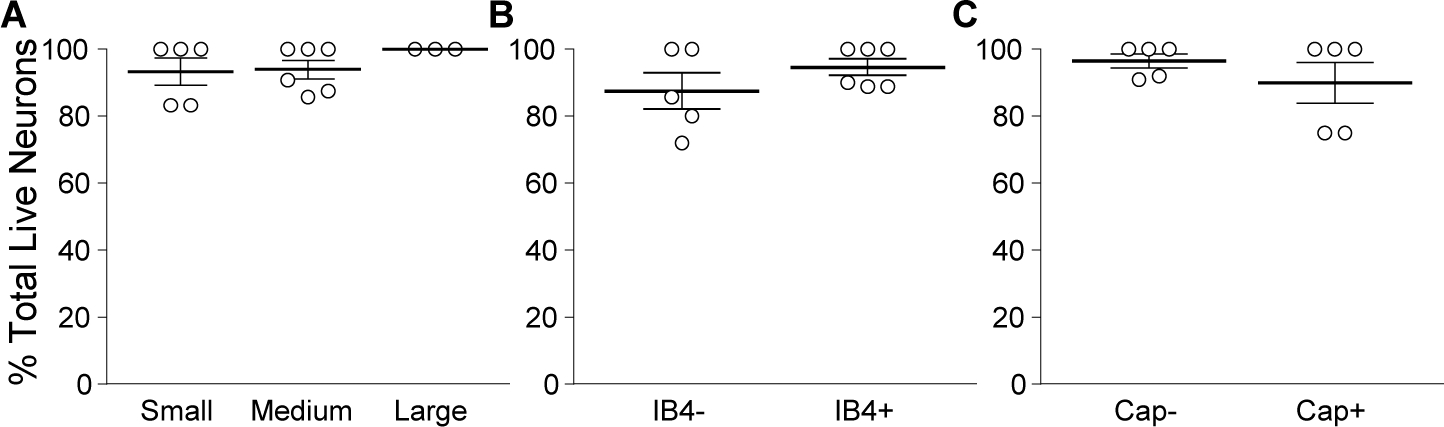
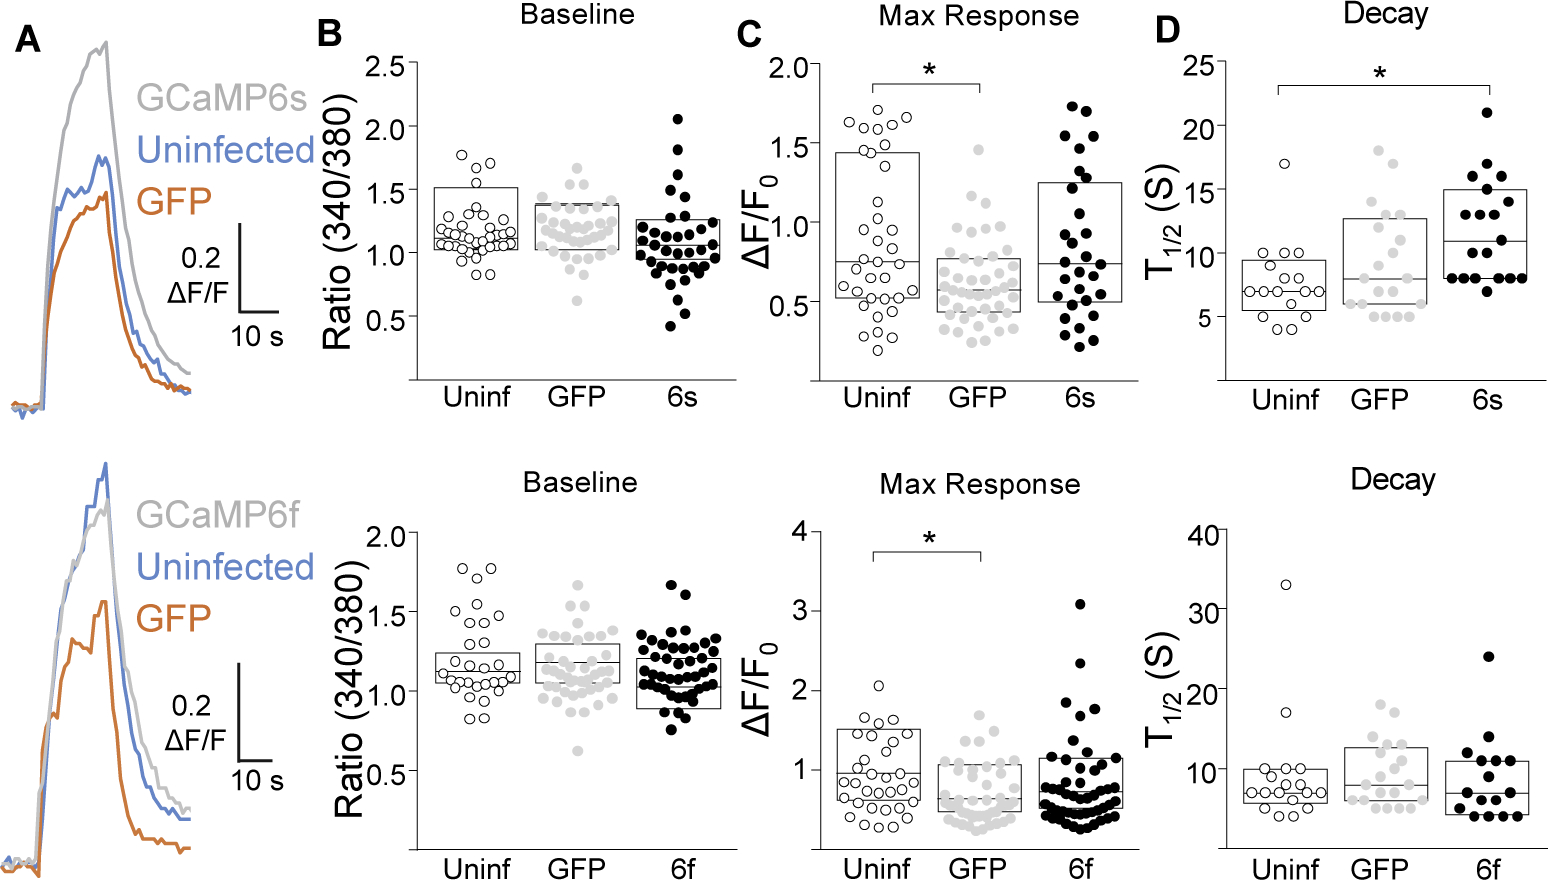
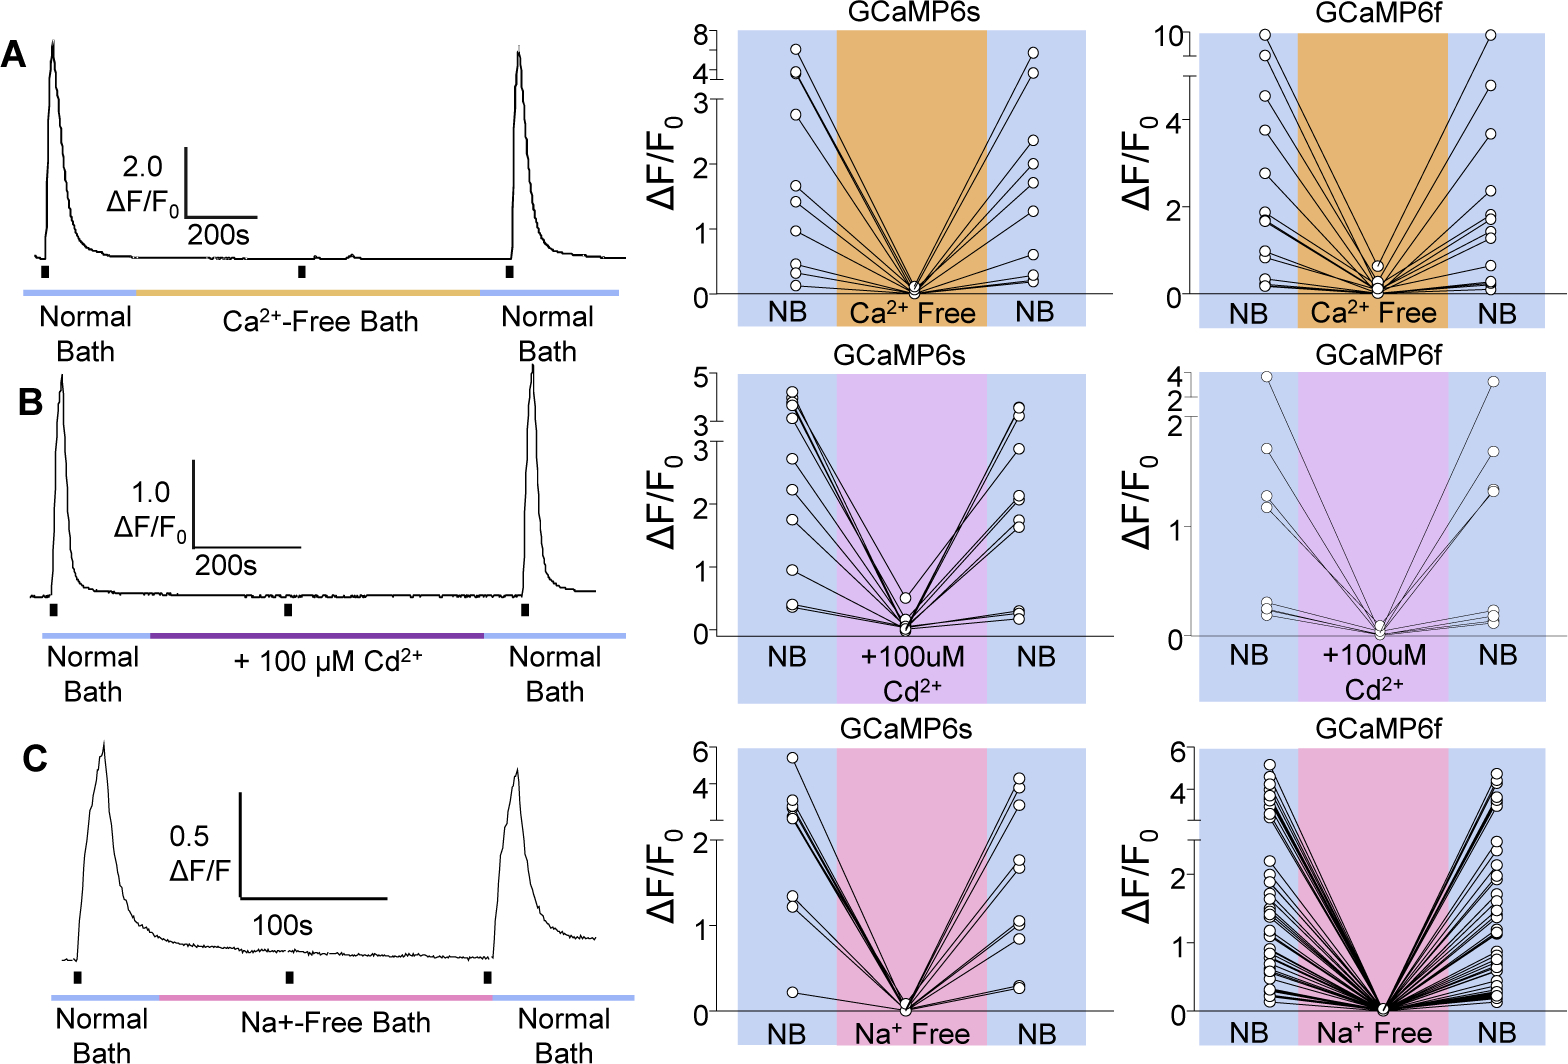
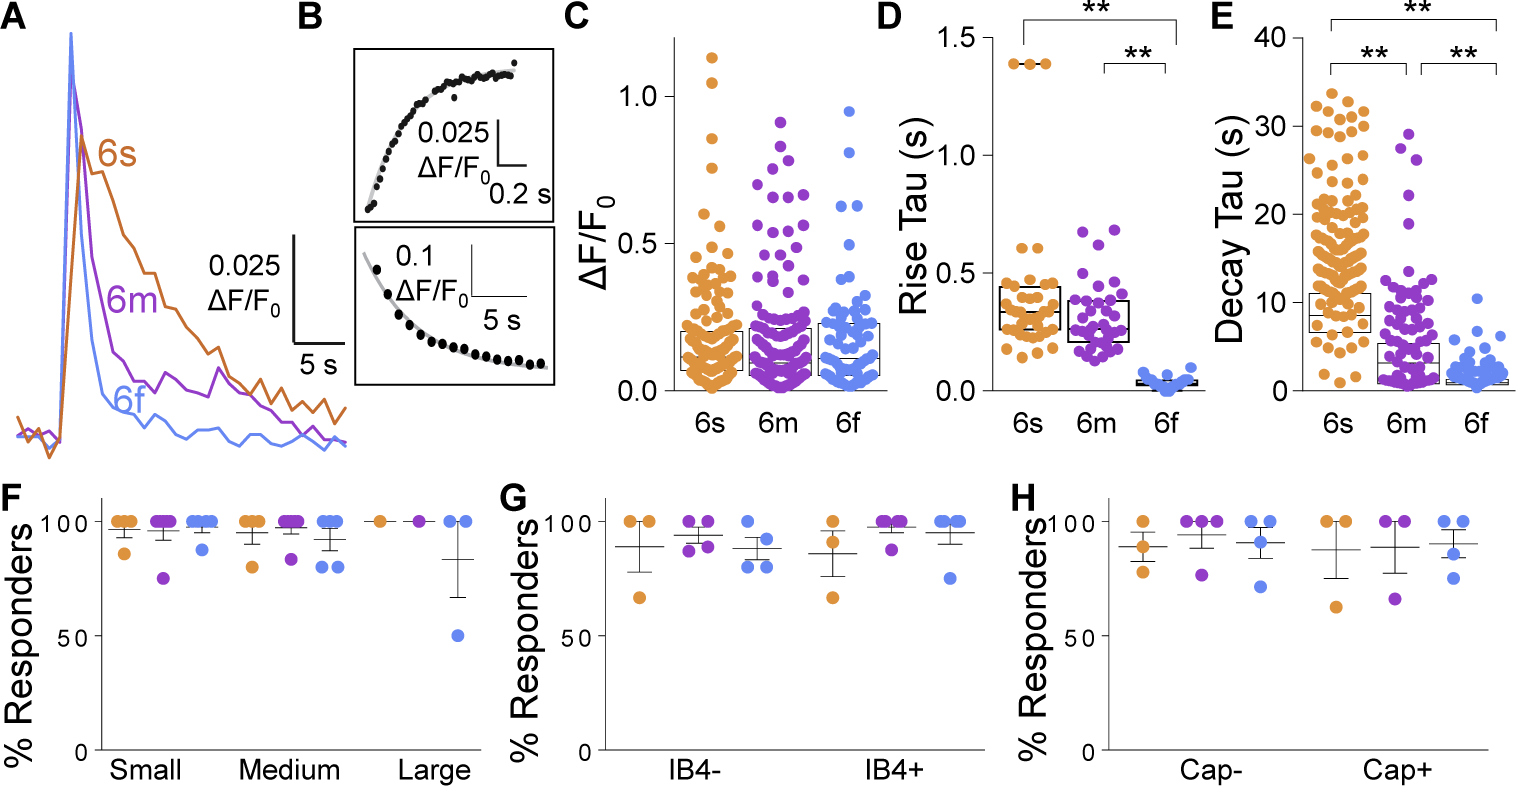
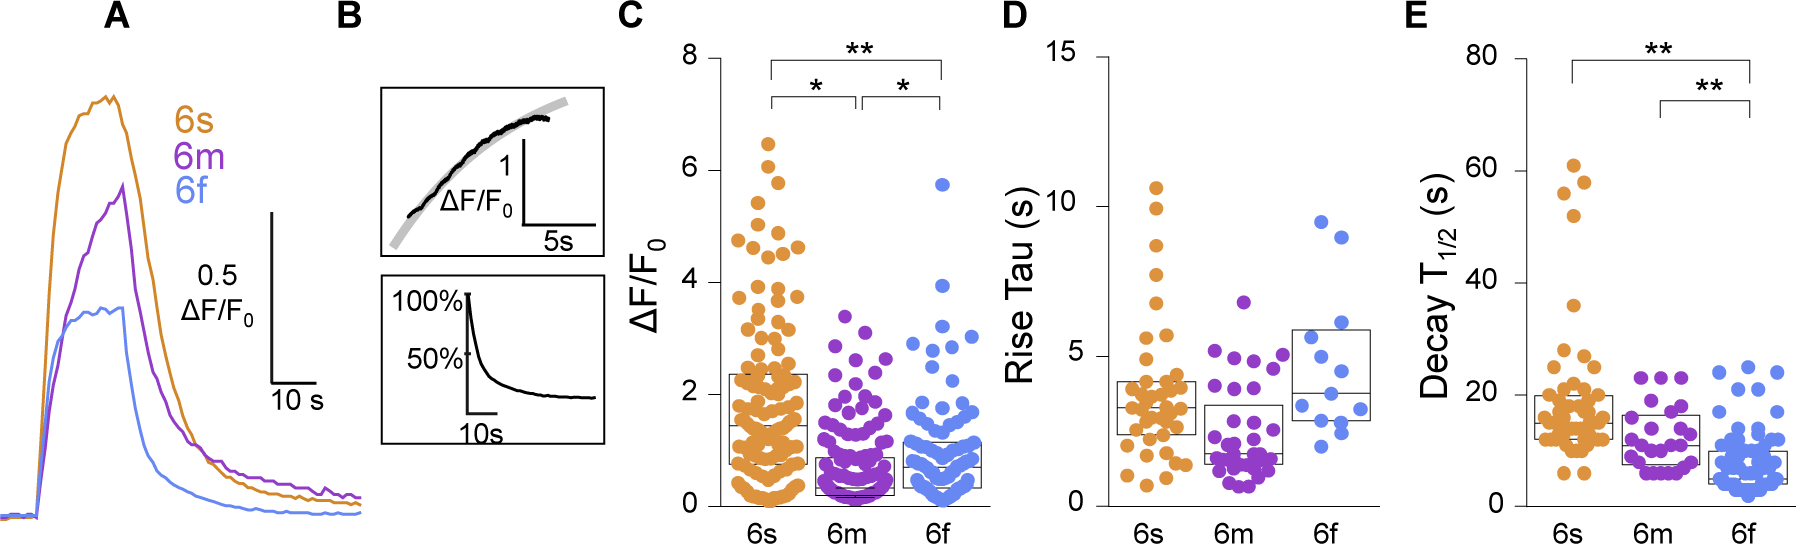
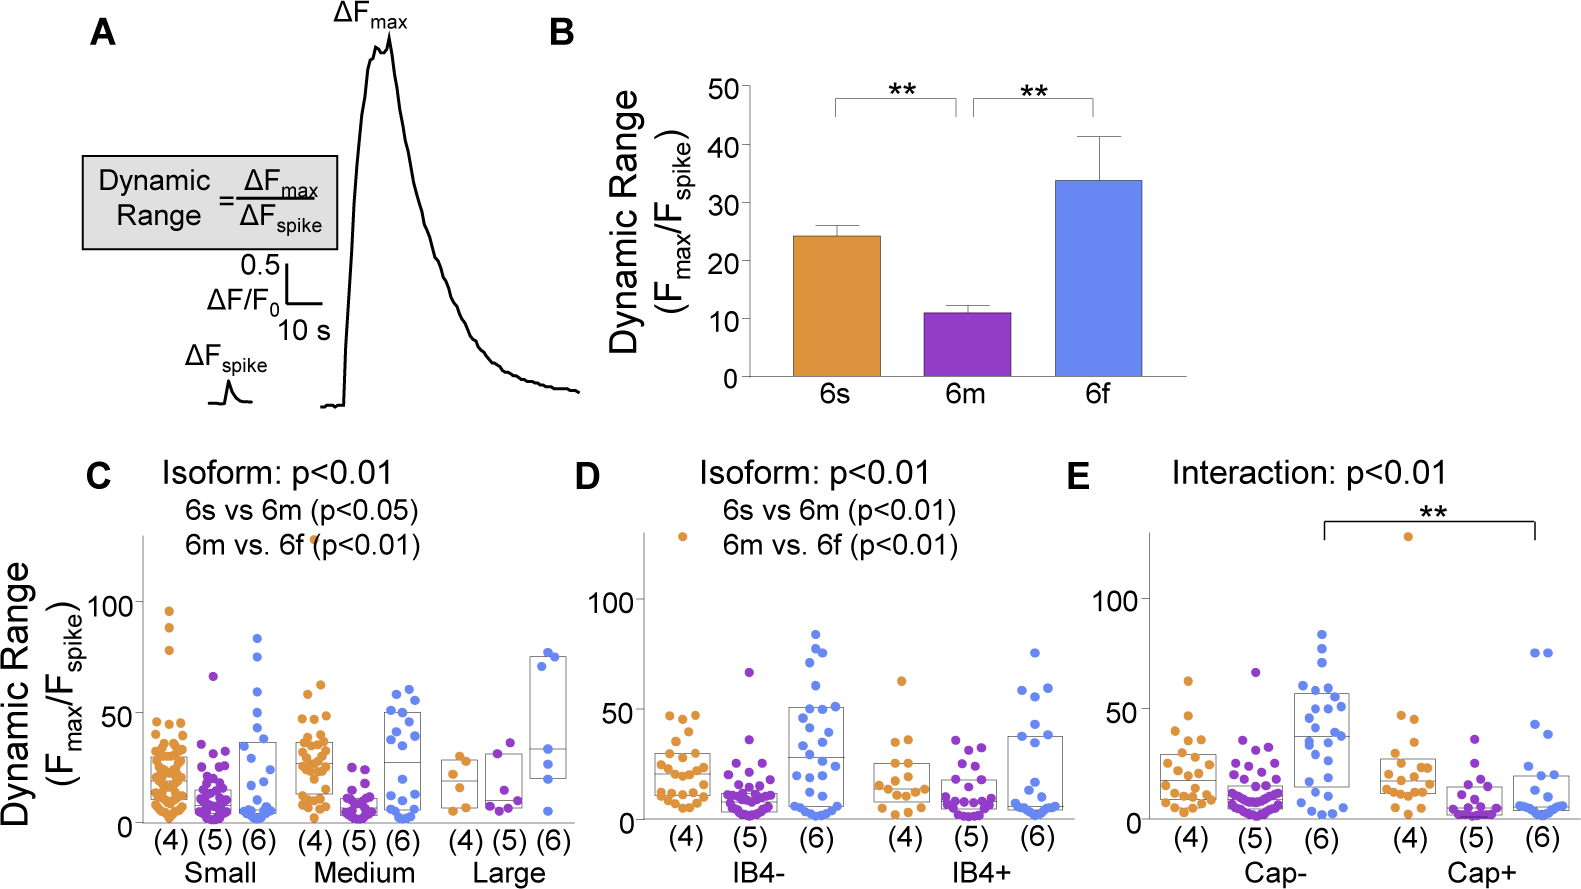
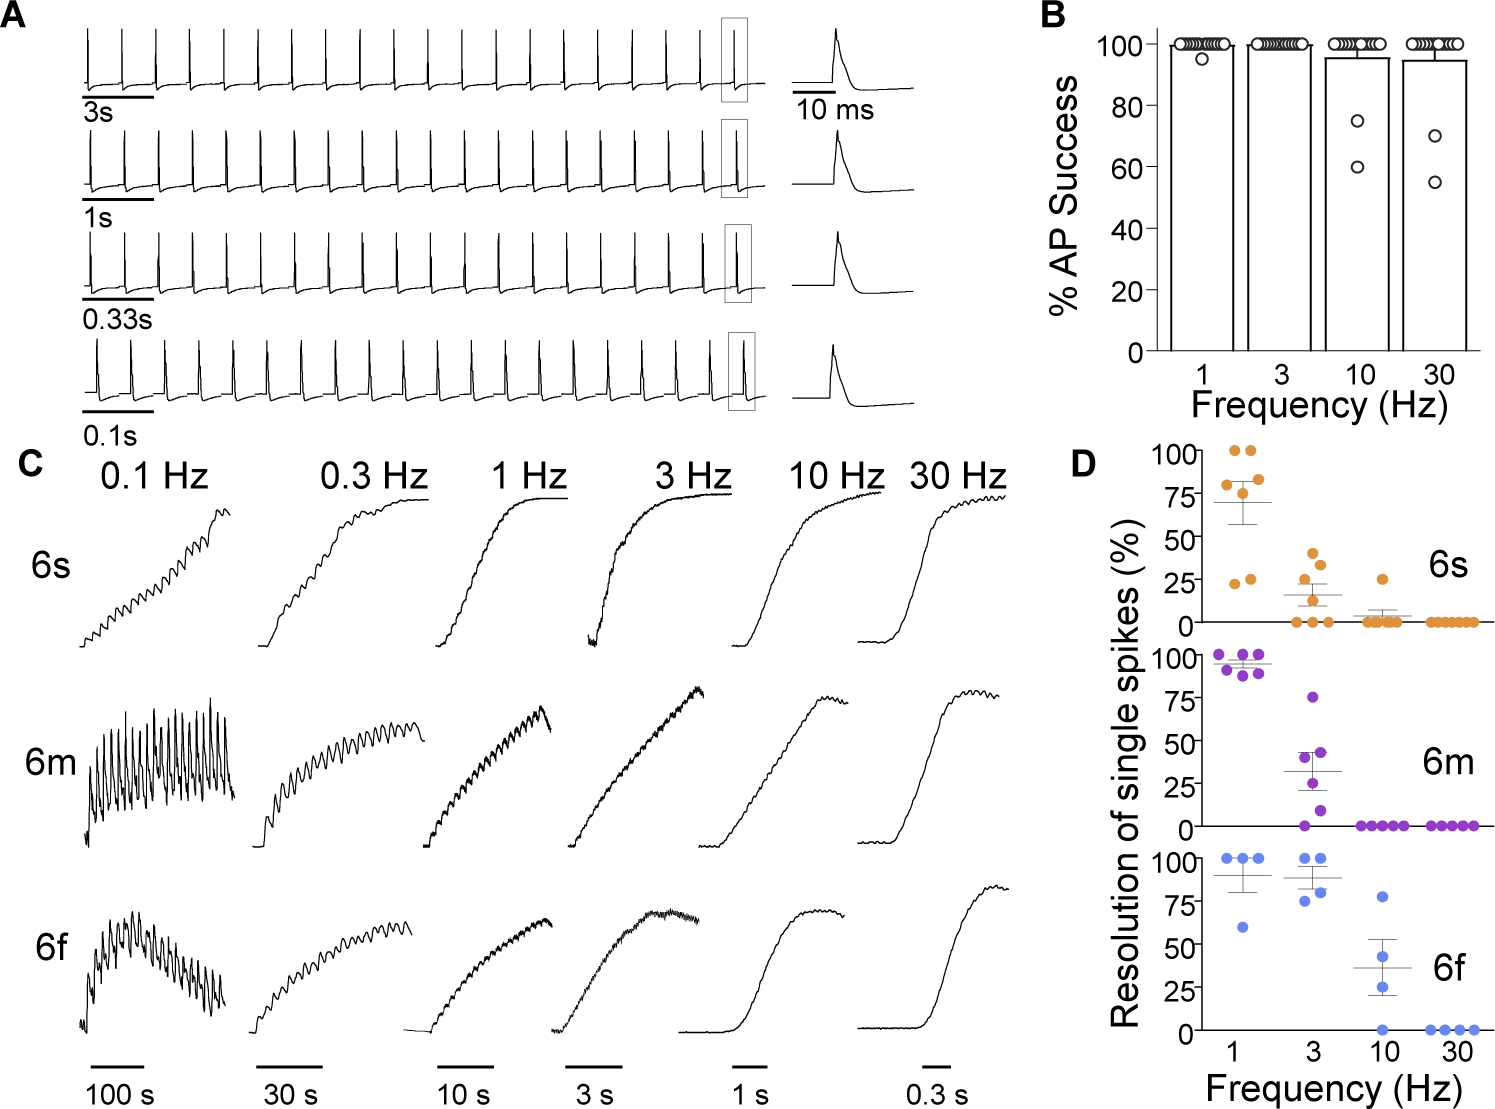
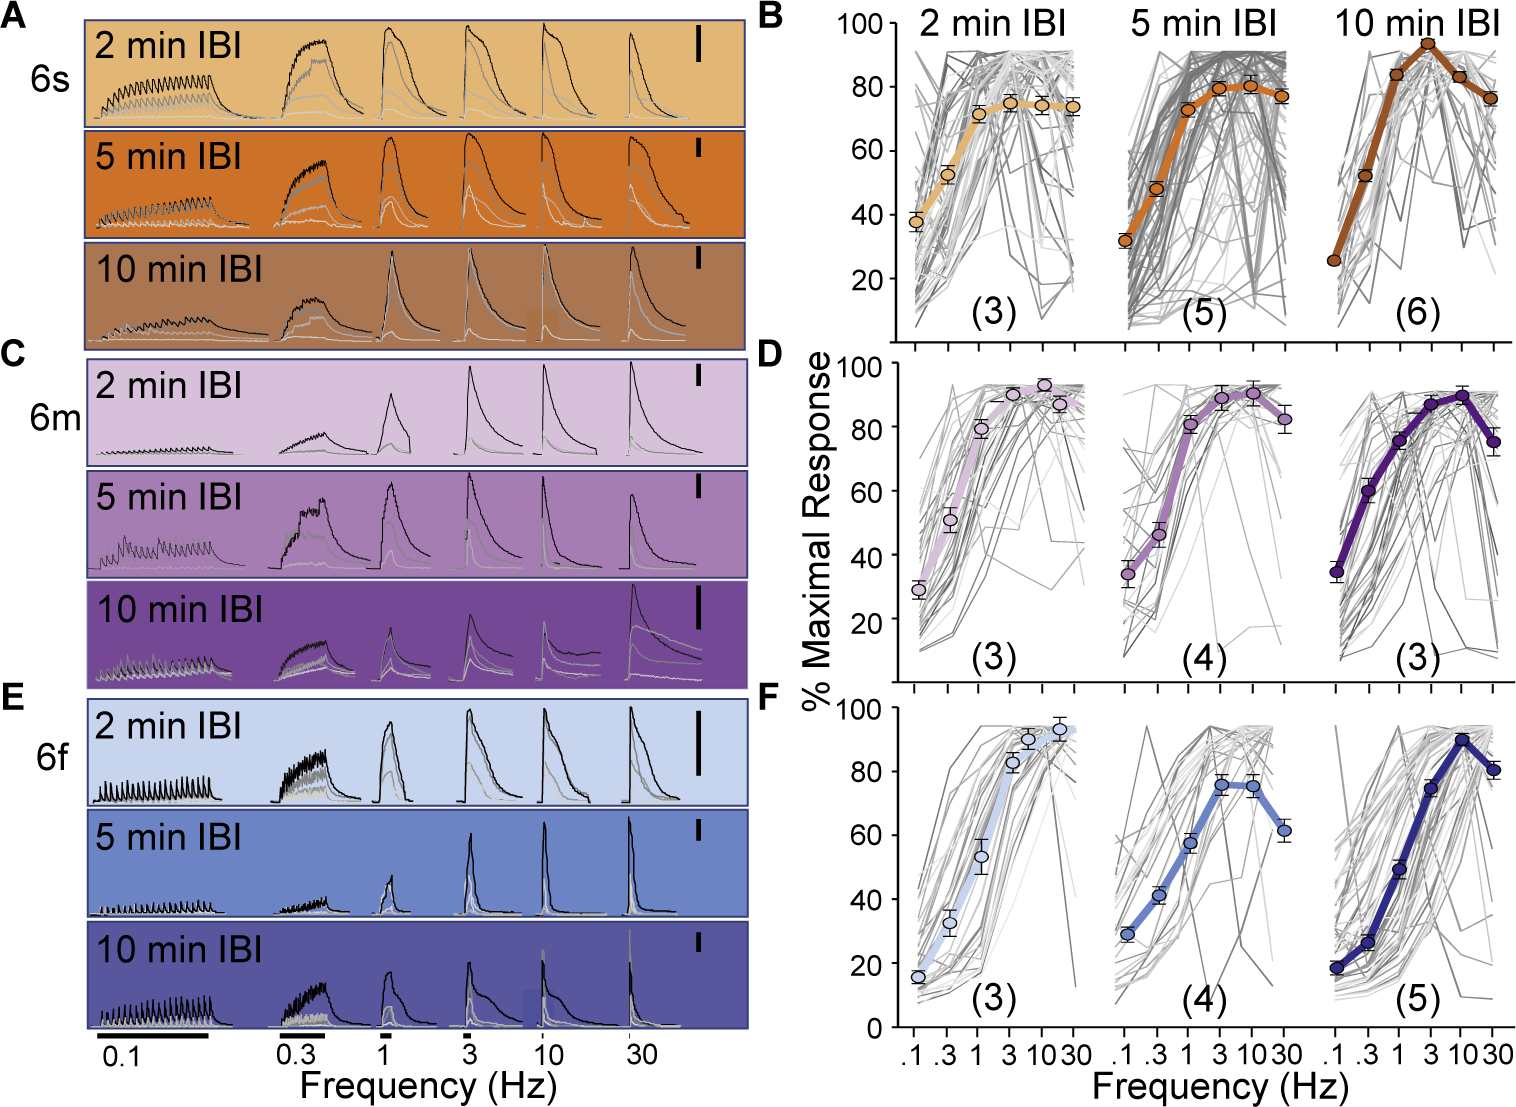
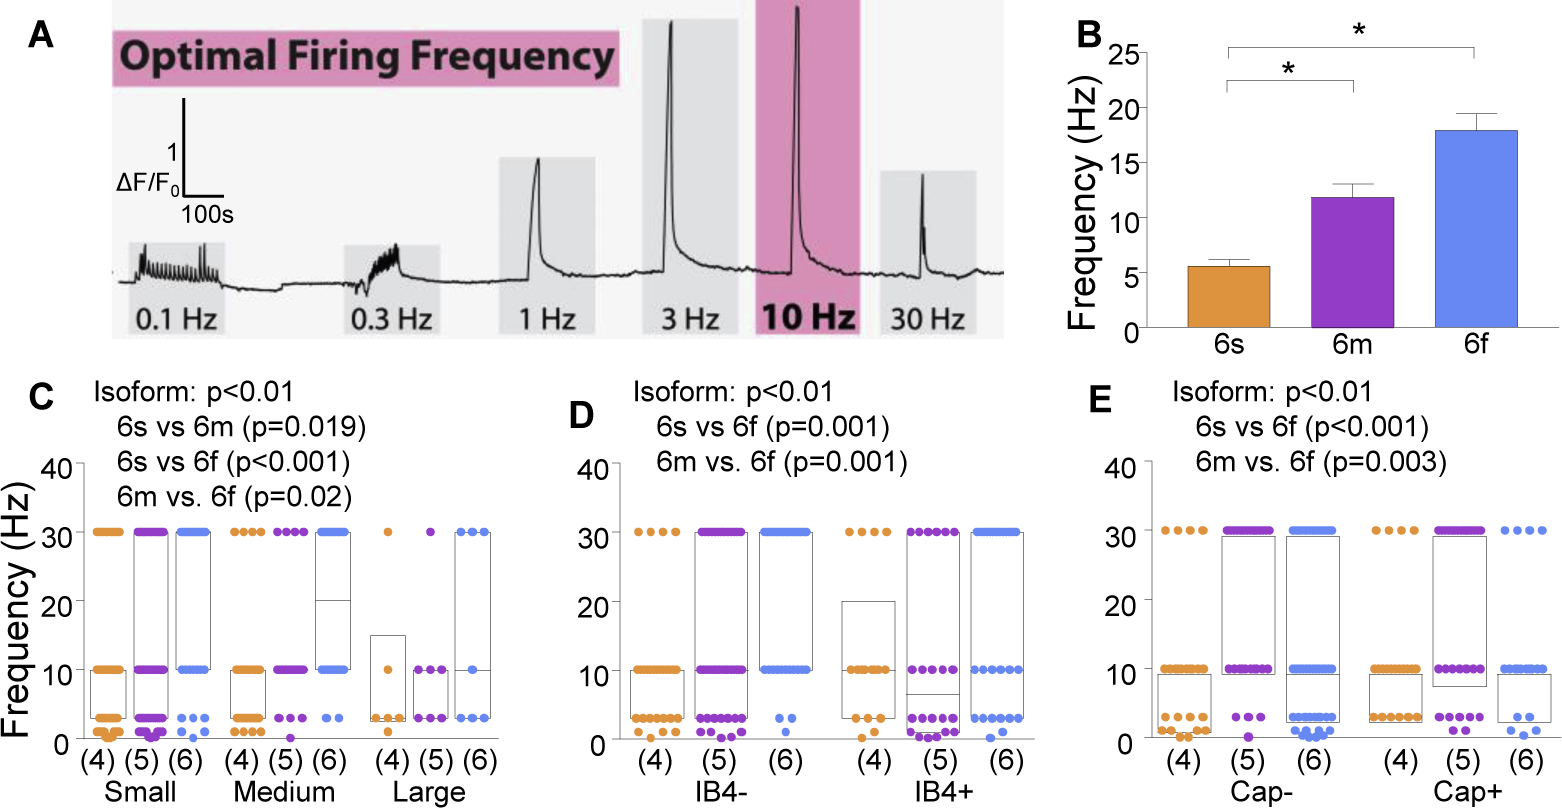
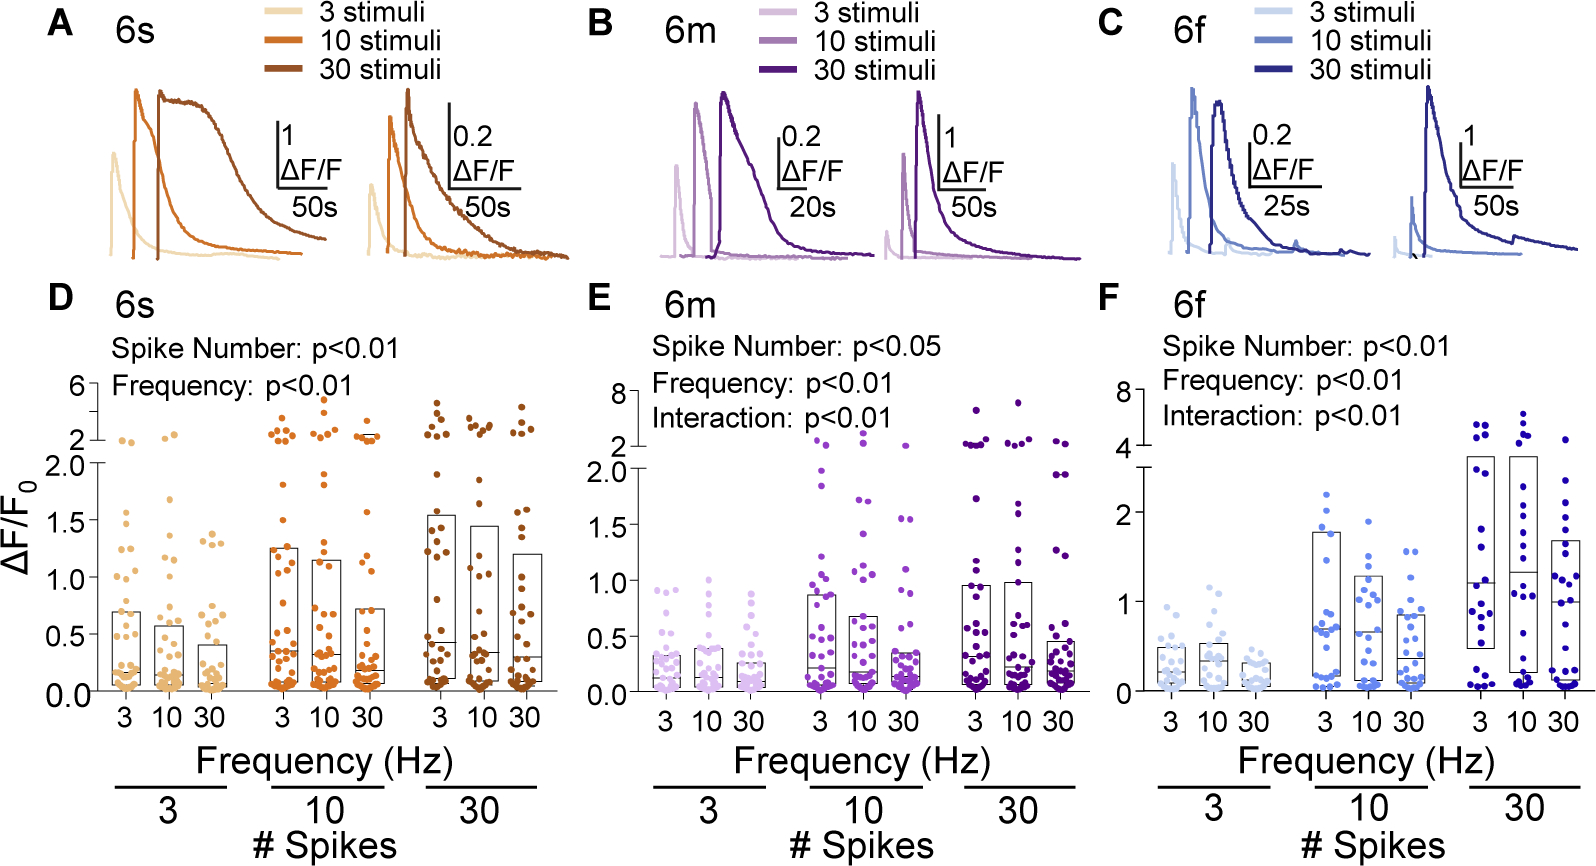
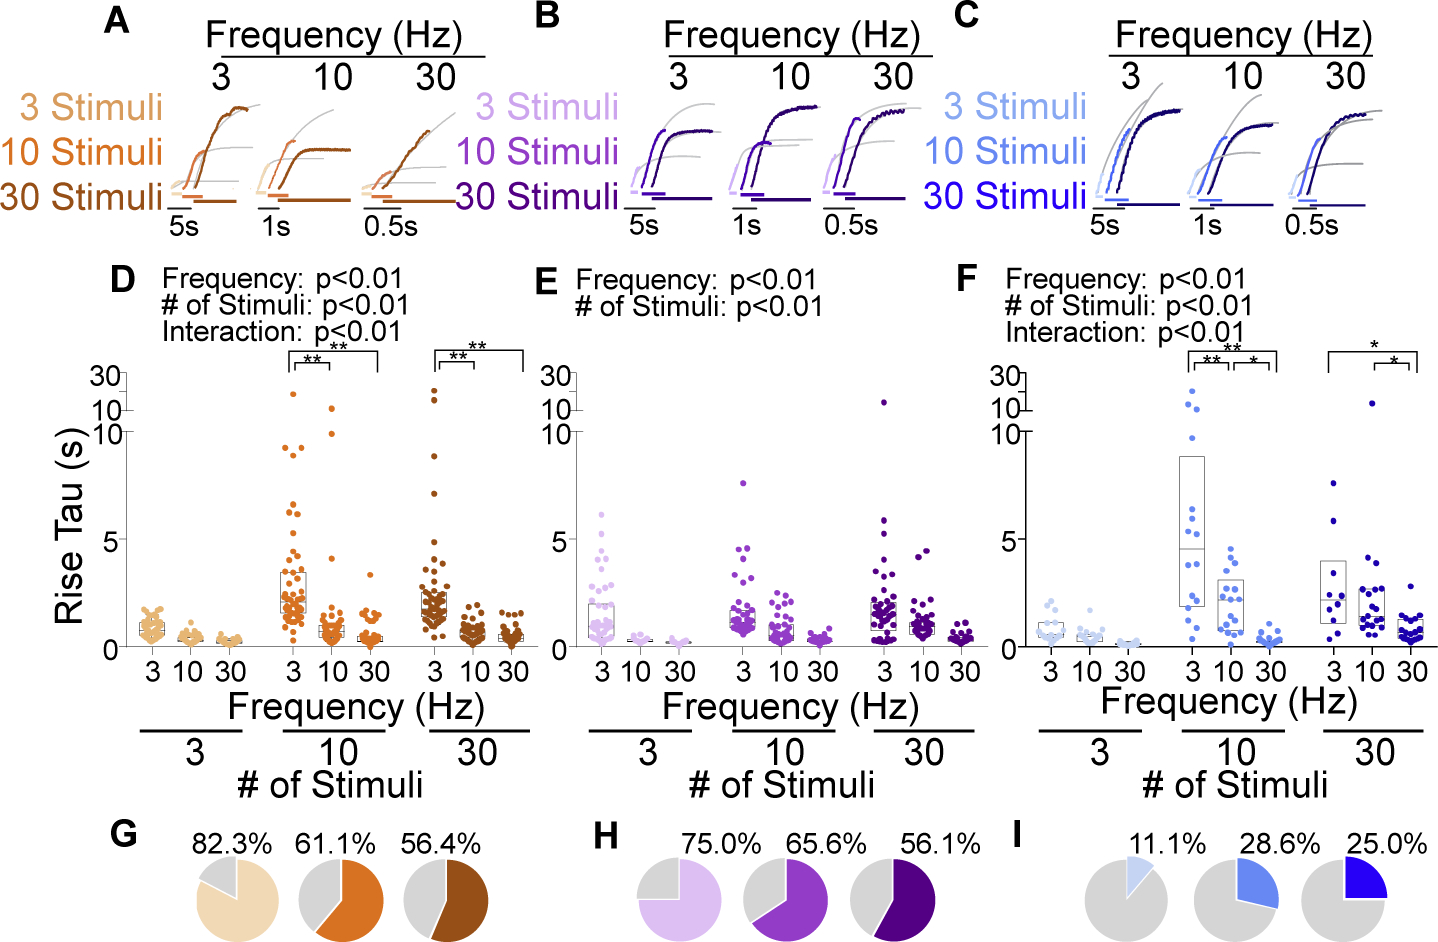
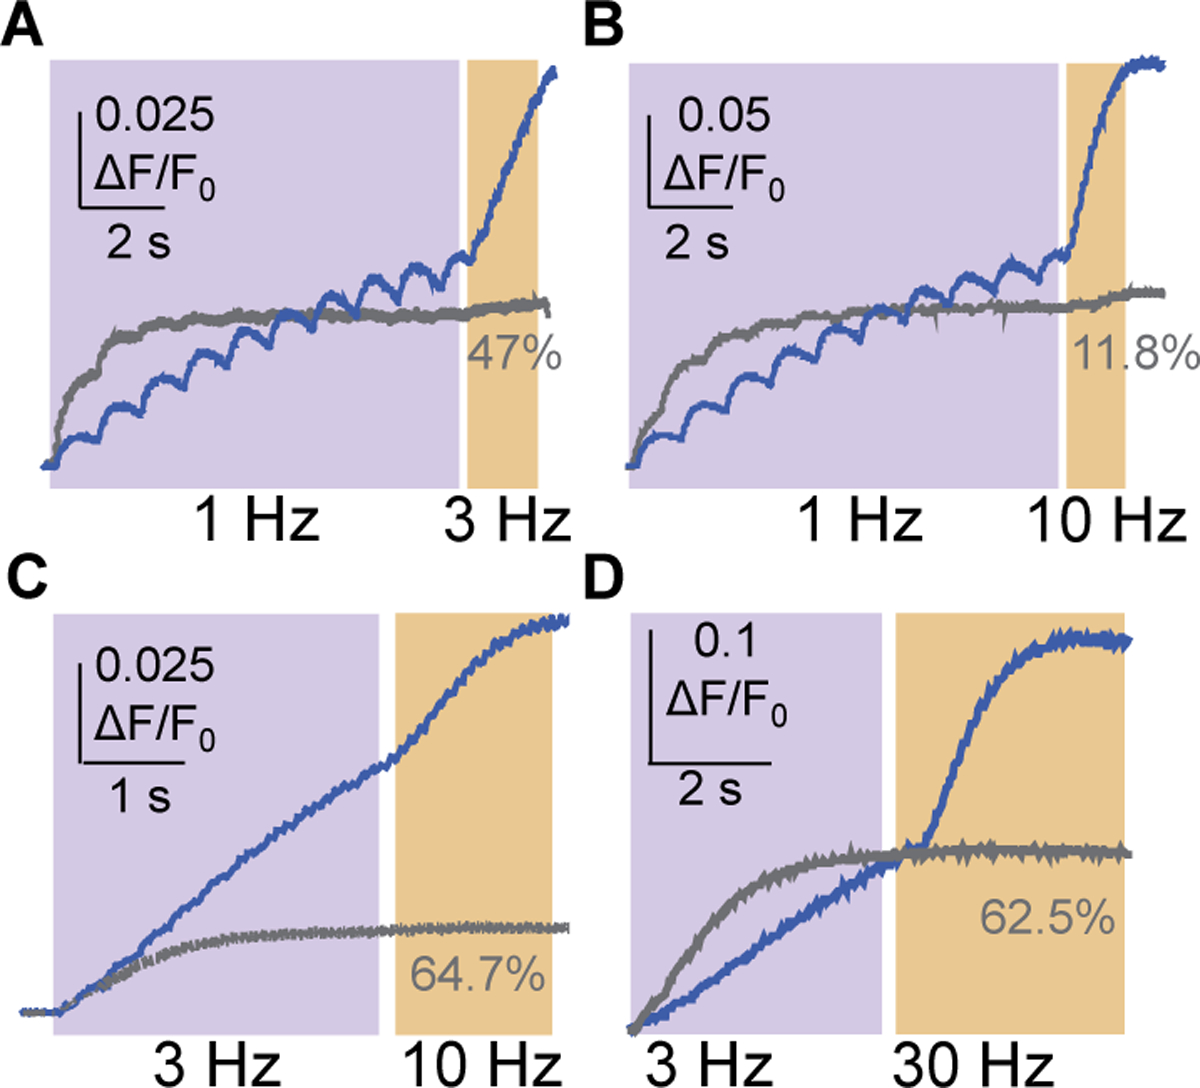
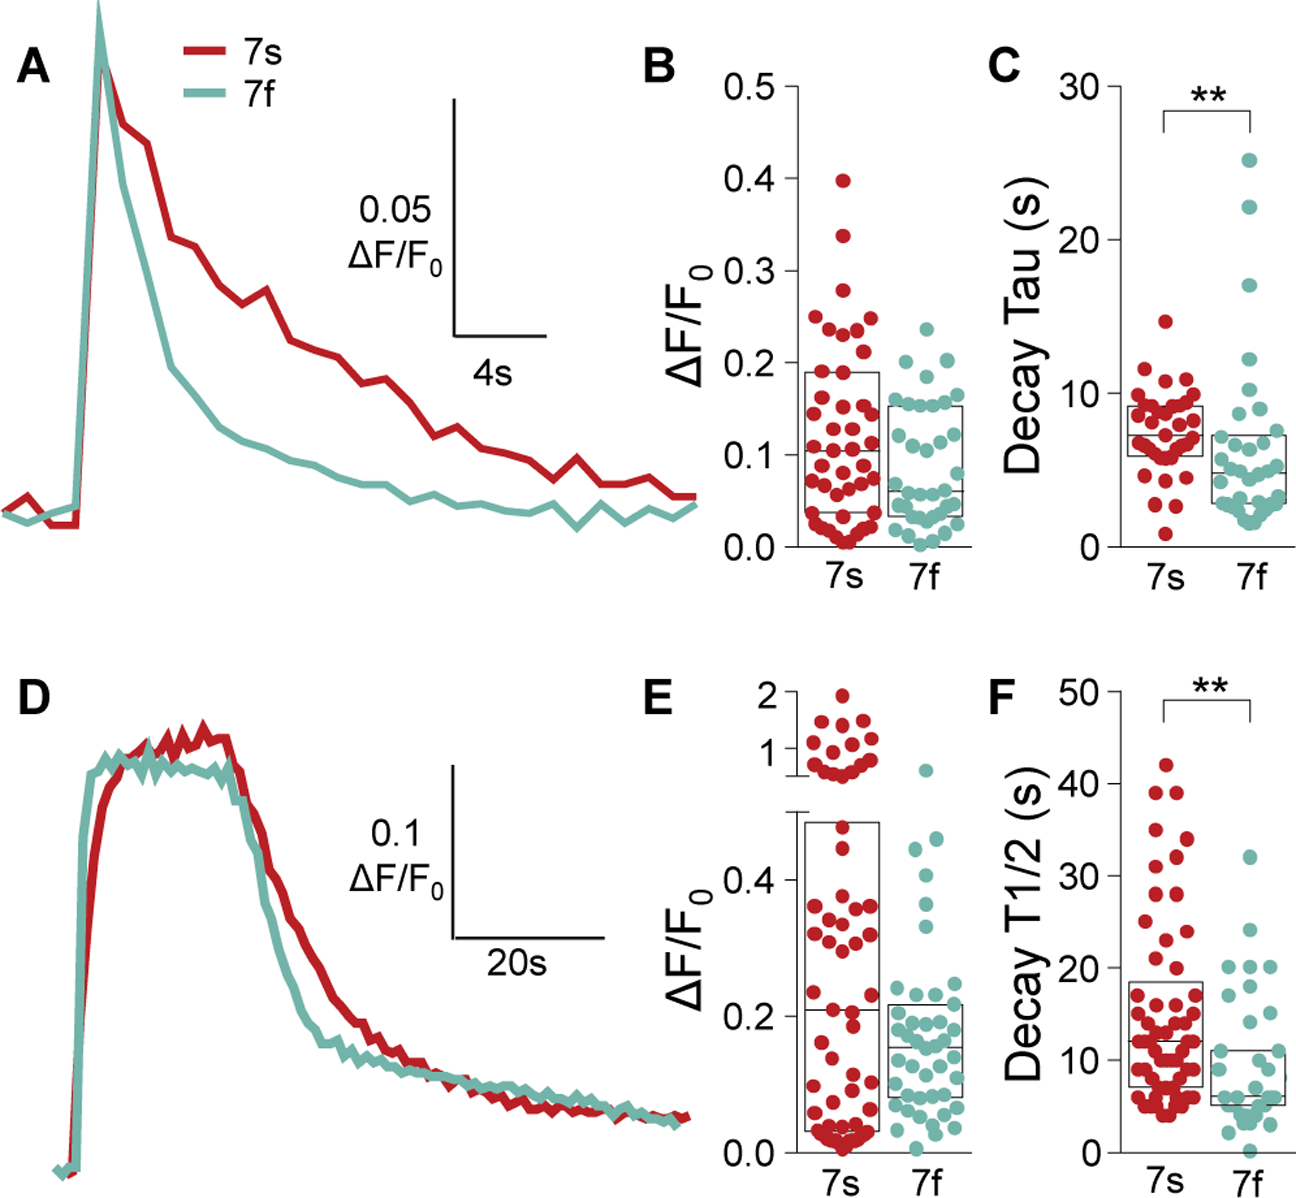
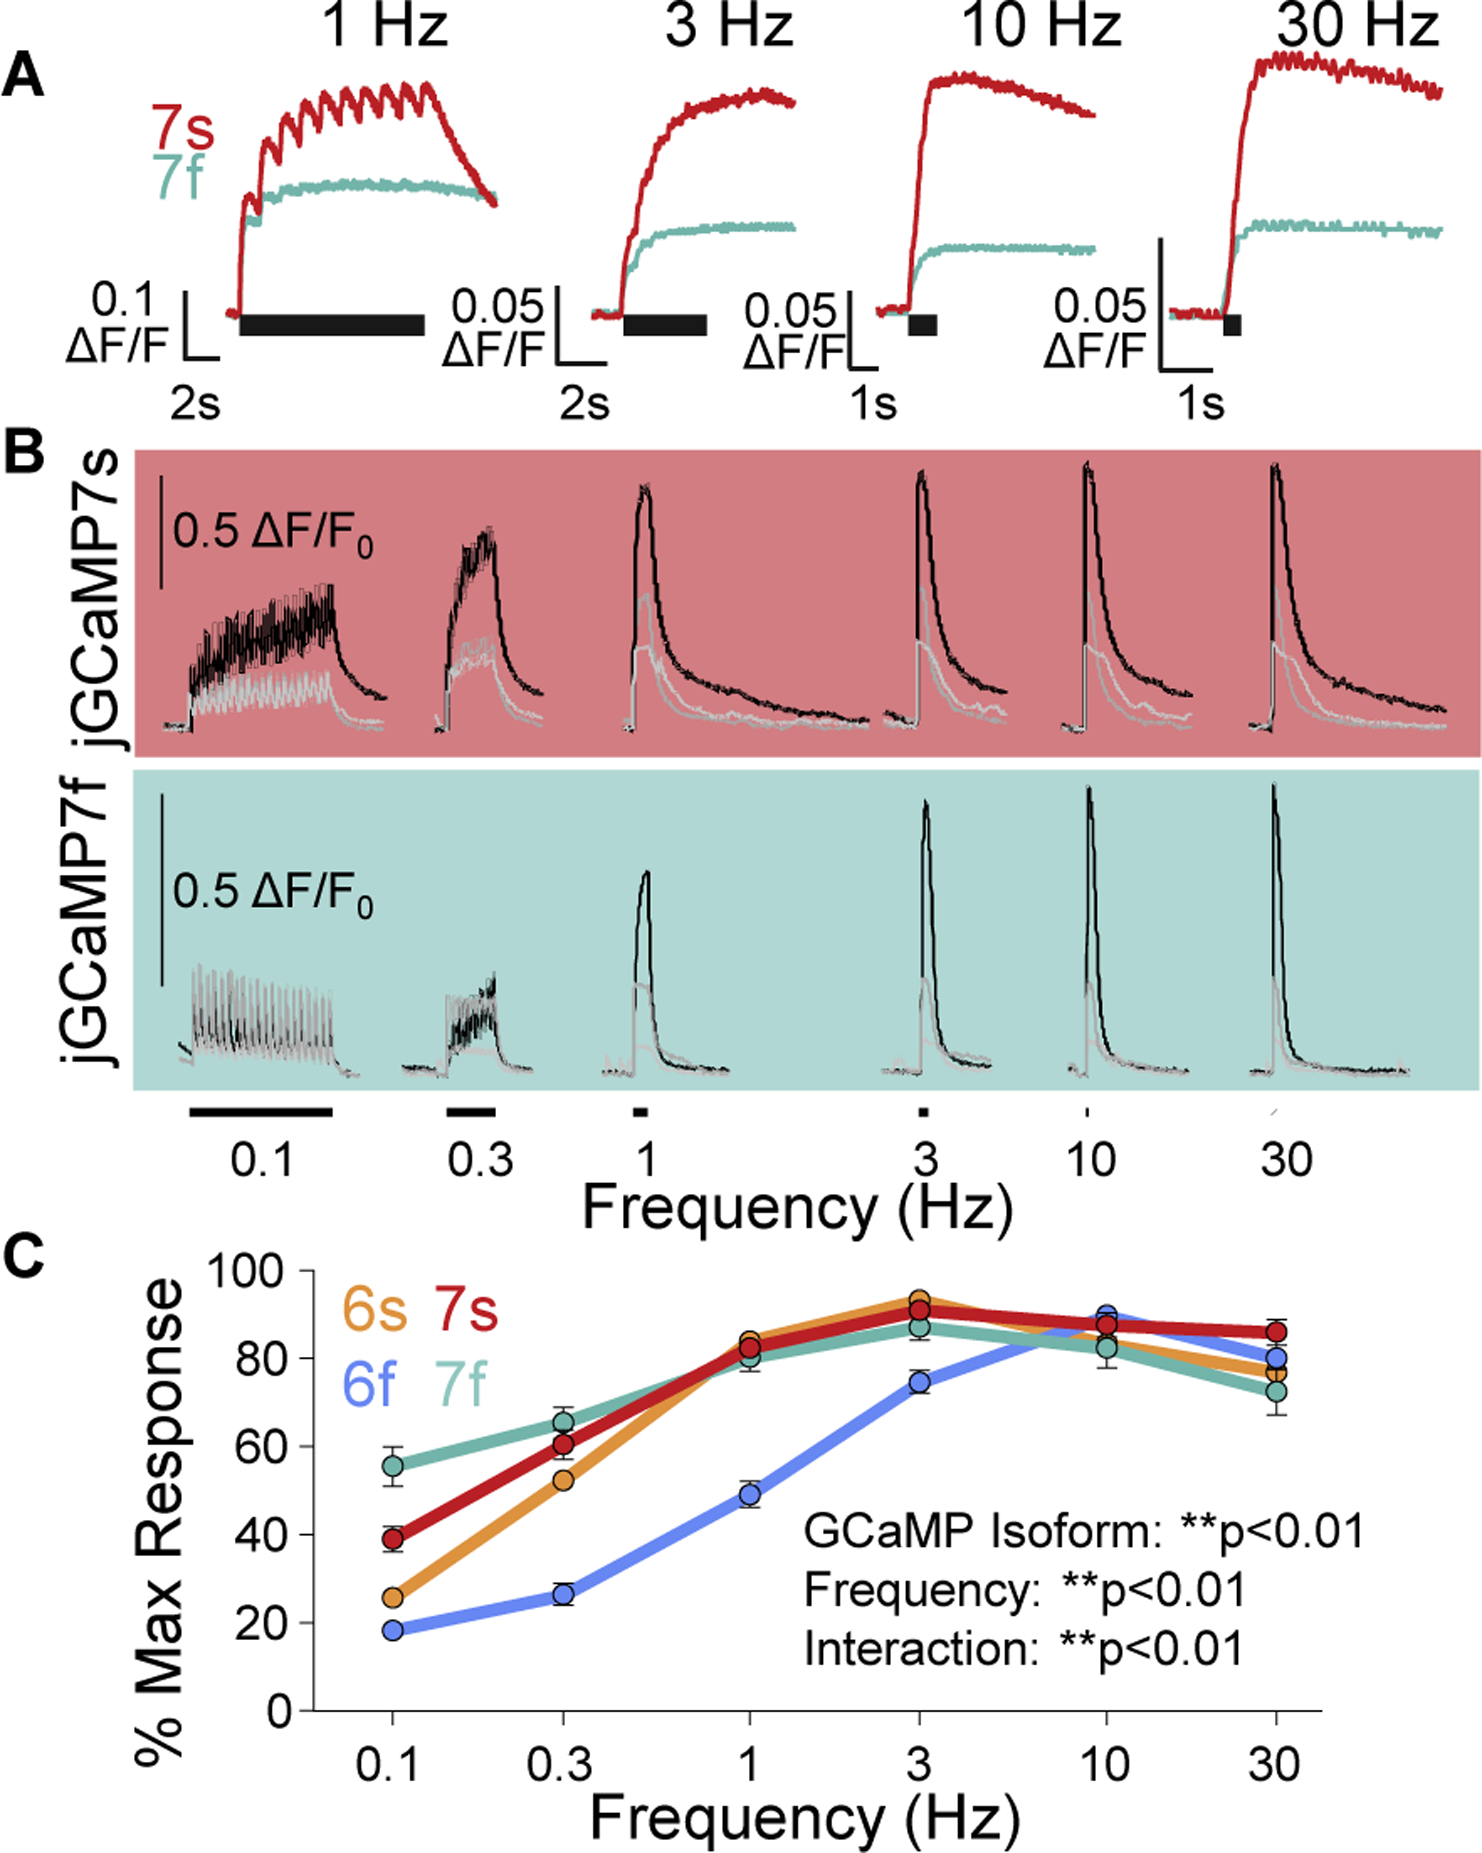
While debate continues over whether somatosensory information is transmitted via labeled line, population coding, frequency coding, or some combination therein, researchers have begun to address this question at the level of the primary afferent by using optical approaches that enable the assessment of neural activity in hundreds to even thousands of neurons simultaneously. However, with limited availability of tools to optically assess electrical activity in large populations of neurons, researchers have turned to genetically encoded Ca2+ indicators (GECIs) including GCaMP to enable the detection of increases in cytosolic Ca2+ concentrations as a correlate for neuronal activity. One of the most widely used GECIs is GCaMP6, which is available in three different versions tuned for sensitivity (GCaMP6s), speed (GCaMP6f), or a balance of the two (GCaMP6m). In order to determine if these issues were unique to GCaMP6 itself, or if they were inherent to more than one generation of GCaMP, we also characterized jGCaMP7. In the present study, we sought to determine the utility of the three GCaMP6 isoforms to detect changes in activity in primary afferents at frequencies ranging from 0.1-30 Hz. Given the heterogeneity of sensory neurons, we also compared the performance of each GCaMP6 isoform in subpopulations of neurons defined by properties used to identify putative nociceptive afferents: cell body size, isolectin B4 (IB4) binding, and capsaicin sensitivity. Finally, we compared results generated with GCaMP6 with that generated from neurons expressing the next generation of GCaMP, jGCaMP7s and jGCaMP7f. A viral approach, with AAV9-CAG-GCaMP6s/m/f, was used to drive GECI expression in acutely dissociated rat trigeminal ganglion (TG) neurons, and neural activity was driven by electrical field stimulation. Infection efficiency with the AAV serotype was high >95 %, and the impact of GCaMP6 expression in TG neurons over the period of study (<10 days) on the regulation of intracellular Ca2+, as assessed with fura-2, was minimal. Having confirmed that the field stimulation evoked Ca2+ transients were dependent on Ca2+ influx secondary to the activation of action potentials and voltage-gated Ca2+ channels, we also confirmed that the signal-to-noise ratio for each of the isoforms was excellent, enabling detection of a single spike in>90% of neurons. However, the utility of the GCaMP6 isoforms to enable an assessment of the firing frequency let alone changes in firing frequency of each neuron was relatively limited and isoform specific: GCaMP6s and 6m had the lowest resolution, enabling detection of spikes at 3 Hz in 15% and 32% of neurons respectively, but it was possible to resolve discrete single spikes up to 10 Hz in 36% of GCaMP6f neurons. Unfortunately, using other parameters of the Ca2+ transient, such as magnitude of the transient or the rate of rise, did not improve the range over which these indicators could be used to assess changes in spike number or firing frequency. Furthermore, in the presence of ongoing neural activity, it was even more difficult to detect a change in firing frequency. The frequency response relationship for the increase in Ca2+ was highly heterogeneous among sensory neurons and was influenced by both the GCaMP6 isoform used to assess it, the timing between the delivery of stimulation trains (inter-burst interval), and afferent subpopulation. Notably, the same deficiencies were observed with jGCaMP7s and 7f in resolving the degree of activity as were present for the GCaMP6 isoforms. Together, these data suggest that while both GCaMP6 and jGCaMP7 are potentially useful tools in sensory neurons to determine the presence or absence of neural activity, the ability to discriminate changes in firing frequency ≥ 3 Hz is extremely limited. As a result, GECIs should probably not be used in sensory neurons to assess changes in activity within or between subpopulations of neurons.

Keywords: Ca(2+)imaging; Intracellular calcium; Primary afferent; Sensory neurons; Somatosensory coding.


Conflict of interest statement

Declaration of Competing Interest The authors declare that there are no conflicts of interest.

Figures

Figure 1.
Figure 1.
Infection efficiency of AAV9-CAG-GCaMP6 (s/m/f)-WPRE-SV40. There was no significant effect of size (A), IB4 labeling (B), or capsaicin sensitivity (C) on AAV9 infection efficiency. Infection of efficiency was determined for each preparation of neurons as the proportion of neurons in which a stimulation-induced increase in GCaMP6 fluorescence was detected relative to the total number of neurons in which a stimulation-induced increase in fura-2 fluorescence was detected. Data are expressed as an average of the proportion per preparation of neurons (n = 3–6 preparations) where 14 to 26 neurons were assessed per preparation. Data from GCaMP6s, 6m, and 6f were pooled. Data are mean ± SEM, with data from each preparation overlaid.
Figure 2.
Figure 2.
Effect of AAV9 and GCaMP6 expression on Ca2+ regulation in cultured neurons. TG neurons from each of three rats were randomized to one of three treatment groups: uninfected (Uninf), infected with AAV9-GFP (GFP), or infected with AAV9-GCaMP6s (6s)/6f (6f). Neurons were cultured for 7–10 days. Typical fura-2 responses of neurons from each of the three groups processed in parallel with GCaMP6s (A, top panel) or GCaMP6f (A, bottom panel) to 20 pulses delivered at 1 Hz. Prior to testing, neurons were loaded with fura-2 to measure resting Ca2+ concentration or the fluorescence ratio (340/380) prior to stimulation (B), the maximal increase in Ca2+ in response to a train of 20 electrical pulses (ΔF/F0) (C), and the time for the evoked transient to decay to 50% of the maximal increase (T1/2) (D). While there were no significant differences in resting fluorescence, there were small but significant effects of AAV9-GFP on the maximal response, and of GCaMP6s on the decay of the evoked transient. Data are median ± 25th and 75th quartile, with data from individual neurons overlaid. *p<0.05.
Figure 3.
Figure 3.
Source of Ca2+ underlying field stimulation evoked increase in GCaMP6 fluorescence. Neurons were stimulated with 20 pulses delivered at 1Hz before and after replacing normal bath solution (Normal Bath) with either a Ca2+-free bath solution, normal bath solution to which 100 μM Cd2+ had been added, or a Na+ free bath solution in which NaCl in the normal bath was replaced with choline-Cl. Neurons were stimulated with the same protocol a third time following restoration of normal bath. A. Left panel: Typical response from a neuron expressing GCaMP6s before and after application of Ca2+ free bath solution. Pooled data from neurons expressing GCaMP6s (middle panel, n = 10) and GCaMP6f (right panel, n = 14) were comparable. B. Left panel: Typical response of a neuron expressing GCaMP6s before and after replacing the normal bath solution with a normal bath solution to which 100 μM Cd2+ had been added. Pooled data from neurons expressing GCaMP6s (middle panel, n = 11) and GCaMP6f (right panel, n = 8) were also comparable. C. Left panel: Typical response from a neuron expressing GCaMP6s before and after replacing the normal bath solution with Na+ free bath solution. Pooled data from neurons expressing GCaMP6s (middle panel, n=11) and GCaMP6f (right panel, n=48) were also comparable. Points on each plot are data from individual neurons.
Figure 4.
Figure 4.
Single action potentials are reliably detected in TG neurons with all three GCaMP6 isoforms. A. Single action potentials evoked in neurons expressing GCaMP6s (6s), m (6m), and f (6f). B. (Top) Rising phase of the fluorescence signal evoked with a single action potential fitted with a single exponential, used to determine the time constant (Rise Tau) or the rising phase of the evoked transient. (Bottom) Falling phase of the fluorescence signal evoked with a single action potential fitted with a single exponential, used to determine the time constant (Decay Tau) or the falling phase of the evoked transient. C. There were no differences between GCaMP6 isoforms with respect to the maximum increase in fluorescence associated with a single action potential. D. The rise tau or increase in fluorescence associated with a single action potential was significantly faster in neurons expressing GCaMP6f, than either GCaMP6s or 6m. E. The decay tau associated with a single action potential was significantly faster in neurons expressing GCaMP6f, than either GCaMP6s or 6m. A neuron was considered a responder to a single pulse of field stimulation, if the associated increase in fluorescence was > 2 SDs above baseline. There were no differences between subpopulations of neurons defined by cell body diameter (E), IB4 binding (F), or capsaicin sensitivity (G) with respect to the percentage of neurons in which it was possible to detect a single spike (% Responders). Data in C, D and E are expressed as median ± 25th and 75th quartile with data from individual neurons overlaid. Data in F, G and H are mean ± SEM of n=3–6 preparations/GCaMP6 isoform, with data from each preparation overlaid. **p < 0.01.
Figure 5:
Figure 5:
Differences between GCaMP6 isoforms with respect to maximal increase and decay of evoked Ca2+ transients. A burst of 20 pulses at 1 Hz was used to drive the maximal increase in GCaMP6 fluorescence (ΔF/F0). A. Typical examples of transients evoked with a burst of 20 pulses in neurons expressing GCaMP6s (6s), m (6m) and f (6f). B. (Top) Rising phase of the fluorescent signal evoked with a train of 20 pulses fitted with a single exponential, used to determine the time constant (Rise Tau) or the rising phase of the evoked transient. (Bottom) Falling phase of the fluorescent signal evoked with a a train of 20 pulses to determine the decay of the transients to 50% of the maximum increase (T½), scaled so that the maximum value for fluorescence is 100%. C. The maximal increase in fluorescence (ΔF/F0), was largest in neurons expressing GCaMP6s, and smallest in neurons expressing GCaMP6f. D. The decay of the evoked transients was slowest in neurons expressing GCaMP6s and fastest in neurons expressing GCaMP6f. Data are expressed as median ± 25th and 75th quartile with data from individual neurons overlaid. *p < 0.05 and **p < 0.01
Figure 6.
Figure 6.
Functional dynamic range is dependent on GCaMP6 isoform and neuronal subpopulations. A. The functional dynamic range (Dynamic Range) was defined as the ratio of the maximal evoked increase in fluorescence (ΔFmax) relative to the increase in fluorescence evoked with a single spike (ΔFspike). B. The Dynamic Range in neurons expressing GCaMP6f (6f) or GCaMP6s (6s) was larger than that in neurons expressing GCaMP6m (6m). There were no differences in the Dynamic Range in subpopulations of TG neurons defined by cell body diameter (C) or IB4 binding (D), but there were differences based on capsaicin sensitivity (E). Number of preparations for each subpopulation and isoform are indicated in parentheses in C-E. Data are mean + SEM (B) or median ± 25th and 75th quartile with data from individual neurons overlaid (C-E) and are analyzed with Kruskall-Wallis non-parametric test (B) or two-way non-parametric rank test (GCaMP6 isoform x subpopulation) and Holm-Sidak parametric post-hoc test, with significant main effects and/or interactions as indicated (C-E). *p<0.05, **p<0.01.
Figure 7.
Figure 7.
TG neurons are capable of following up to 30 Hz stimulation but spike evoked GCaMP6 transients are not resolved above 3 Hz. A. Whole cell patch recording was used to assess maximal following frequency in TG neurons. Example voltage-traces of a neuron stimulated with 20 pulses at 1, 3, 10 and 30 Hz. The last spike in the train is enlarged to illustrate the action potential overshoot. B. Pooled data from 15 neurons indicate that the majority are able to follow up to 30 Hz stimulation. C. Examples of the transients evoked in neurons expressing GCaMP6s (6s), m (6m) and f (6f), stimulated at frequencies ranging from 0.1 to 30 Hz as indicated. D. The percentage of neurons expressing each isoform within a prep in which it was possible to discrete spikes that corresponded to the stimulus. Data were sampled at 1 Hz for stimulations at 0.1 and 0.3 Hz and at 34 Hz for stimulation frequencies ≥ 1 Hz. Data in D are plotted as mean ± SEM with data from individual preparations overlaid.
Figure 8.
Figure 8.
The magnitude (ΔF/F) of the evoked transient does not reliably reflect frequency above 3 Hz regardless of isoform and inter-burst interval. A. Examples of increases in fluorescence of TG neurons in a field of view (at 20x) expressing GCaMP6s in response to 20 pulses of electrical field stimulation at frequencies between 0.1 and 30 Hz. Stimuli were applied at increasing frequencies with an inter-burst interval (IBI) of 2, 5, and 10 min as indicated. Different groups of neurons are shown for each IBI. B. Pooled stimulus response data for TG neurons expressing GCaMP6s stimulated with an IBI of 2 (n = 96), 5 (n = 135), and 10 (n = 112) min. The response of each neuron was normalized to the maximal response evoked at any frequency of stimulation. C. Data were collected and plotted as in A for TG neurons expressing GCaMP6m. D. Pooled GCaMP6m data were analyzed and plotted as in B. Data were collected from 49, 33, and 51 neurons at an IBI of 2, 5, and 10 min, respectively. E. Data were collected and plotted as in A for TG neurons expressing GCaMP6f. F. Pooled GCaMP6f data were analyzed and plotted as in B. Data were collected from 30, 88, and 86 neurons at an IBI of 2, 5, and 10 min, respectively. Pooled data are mean + SEM, with curves for individual neurons overlaid. Number of preparations for each GCaMP6 isoform and IBI are indicated in parentheses under curves in B, D, and F.
Figure 9.
Figure 9.
Optimal firing frequency varies as a function of GCaMP6 isoform but not neuronal subpopulation. A. Typical example of the response of a TG neuron expressing GCaMP6f to 20 pulses of electrical field stimulation applied at frequencies between 0.1 and 30 Hz. In this neuron, the largest increase in fluorescence was evoked with stimuli applied at 10 Hz, considered the optimal firing frequency. B. Pooled data for all TG neurons expressing GCaMP6s (n = 93), 6m (n = 100) and 6f (n = 201), were analyzed with a one-way ANOVA on ranks with Sidak test used for post-hoc comparisons. The significant impact of isoform persisted when data were analyzed with a two-way ANOVA on ranks with subpopulations defined by cell body diameter (C), IB4 binding (D), and capsaicin sensitivity (E). However, there was a significant interaction between GCaMP6 isoform and cell body diameter, where in small diameter TG neurons, the optimal firing frequency was faster in neurons expressing GCaMP6f than with either 6m or 6s. Number of preparations for each subpopulation and isoform are indicated in parentheses in C-E. Data are mean + SEM (B) or median ± 25th and 75th quartile with data from individual neurons overlaid (C-E) and are analyzed with two-way non-parametric rank test and Holm-Sidak parametric post-hoc test, with significant main effects as indicated. *p<0.05, **p<0.01.
Figure 10.
Figure 10.
The impact of stimulus number and frequency on the magnitude of the evoked GCaMP6 transient in TG neurons. TG neurons received 3, 10, or 30 stimuli delivered at frequencies of 3, 10 or 30 Hz. Typical examples of fluorescent transients evoked in neurons expressing GCaMP6s (A), 6m (B) and 6f (C) with 3, 10 and 30 stimuli at 10 Hz. Traces on left were from neurons in which the peak of the transient evoked with 10 stimuli was as large if not larger than the transient evoked with 30 stimuli. The traces on the right are from neurons in which there was a clear increase in the magnitude of the evoked transient associated with the increase in stimulus number. This association was observed in 2.7%, 34%, and 59% of neurons expressing GCaMP6s, 6m, and 6f, respectively, regardless of the stimulation frequency. Pooled magnitude data for neurons expressing GCaMP6s (D), 6m (E), or 6f (F), in which data are plotted by spike number and frequency. Data are expressed as median ± 25th and 75th quartile (A-C) and were analyzed with two-way non-parametric rank test with Holm-Sidak parametric post-hoc test, with significant main effects and/or interactions as indicated.
Figure 11.
Figure 11.
The impact of stimulus number and frequency on the time constant, Tau, for the rate of GCaMP6 fluorescent increase in TG neurons. A. The rising phase of the stimulation-induced increase in GCaMP6 fluorescence was fitted with a single exponential to determine the time constant associated with the process. Examples of transients evoked with bursts of 3, 10, or 30 stimuli applied at 3, 10 or 30 Hz from TG neurons expressing GCaMP6s (A), 6m (B) or 6f (C) are shown, along with the predicted rise of the transient. Pooled time constant data for neurons expressing GCaMP6s (D), 6m (E), and 6f (F), are plotted by spike number and stimulation frequency. Data are plotted as median ± 25th and 75th quartile and were analyzed with a two-way rank sum test (spike number x frequency). Significant main effects and/or interactions are indicated. The only post-hoc test results shown are within a stimulation frequency, but there were significant differences between frequencies as well. Pie-plots are the proportion of TG neurons expressing GCaMP6s (G), 6m (H), or 6f (I) in which there was a consistent decrease in evoked transient time constant associated with an increase in stimulation frequency. *p<0.05, **p<0.01.
Figure 12.
Figure 12.
The impact of ongoing stimulation on the detection of increases in frequency with changes in GCaMP6 fluorescence. TG neurons expressing GCaMP6m were stimulated for 10 spikes at 1 (A (n = 17) and B (n = 17)), 3 (C, n = 17), and 10 (D, n = 9) Hz immediately followed by an increase in stimulation frequency to 3, 10 or 30 Hz as indicated. Examples of fluorescence traces in which it was possible to detect the increase in stimulation frequency with an increase in the slope of the evoked transient are shown in blue. Examples of fluorescence traces in which it was not possible to detect the change in stimulation frequency are shown in gray. The percentage of neurons in which it was not possible to detect an increase in slope is indicated: While the change in slope was detectable in the majority of cells when stimulation increased from 1 Hz to 3 Hz (9 of 17 cells) or 1 to 10 Hz (15 of 17 cells), it was possible to detect a change in slope in less than half the cells from 3 to 10 Hz (6 of 17 cells) or from 3 to 30 Hz (3 of 8 cells).
Figure 13.
Figure 13.
Differences between jGCaMP7 isoforms with respect to magnitude (ΔF/F0) and decay of evoked Ca2+ transients in response to a single or burst of pulses. A single pulse or a burst of 20 pulses at 1 Hz was used to drive a jGCaMP7 transient A. Typical examples of transients evoked with a single pulse in neurons expressing jGCaMP7s (6s) or jGCaMP7f (7f). B. The maximal increase in fluorescence (ΔF/F0) associated with a single spike was no different in neurons expressing jGCaMP7s, than in those expressing jGCaMP7f. C. The decay of the transient associated with a single spike was slower in neurons expressing jGCaMP7s than in neurons expressing jGCaMP7f. D. Typical examples of transients evoked with a burst of 20 pulses at 1 Hz. E. The maximal increase in fluorescence was no different in jGCaMP7s neurons than in jGCaMP7f neurons in response to a burst of pulses. F. The decay of the evoked transient was slower in neurons expressing jGCaMP7s than in neurons expressing jGCaMP7f. Data are expressed as median ± 25th and 75th quartile with data from individual neurons overlaid. Data were analyzed using a Mann-Whitney test. **p < 0.01.
Figure 14.
Figure 14.
jGCaMP7 transients do not reliably reflect activity above 3 Hz. A. Examples of the transients evoked in neurons expressing GCaMP6s (6s), m (6m) and f (6f), stimulated at frequencies ranging from 0.1 to 30 Hz as indicated, where the black bars indicate the length of the stimulus. B. Examples of increases in fluorescence of TG neurons in a field of view (at 20x) expressing jGCaMP7s and jGCaMP7f in response to 20 pulses of electrical field stimulation at frequencies between 0.1 and 30 Hz. Stimuli were applied at increasing frequencies with an inter-burst interval (IBI) of 10 min. C. Pooled stimulus response data for TG neurons expressing jGCaMP7s (n=62 cells) and jGCaMP7f (n = 43 cells). The response of each neuron was normalized to the maximal response evoked at any frequency of stimulation. Data are expressed as mean ± SEM. Data were analyzed with two-way non-parametric rank test with significant main effects and/or interactions as indicated.

Similar articles

Cited by

References

    1. Emery EC, Luiz AP, Sikandar S, Magnusdottir R, Dong X, Wood JN, In vivo characterization of distinct modality-specific subsets of somatosensory neurons using GCaMP, Science advances, 2 (2016) e1600990. - PMC - PubMed
    1. Chisholm KI, Khovanov N, Lopes DM, La Russa F, McMahon SB, Large Scale In Vivo Recording of Sensory Neuron Activity with GCaMP6, eNeuro, 5 (2018) ENEURO.0417–0417.2018. - PMC - PubMed
    1. Smith-Edwards KM, Najjar SA, Edwards BS, Howard MJ, Albers KM, Davis BM, Extrinsic Primary Afferent Neurons Link Visceral Pain to Colon Motility Through a Spinal Reflex in Mice, Gastroenterology, 157 (2019) 522–536 e522. - PMC - PubMed
    1. Smith-Edwards KM, DeBerry JJ, Saloman JL, Davis BM, Woodbury CJ, Profound alteration in cutaneous primary afferent activity produced by inflammatory mediators, Elife, 5 (2016) e20527. - PMC - PubMed
    1. Miller RE, Kim YS, Tran PB, Ishihara S, Dong X, Miller RJ, Malfait AM, Visualization of Peripheral Neuron Sensitization in a Surgical Mouse Model of Osteoarthritis by In Vivo Calcium Imaging, Arthritis & rheumatology (Hoboken, N.J.), 70 (2018) 88–97. - PMC - PubMed

Publication types