

The sunless tanning agent dihydroxyacetone induces stress response gene expression and signaling in cultured human keratinocytes and reconstructed epidermis
- PMID: 32506039
- PMCID: PMC7276426
- DOI: 10.1016/j.redox.2020.101594
The sunless tanning agent dihydroxyacetone induces stress response gene expression and signaling in cultured human keratinocytes and reconstructed epidermis
Abstract
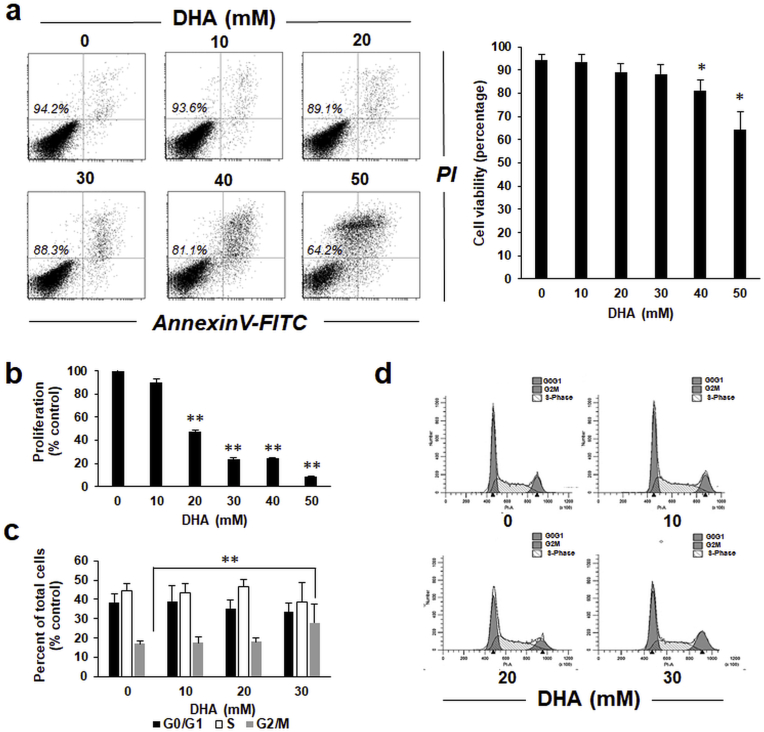
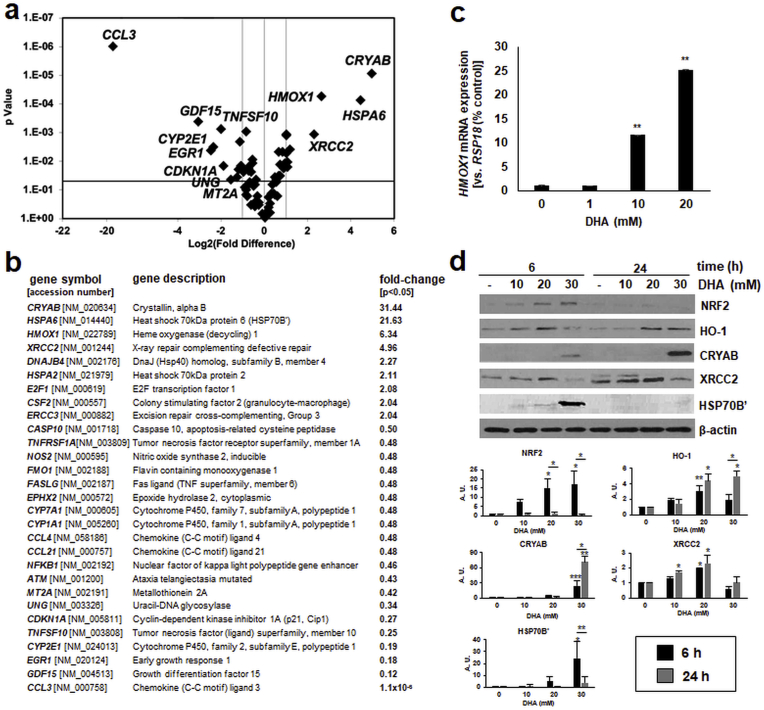
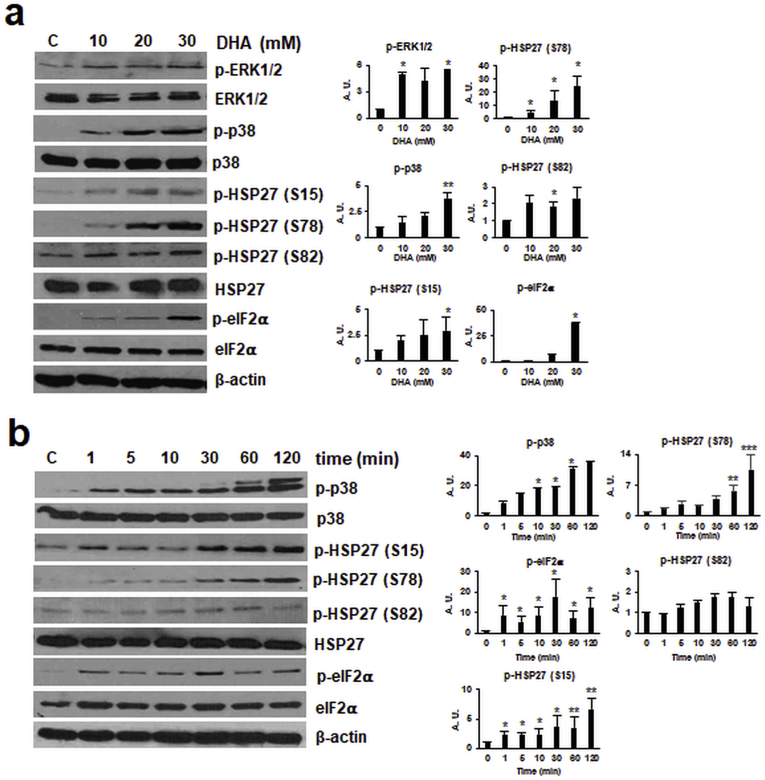
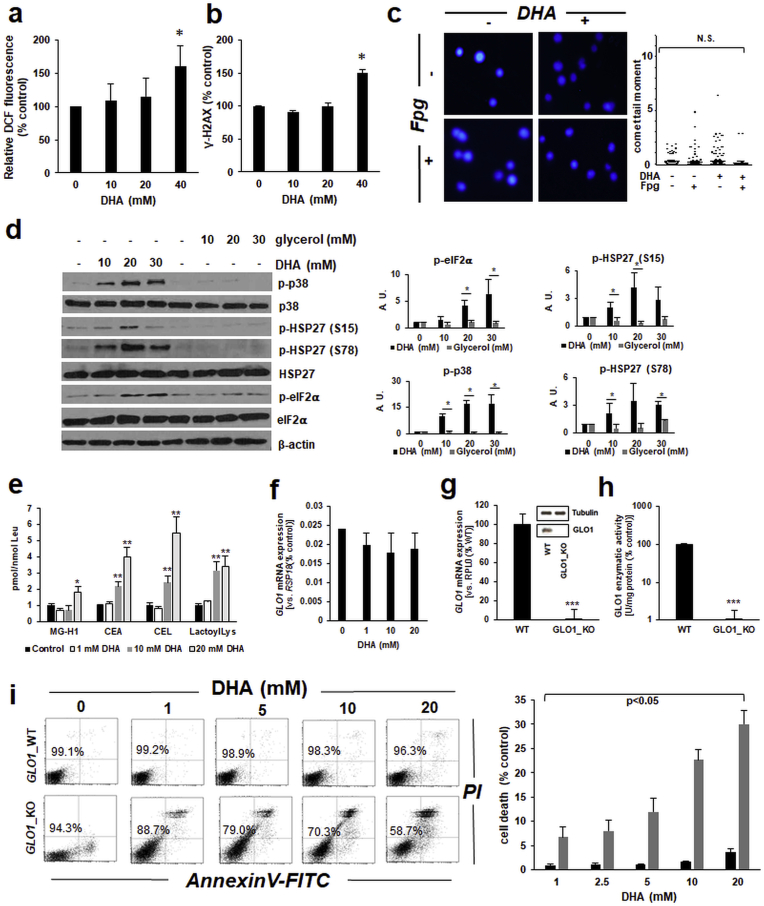
Sunless (chemical) tanning is widely regarded as a safe alternative to solar UV-induced skin tanning known to be associated with epidermal genotoxic stress, but the cutaneous biology impacted by chemical tanning remains largely unexplored. Chemical tanning is based on the formation of melanin-mimetic cutaneous pigments ('melanoidins') from spontaneous amino-carbonyl ('glycation') reactions between epidermal amino acid/protein components and reactive sugars including the glycolytic ketose dihydroxyacetone (DHA). Here, we have examined the cutaneous effects of acute DHA-exposure on cultured human HaCaT keratinocytes and epidermal reconstructs, profiled by gene expression array analysis and immunodetection. In keratinocytes, DHA-exposure performed at low millimolar concentrations did not impair viability while causing a pronounced cellular stress response as obvious from rapid activation of phospho-protein signal transduction [p-p38, p-Hsp27(S15/S78), p-eIF2α] and gene expression changes (HSPA6, HMOX1, CRYAB, CCL3), not observable upon exposure to the non-ketose, tanning-inactive DHA-control glycerol. Formation of advanced glycation end products (AGEs) from posttranslational protein-adduction was confirmed by quantitative mass spectrometric detection of N-ε-(carboxyethyl)-l-lysine (CEL) and N7-carboxyethyl-l-arginine, and skin cells with CRISPR-Cas9-based elimination of the carbonyl stress response gene GLO1 (encoding glyoxalase 1) displayed hypersensitivity to DHA-cytotoxicity. In human epidermal reconstructs a topical use-relevant DHA-dose regimen elicited a comparable stress response as revealed by gene expression array (HSPA1A, HSPA6, HSPD1, IL6, DDIT3, EGR1) and immunohistochemical analysis (CEL, HO-1, p-Hsp27-S78). In DHA-treated SKH-1 hairless mouse skin IHC-detection revealed epidermal occurrence of CEL- and p-Hsp27-epitopes. For comparison, stress response gene expression array analysis was performed in epidermis exposed to a supra-erythemal dose of solar simulated UV (2 MEDs), identifying genes equally or differentially sensitive to either one of these cutaneous stimuli [DHA ('sunless tanning') versus solar UV ('sun-induced tanning')]. Given the worldwide use of chemical tanners in consumer products, these prototype data documenting a DHA-induced specific cutaneous stress response deserve further molecular exploration in living human skin.
Keywords: Dihydroxyacetone; Glycation; Phosphoprotein signaling; Reconstructed human epidermis; Stress response gene expression; Sunless tanning.
Copyright © 2020 The Authors. Published by Elsevier B.V. All rights reserved.
Conflict of interest statement
The authors state no conflict of interest.
Figures

Similar articles
-
Cytotoxic, genotoxic, and toxicogenomic effects of dihydroxyacetone in human primary keratinocytes.Cutan Ocul Toxicol. 2021 Sep;40(3):232-240. doi: 10.1080/15569527.2021.1931877. Epub 2021 Jun 11. Cutan Ocul Toxicol. 2021. PMID: 34008457
-
In search of the perfect tan: Chemical activity, biological effects, business considerations, and consumer implications of dihydroxyacetone sunless tanning products.J Cosmet Dermatol. 2023 Jan;22(1):79-88. doi: 10.1111/jocd.14968. Epub 2022 Apr 21. J Cosmet Dermatol. 2023. PMID: 35384270 Free PMC article. Review.
-
Properties and safety of topical dihydroxyacetone in sunless tanning products: A review.Photodermatol Photoimmunol Photomed. 2023 Nov;39(6):567-572. doi: 10.1111/phpp.12913. Epub 2023 Sep 12. Photodermatol Photoimmunol Photomed. 2023. PMID: 37697919 Review.
-
Dihydroxyacetone, the active browning ingredient in sunless tanning lotions, induces DNA damage, cell-cycle block and apoptosis in cultured HaCaT keratinocytes.Mutat Res. 2004 Jun 13;560(2):173-86. doi: 10.1016/j.mrgentox.2004.03.002. Mutat Res. 2004. PMID: 15157655
-
Dihydroxyacetone Exposure Alters NAD(P)H and Induces Mitochondrial Stress and Autophagy in HEK293T Cells.Chem Res Toxicol. 2019 Aug 19;32(8):1722-1731. doi: 10.1021/acs.chemrestox.9b00230. Epub 2019 Aug 2. Chem Res Toxicol. 2019. PMID: 31328504 Free PMC article.
Cited by
-
Topical hypochlorous acid (HOCl) blocks inflammatory gene expression and tumorigenic progression in UV-exposed SKH-1 high risk mouse skin.Redox Biol. 2021 Sep;45:102042. doi: 10.1016/j.redox.2021.102042. Epub 2021 Jun 11. Redox Biol. 2021. PMID: 34144392 Free PMC article.
-
Dihydroxyacetone suppresses mTOR nutrient signaling and induces mitochondrial stress in liver cells.PLoS One. 2022 Dec 6;17(12):e0278516. doi: 10.1371/journal.pone.0278516. eCollection 2022. PLoS One. 2022. PMID: 36472985 Free PMC article.
-
Efficient 1,3-dihydroxyacetone biosynthesis in Gluconobacter oxydans using metabolic engineering and a fed-batch strategy.Bioresour Bioprocess. 2022 Nov 26;9(1):121. doi: 10.1186/s40643-022-00610-7. Bioresour Bioprocess. 2022. PMID: 38647819 Free PMC article.
-
Role of advanced glycation end products on vascular smooth muscle cells under diabetic atherosclerosis.Front Endocrinol (Lausanne). 2022 Aug 31;13:983723. doi: 10.3389/fendo.2022.983723. eCollection 2022. Front Endocrinol (Lausanne). 2022. PMID: 36120471 Free PMC article. Review.
-
Phytochemical Characterization, Antioxidant Activity, and Cytotoxicity of Methanolic Leaf Extract of Chlorophytum Comosum (Green Type) (Thunb.) Jacq.Molecules. 2022 Jan 24;27(3):762. doi: 10.3390/molecules27030762. Molecules. 2022. PMID: 35164026 Free PMC article.
References
-
- D'Orazio J.A., Nobuhisa T., Cui R., Arya M., Spry M., Wakamatsu K., Igras V., Kunisada T., Granter S.R., Nishimura E.K., Ito S., Fisher D.E. Topical drug rescue strategy and skin protection based on the role of Mc1r in UV-induced tanning. Nature. 2006;443:340–344. - PubMed
-
- Abdel-Malek Z.A., Knittel J., Kadekaro A.L., Swope V.B., Starner R. The melanocortin 1 receptor and the UV response of human melanocytes--a shift in paradigm. Photochem. Photobiol. 2008;84:501–508. - PubMed
-
- Cadet J., Douki T. Formation of UV-induced DNA damage contributing to skin cancer development. Photochem. Photobiol. Sci. 2018;17:1816–1841. - PubMed
-
- Cui R.T., Widlund H.R., Feige E., Lin J.Y., Wilensky D.L., Igras V.E., D'Orazio J., Fung C.Y., Schanbacher C.F., Granter S.R., Fisher D.E. Central role of p53 in the suntan response and pathologic hyperpigmentation. Cell. 2007;128:853–864. - PubMed
Publication types
MeSH terms
Substances
Grants and funding
LinkOut - more resources
Full Text Sources
Other Literature Sources
Molecular Biology Databases
Research Materials
Miscellaneous
