. 2022 Jan;100(1):35-47.
doi: 10.1002/jnr.24640. Epub 2020 Jun 7.

Dysregulated expression of the alternatively spliced variant mRNAs of the mu opioid receptor gene, OPRM1, in the medial prefrontal cortex of male human heroin abusers and heroin self-administering male rats

Affiliations

Dysregulated expression of the alternatively spliced variant mRNAs of the mu opioid receptor gene, OPRM1, in the medial prefrontal cortex of male human heroin abusers and heroin self-administering male rats

Taylor G Brown et al. J Neurosci Res. 2022 Jan.

Abstract

Heroin, a mu agonist, acts through the mu opioid receptor. The mu opioid receptor gene, OPRM1, undergoes extensive alternative splicing, creating an array of splice variants that are conserved from rodent to humans. Increasing evidence suggests that these OPRM1 splice variants are pharmacologically important in mediating various actions of mu opioids, including analgesia, tolerance, physical dependence, rewarding behavior, as well as addiction. In the present study, we examine expression of the OPRM1 splice variant mRNAs in the medial prefrontal cortex (mPFC), one of the major brain regions involved in decision-making and drug-seeking behaviors, of male human heroin abusers and male rats that developed stable heroin-seeking behavior using an intravenous heroin self-administration (SA) model. The results show similar expression profiles among multiple OPRM1 splice variants in both human control subjects and saline control rats, illustrating conservation of OPRM1 alternative splicing from rodent to humans. Moreover, the expressions of several OPRM1 splice variant mRNAs were dysregulated in the postmortem mPFCs from heroin abusers compared to the control subjects. Similar patterns were observed in the rat heroin SA model. These findings suggest potential roles of the OPRM1 splice variants in heroin addiction that could be mechanistically explored using the rat heroin SA model.

Keywords: OPRM1; heroin; medial prefrontal cortex; mu opioid receptor; opioid; splicing.


Conflict of interest statement

Conflict of Interest Statement:

YXP is a co-scientific founder of Sparian Biosciences.

Figures
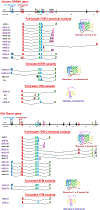
Fig. 1.
Fig. 1.
Schematic of the OPRM1 gene structure and alternative splicing A. The human OPRM1 gene structure and alternatively spliced variants. Top panel: the human OPRM1 gene structure. Exons and introns are indicated by boxes and horizontal lines, respectively. Intron size is indicated below the introns as kilobases (kb). Promoters are showed by arrows. Exons are numbered based upon the published data. Bottom panel: Alternatively spliced variants. For each variant, exons are joined by tilted lines. Translation start and stop points are shown by bars below and above exon boxes, respectively. The underlined variants with purple letters are studied in the present study. The predicted protein structures of three variant types are shown by inserted cartoons. B. The rat Oprm1 gene structure and alternatively spliced variants. Top panel: the rat Oprm1 gene structure. Exons and introns are indicated by boxes and horizontal lines, respectively. Intron size is indicated below the introns as kilobases (kb). Promoters are showed by arrows. Exons are numbered based upon the published data. Bottom panel: Alternatively spliced variants. For each variant, exons are joined by tilted lines. Translation start and stop points are shown by bars below and above exon boxes, respectively. The underlined variants with purple letters are studied in the present study. The predicted protein structures of three variant types are shown by inserted cartoons.
Fig. 2.
Fig. 2.
Expression of the OPRM1 alternatively spliced variants in the mPFC of normal human control subjects and saline control rats A. Expression of the OPRM1 alternatively spliced variants in the mPFC of normal human control subjects. RNAs isolated from the mPFC of normal subjects (n = 10) were used for SYBR Green qPCR. hE1–2 represents all the 7TM C-terminal variants. Expression levels were indicated by -ΔC(t) values calculated through ΔC(t)/(−1), where ΔC(t) = C(t)variant – C(t)NF (NF (Normalized Factor) = (C(t)G3PDH x C(t)SDHA x C(t)β2M)1/3). Converting ΔC(t) values to negative ones through ΔC(t)/(−1) formula is commonly used in qPCR to allow visualizing the data in a positive correlation with the expression levels since ΔC(t) values are inversely proportionated with expression levels. Significant difference was calculated by one-way ANOVA with Fisher LSD, F(13,125) = 74.33, overall p < 0.0001. The results of the multiple comparisons are listed in Table S2. B. Expression of the OPRM1 alternatively spliced variants in the mPFC of saline control rats (n = 7). rE1–2 represents all the 7TM C-terminal variants. Expression levels were calculated through (ΔC(t)/(−1)), where ΔC(t) = C(t)variant – C(t)NF (NF (Normalized Factor) = (C(t)G3PDH x C(t)18S)1/2). Significant difference was calculated by one-way ANOVA with Fisher LSD, F(12,78) = 125.9, overall p < 0.0001. The results of the multiple comparisons are listed in Table S3.
Fig. 3.
Fig. 3.
Heatmap of the expression of the OPRM1 splice variant mRNAs in the mPFC of human heroin abusers and heroin self-administering rats A. Heatmap of expression of the human OPRM1 splice variant mRNAs in the postmortem mPFC of normal control subjects and heroin abusers. Heatmap was generated using the Heat Map graph of GraphPad 8 from ΔC(t)/(−1) values, where ΔC(t) = C(t)variant – C(t)NF (NF (Normalized Factor) = (C(t)G3PDH x C(t)SDHA x C(t)β2M)1/3). Expression level was indicated by ΔC(t)/(−1) values in order from highest (most dark blue) to lowest (most light blue). ↑ and ↓: significantly increased or decreased expression as compared to control subjects, respectively. B. Heatmap of expression of the rat Oprm1 splice variant mRNAs in the mPFC of saline control and heroin self-administration rats. Heatmap was generated using the Heat Map graph of GraphPad 8 from ΔC(t)/(−1) values, where ΔC(t) = C(t)variant – C(t)NF (NF (Normalized Factor) = (C(t)G3PDH x C(t)18S)1/2). Expression level was indicated by ΔC(t)/(−1) values in order from highest (most dark blue) to lowest (most light blue). ↑ and ↓: significantly increased or decreased expression as compared to saline control rats, respectively.
Fig. 4.
Fig. 4.
Altered expression of the OPRM1 splice variant mRNAs in the mPFC of human heroin abusers and heroin self-administering rats A. Altered expression of the human OPRM1 splice variant mRNAs in the postmortem mPFC of normal control subjects and heroin abusers. RNAs isolated from the mPFC of normal subjects (n = 10) and heroin abusers (n = 9) were used for SYBR Green qPCR. Expression level of heroin abusers was normalized with that of normal control subjects by using their 2-ΔC(t) values, so that the expression level in normal control subjects is, as 100%. Two-Way ANOVA with uncorrected Fisher LSD showed a statistically significant effect among the variants, F(13,234) = 3.865, p < 0.0001, between normal control subjects and heroin abusers, F(1,234) = 4.943, p = 0.0272, and interaction, F(13,234) = 3.865, p < 0.0001. Compared to Control subjects, *: p < 0.05; **: p <0.01; ***: p < 0.001; ****: p < 0.0001. B. Altered expression of the rat Oprm1 splice variant mRNAs in the mPFC of saline control and heroin self-administration rats. RNAs isolated from the mPFC of saline control rats (n = 7) and heroin self-administered rats (n = 5) were used for SYBR Green qPCR. Expression level of heroin self-administered rats was normalized with that of saline control rats by using their 2-ΔC(t) values, so that the expression level in saline control rats is, as always, 100%. Two-Way ANOVA with uncorrected Fisher LSD showed a statistically significant effect among the variants, F(12,129) = 3.217, p = 0.0005, between saline control and heroin self-administered rats, F(1,129) = 2.14e-007, p = 0.9996, and interaction, F(12,129) = 3.217, p < 0.0005. Compared to saline control rats, *: p < 0.05; ***: p < 0.001.

Similar articles

Cited by

References

    1. Abbadie C, Gultekin SH, & Pasternak GW (2000). Immunohistochemical localization of the carboxy terminus of the novel mu opioid receptor splice variant MOR-1C within the human spinal cord. Neuroreport, 11, 1953–1957. - PubMed
    1. Abbadie C, Pan YX, Drake CT, & Pasternak GW (2000). Comparative immunohistochemical distributions of carboxy terminus epitopes from the mu-opioid receptor splice variants MOR-1D, MOR-1 and MOR-1C in the mouse and rat CNS. Neuroscience, 100(1), 141–153. - PubMed
    1. Abbadie C, Pan YX, & Pasternak GW (2000). Differential distribution in rat brain of mu opioid receptor carboxy terminal splice variants MOR-1C-like and MOR-1-like immunoreactivity: Evidence for region-specific processing. Journal of Comparative Neurology, 419(2), 244–256. - PubMed
    1. Abbadie C, & Pasternak GW (2001). Differential in vivo internalization of MOR-1 and MOR-1C by morphine. Neuroreport, 12, 3069–3072. - PubMed
    1. Abbadie C, Pasternak GW, & Aicher SA (2001). Presynaptic localization of the carboxy-terminus epitopes of the [mu] opioid receptor splice variants MOR-1C and MOR-1D in the superficial laminae of the rat spinal cord. Neuroscience, 106(4), 833–842. - PubMed