. 2020 Aug 25;142(8):776-789.
doi: 10.1161/CIRCULATIONAHA.119.041868. Epub 2020 Jun 8.

Omega-3 Polyunsaturated Fatty Acids Decrease Aortic Valve Disease Through the Resolvin E1 and ChemR23 Axis

Affiliations

Omega-3 Polyunsaturated Fatty Acids Decrease Aortic Valve Disease Through the Resolvin E1 and ChemR23 Axis

Gonzalo Artiach et al. Circulation. .

Abstract

Background: Aortic valve stenosis (AVS), which is the most common valvular heart disease, causes a progressive narrowing of the aortic valve as a consequence of thickening and calcification of the aortic valve leaflets. The beneficial effects of omega-3 polyunsaturated fatty acids (n-3 PUFAs) in cardiovascular prevention have recently been demonstrated in a large randomized, controlled trial. In addition, n-3 PUFAs serve as the substrate for the synthesis of specialized proresolving mediators, which are known by their potent beneficial anti-inflammatory, proresolving, and tissue-modifying properties in cardiovascular disease. However, the effects of n-3 PUFA and specialized proresolving mediators on AVS have not yet been determined. The aim of this study was to identify the role of n-3 PUFA-derived specialized proresolving mediators in relation to the development of AVS.

Methods: Lipidomic and transcriptomic analyses were performed in human tricuspid aortic valves. Apoe-/- mice and wire injury in C57BL/6J mice were used as models for mechanistic studies.

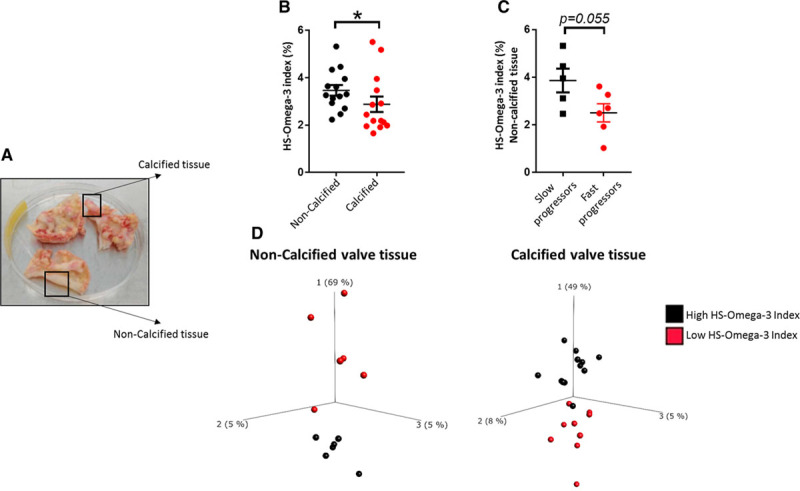
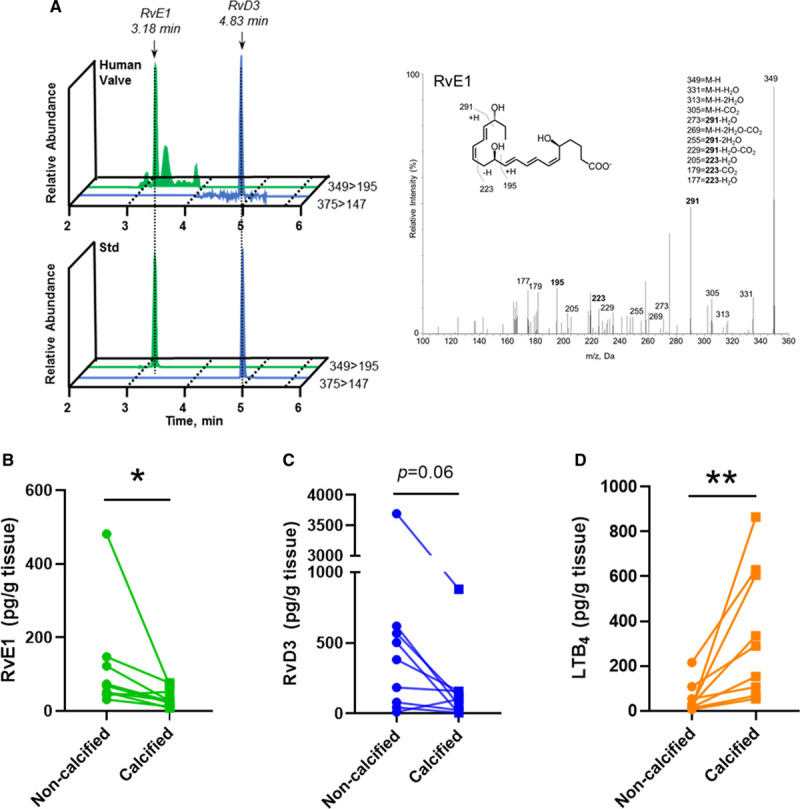
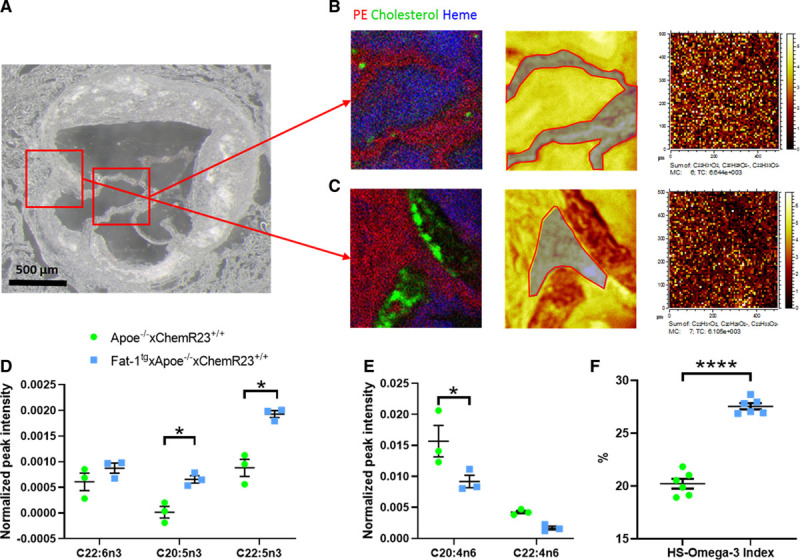
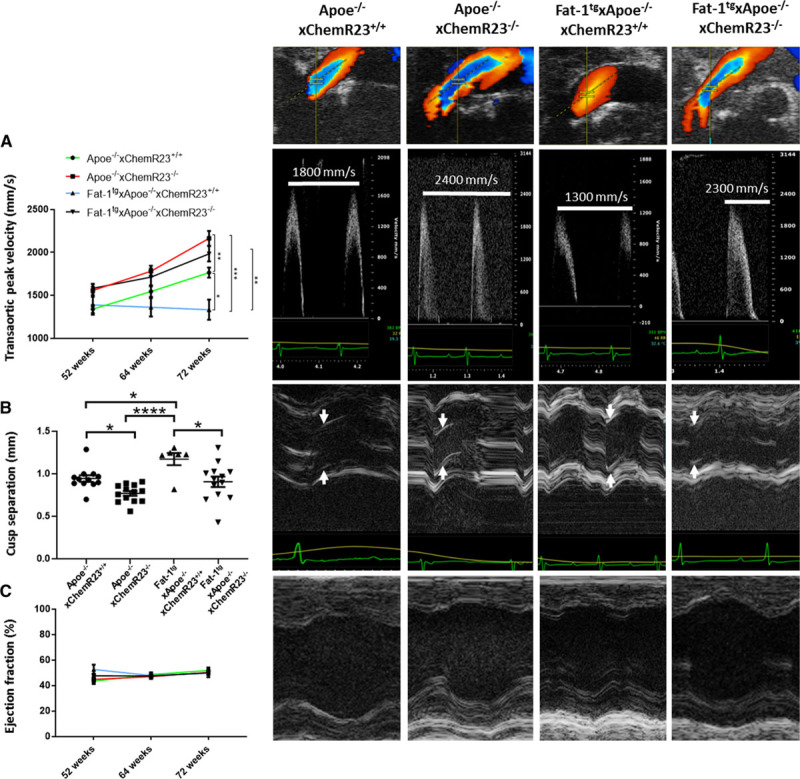
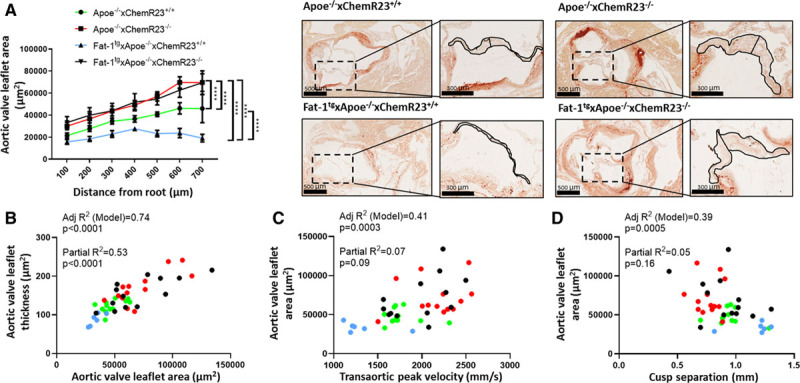
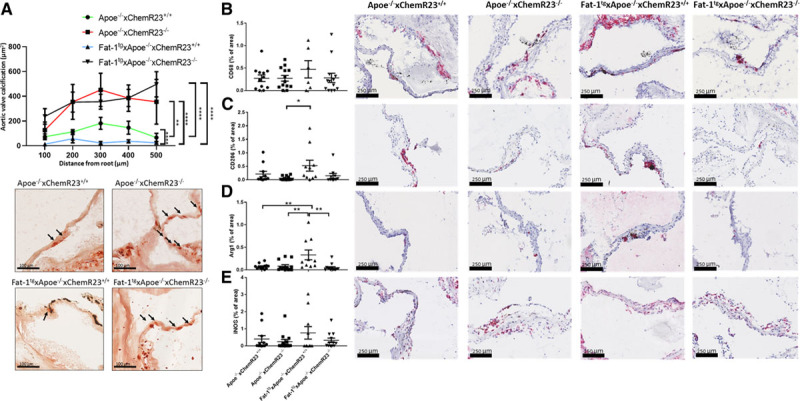
Results: We found that n-3 PUFA incorporation into human stenotic aortic valves was higher in noncalcified regions compared with calcified regions. Liquid chromatography tandem mass spectrometry-based lipid mediator lipidomics identified that the n-3 PUFA-derived specialized proresolving mediator resolvin E1 was dysregulated in calcified regions and acted as a calcification inhibitor. Apoe-/- mice expressing the Caenorhabditis elegans Fat-1 transgene (Fat-1tg×Apoe-/-), which enables the endogenous synthesis of n-3 PUFA and increased valvular n-3 PUFA content, exhibited reduced valve calcification, lower aortic valve leaflet area, increased M2 macrophage polarization, and improved echocardiographic parameters. Finally, abrogation of the resolvin E1 receptor ChemR23 enhanced disease progression, and the beneficial effects of Fat-1tg were abolished in the absence of ChemR23.

Conclusions: n-3 PUFA-derived resolvin E1 and its receptor ChemR23 emerge as a key axis in the inhibition of AVS progression and may represent a novel potential therapeutic opportunity to be evaluated in patients with AVS.

Keywords: calcification, physiologic; fatty acids, omega-3; heart valve diseases; inflammation; lipids.


Figures

Figure 1.
Figure 1.
HS-omega-3 index is decreased in calcified aortic valve tissue and is lower in noncalcified valve tissue of aortic valve stenosis (AVS) fast progressors. A, Aortic valves from patients undergoing aortic valve replacement were dissected into noncalcified and calcified valve tissue. B, HS-omega-3 index measured by gas chromatography in calcified and noncalcified valve tissue from the same patients (n=14). C, HS-omega-3 index in patients with AVS with slow and fast progression in noncalcified (n=5 and n=6, respectively) valve tissue. Data are presented as individual values; horizontal lines represent mean±SEM. Statistical significance was evaluated using either paired (B) or unpaired (C) Student t test. *P<0.05. D, Transcriptomics-based principal component (PC) analysis of noncalcified (n=6 high, n=6 low HS-omega-3 index) and calcified (n=12 high, n=9 low HS-omega-3 index) human valve tissue. The 3 axes represent the principal components displaying maximum variability between data sets, in which PC1 represents the axis with most variability.
Figure 2.
Figure 2.
Resolvin E1 (RvE1) is dysregulated in human calcified valve tissue. A, Representative multiple reaction monitoring chromatograms depicting the relative abundance of RvE1 and resolvin D3 (RvD3; Q1>Q3), and accompanying tandem mass spectrometry spectra used in the identification of RvE1 (inset, diagnostic ions). Bthrough D, RvE1, RvD3, and leukotriene B4 (LTB4) levels from aortic valve tissue determined by liquid chromatography tandem mass spectrometry–based lipid mediator lipidomics. Data are presented as individual values, and statistical significance was evaluated by paired Student t test (n=9 vs n=9). M indicates molecular mass. *P<0.05; **P<0.01.
Figure 3.
Figure 3.
The resolvin E1 (RvE1) receptor ChemR23 is expressed in human aortic valves. and RvE1 reduces calcification in human valvular interstitial cells (VICs) in vitro. A, Relative abundance of RNA encoding the specialized proresolving lipid mediator receptors ChemR23, GPR18, GPR32, and ALX/FPR2 in noncalcified human valve tissue (n=64; top), and difference in gene expression between calcified and noncalcified regions (bottom). B, Representative photomicrographs of ChemR23 immunohistochemical detection in human aortic valves. White space and dense purple deposits are found at sites of calcified nodules. Higher magnification images of 3 regions of interest (ROIs) display the presence of ChemR23 in the fibrosa (ROI 1), spongiosa (ROI 2), and ventricularis (ROI 3) layers. CandD, Representative immunofluorescence stainings of human aortic valves showing colocalization of VIC markers (smooth muscle actin [SMA]– and Vimentin-positive cells) and ChemR23. E, In vitro effects of RvE1 and quantification by Osteoimage Mineralization Assay of phosphate-induced calcification in VICs after 9 days. Data are presented as individual values, and horizontal lines represent mean±SEM. Statistical significance was evaluated with a mixed-effects ANOVA followed by Holm-Sidak multiple-comparison test; n=3 in duplicates. F, Representative photomicrographs of phosphate-treated VICs stained by Alizarin Red. *P<0.05.
Figure 4.
Figure 4.
Omega-3 polyunsaturated fatty acids (PUFAs) are higher and n-6 PUFAs are lower in valve leaflets of Fat-1tg×Apoe−/− compared with Apoe−/− mice. A, Optical micrograph of an aortic root section of a Fat-1tg×Apoe−/− mouse. Red squares indicate areas (500×500 µm2) for focused analyses of valve leaflets and valve insertion, respectively. Band C, Time-of-flight secondary ion mass spectrometry (TOF-SIMS) data from 2 different regions of the valve leaflet area with ion images of (left) overlay image of phosphatidylethanolamine (PE) in red, cholesterol in green, and heme in blue (left); total ion image with region of interest (ROI) used for extraction of mass spectrum of valve leaflet indicated in gray (middle); and image of the added signal intensity of eicosapentaenoic acid (EPA; C20:5n3), docosahexaenoic acid (DHA; C22:6n3), and docosapentaenoic acid (DPA, C22:5n3; right). Brighter pixels in the ion images correspond to higher signal intensities. D, n-3 PUFAs (DHA, EPA, and DPA) and (E) n-6 PUFAs (arachidonic acid [C20:4n6] and adrenic acid [C22:4n6]) normalized TOF-SIMS signal intensities (n=3 animals per group; each observation is the average of 3 independent leaflet regions at different valve levels) in mass spectra acquired from valve leaflets. F, HS-omega-3 index in ventricular myocardium measured by gas chromatography in Apoe−/− compared with Fat-1tg×Apoe−/− mice (n=6 per group). Data are presented as individual values with horizontal lines representing mean±SEM. Statistical significances were evaluated with either a Student t test or a 2-way repeated measures ANOVA followed by Holm-Sidak multiple-comparison test. *P<0.05. ****P<0.0001.
Figure 5.
Figure 5.
Fat-1tg halts whereas targeted deletion of ChemR23 increases echocardiographic progression in Apoe−/− mice. A, Transaortic peak velocity, (B) cusp separation, and (C) ejection fraction in 52-, 64-, and 72-week-old Apoe−/−×ChemR23+/+ (n=12), Apoe−/−×ChemR23−/− (n=13), Fat-1tg×Apoe−/−×ChemR23+/+ (n=6), and Fat-1tg×Apoe−/−×ChemR23−/− (n=13) mice. Representative color Doppler, Doppler, and M-mode tracings are shown in 72-week-old mice. Data are presented either as individual values with horizontal lines representing mean±SEM or as mean±SEM. Statistical significances were evaluated with either a 1- or 2- way repeated measures ANOVA followed by Holm-Sidak multiple-comparison test. Results are pooled from 2 independent experiments. *P<0.05; **P<0.01; ***P<0.001; ****P<0.0001.
Figure 6.
Figure 6.
Fat-1tg reduces aortic valve leaflet area and targeted deletion of ChemR23 increases aortic valve leaflet area in Apoe−/− mice. A, Aortic valve leaflet area in 72-week-old Apoe−/−×ChemR23+/+ (n=12), Apoe−/−×ChemR23−/− (n=13), Fat-1tg×Apoe−/−×ChemR23+/+ (n=10), and Fat-1tg×Apoe−/−×ChemR23−/− (n=13) mice and representative photomicrographs. Data are presented as mean±SEM. Statistical significance was determined with a 2-way ANOVA followed by Holm-Sidak multiple-comparison test. ****P<0.0001. B, Adjusted R2 and partial R2 for the correlation between aortic valve leaflet area and aortic valve leaflet thickness. C, Adjusted R2 and partial R2 for the correlation between transaortic peak velocity and aortic valve leaflet area. D, Adjusted R2 and partial R2 for the correlation between cusp separation and aortic valve leaflet area. Apoe−/−×ChemR23+/+ (n=12), Apoe−/−×ChemR23−/− (n=13), Fat-1tg×Apoe−/−×ChemR23+/+ (n=6), and Fat-1tg×Apoe−/−×ChemR23−/− (n=13) mice for all correlations.
Figure 7.
Figure 7.
Fat-1tg reduces leaflet calcification and induces M2 macrophage polarization and targeted deletion of ChemR23 increases leaflet calcification in Apoe−/− and Fat-1tg mice. A, Quantification of Alizarin Red–stained calcification in 72-week-old Apoe−/−×ChemR23+/+ (n=12), Apoe−/−×ChemR23−/− (n=13), Fat-1tg×Apoe−/−×ChemR23+/+ (n=10), and Fat-1tg×Apoe−/−×ChemR23−/− (n=13) and representative photomicrographs. B, Representative photomicrographs and quantification of leaflets stained with antibodies against the macrophage marker CD68, (C) CD206, (D) arginase 1 (Arg1), and (E) inducible nitric oxide synthase (iNOS) normalized to total aortic valve leaflet area in 72-week-old Apoe−/−×ChemR23+/+ (n= 11-12), Apoe−/−×ChemR23−/− (n=13), Fat-1tg×Apoe−/−×ChemR23+/+ (n= 6-10), and Fat-1tg×Apoe−/−×ChemR23−/− (n= 10-13). Statistical significance was determined with a 1- or 2-way repeated measures ANOVA followed by Holm-Sidak multiple-comparison test. *P<0.05; **P<0.01; ****P<0.0001.

References

    1. Turina J, Hess O, Sepulcri F, Krayenbuehl HP. Spontaneous course of aortic valve disease. Eur Heart J. 1987; 8:471–483. doi: 10.1093/oxfordjournals.eurheartj.a062307 - PubMed
    1. Bäck M, Gasser TC, Michel JB, Caligiuri G. Biomechanical factors in the biology of aortic wall and aortic valve diseases. Cardiovasc Res. 2013; 99:232–241. doi: 10.1093/cvr/cvt040 - PMC - PubMed
    1. Kleinauskienė R, Jonkaitienė R. Degenerative aortic stenosis, dyslipidemia and possibilities of medical treatment. Medicina (Kaunas). 2018; 54:24 doi: 10.3390/medicina54020024 - PMC - PubMed
    1. Al-Azizi K, Hamandi M, Mack M. Clinical trials of transcatheter aortic valve replacement. Heart. 2019; 105suppl 2s6–s9. doi: 10.1136/heartjnl-2018-313511 - PubMed
    1. Bhatt DL, Steg PG, Miller M, Brinton EA, Jacobson TA, Ketchum SB, Doyle RT, Jr, Juliano RA, Jiao L, Granowitz C, et al. ; REDUCE-IT Investigators. Cardiovascular risk reduction with icosapent ethyl for hypertriglyceridemia. N Engl J Med. 2019; 380:11–22. doi: 10.1056/NEJMoa1812792 - PubMed

Publication types

Substances