. 2020 Jun;39(26):4970-4982.
doi: 10.1038/s41388-020-1333-1. Epub 2020 Jun 7.

ZSCAN4 facilitates chromatin remodeling and promotes the cancer stem cell phenotype

Affiliations

ZSCAN4 facilitates chromatin remodeling and promotes the cancer stem cell phenotype

Benjamin A Portney et al. Oncogene. 2020 Jun.

Abstract

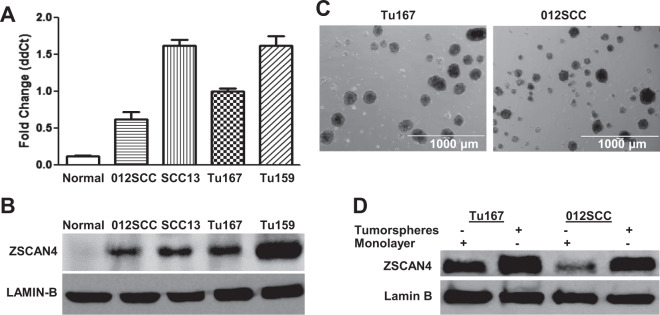
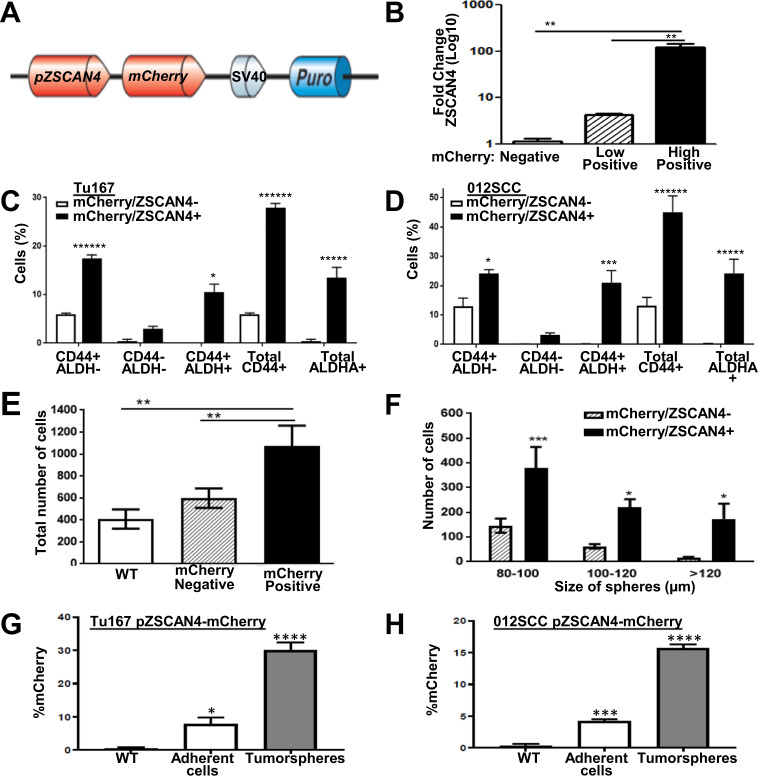
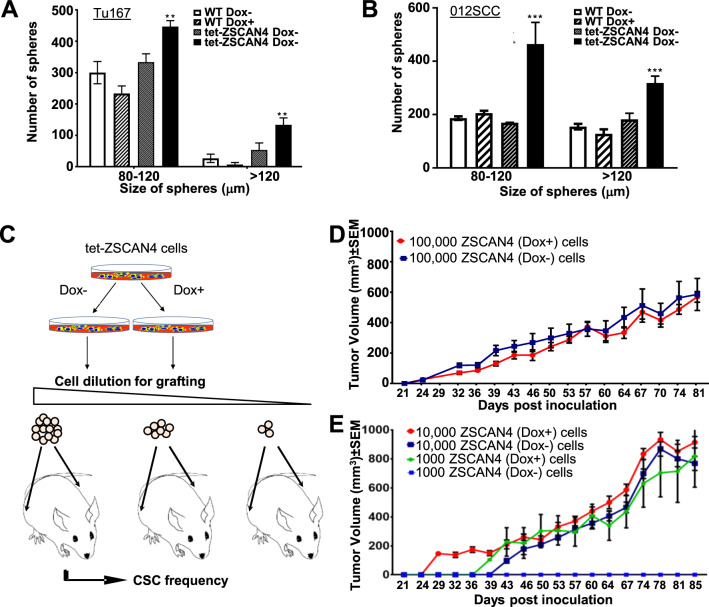
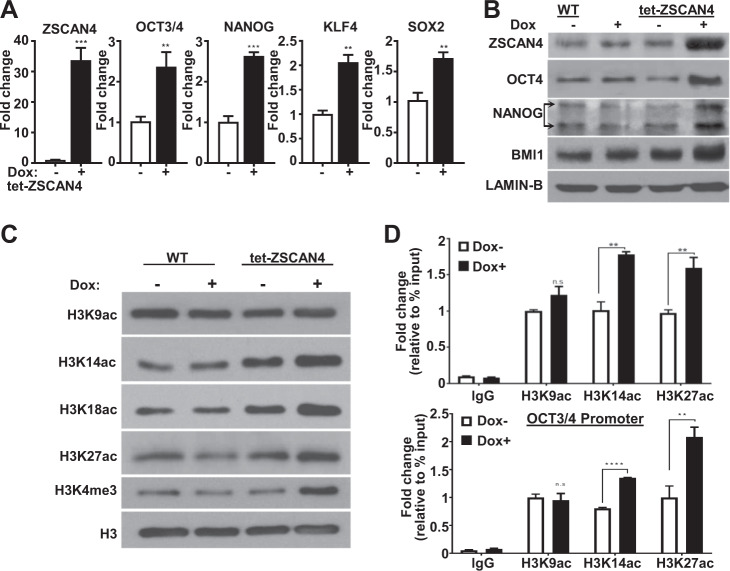
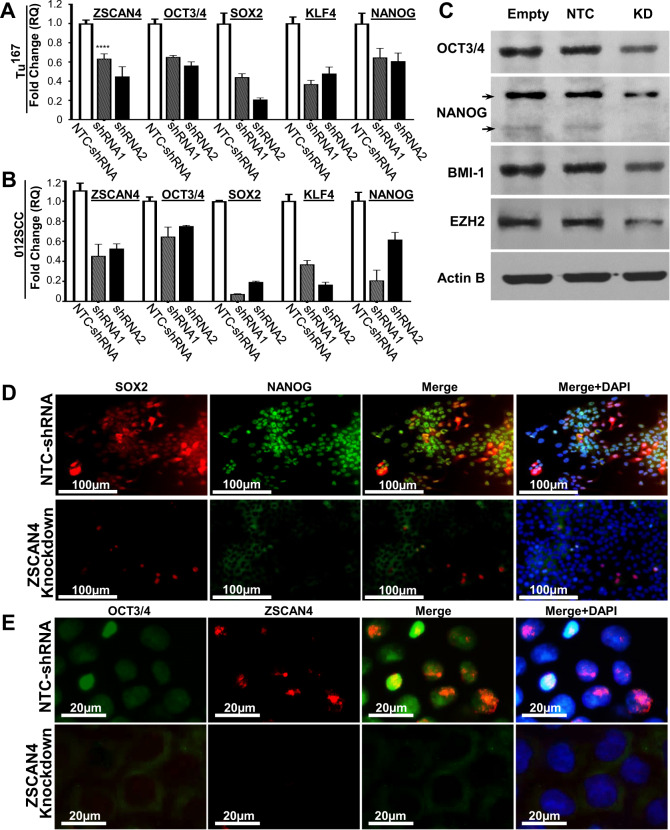
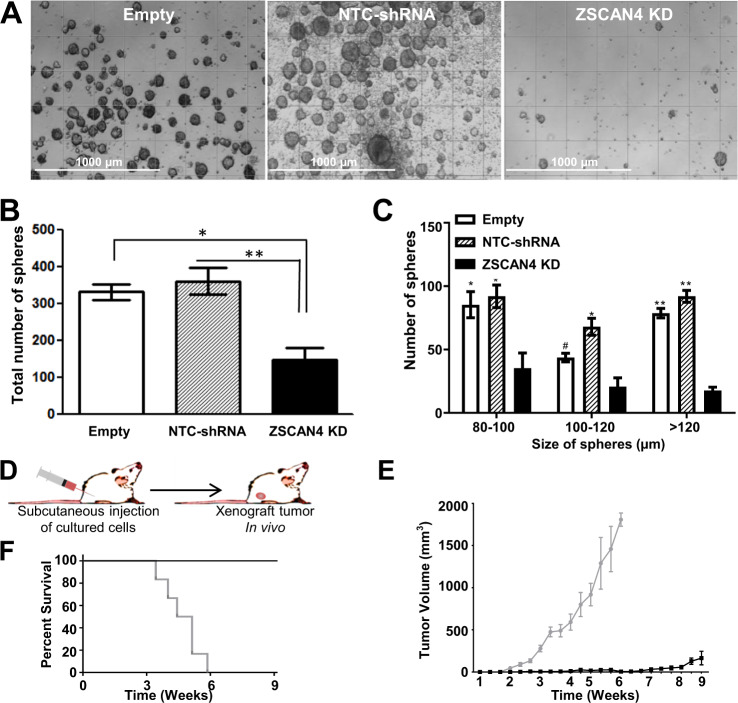
Cancer stem cells (CSCs) are cells within tumors that maintain the ability to self-renew, drive tumor growth, and contribute to therapeutic resistance and cancer recurrence. In this study, we investigate the role of Zinc finger and SCAN domain containing 4 (ZSCAN4) in human head and neck squamous cell carcinoma (HNSCC). The murine Zscan4 is involved in telomere maintenance and genomic stability of mouse embryonic stem cells. Our data indicate that the human ZSCAN4 is enriched for, marks and is co-expressed with CSC markers in HNSCC. We show that transient ZSCAN4 induction for just 2 days increases CSC frequency both in vitro and in vivo and leads to upregulation of pluripotency and CSC factors. Importantly, we define for the first time the role of ZSCAN4 in altering the epigenetic profile and regulating the chromatin state. Our data show that ZSCAN4 leads to a functional histone 3 hyperacetylation at the promoters of OCT3/4 and NANOG, leading to an upregulation of CSC factors. Consistently, ZSCAN4 depletion leads to downregulation of CSC markers, decreased ability to form tumorspheres and severely affects tumor growth. Our study suggests that ZSCAN4 plays an important role in the maintenance of the CSC phenotype, indicating it is a potential therapeutic target in HNSCC.


Conflict of interest statement

The authors declare that they have no conflict of interest.

Figures

Fig. 1
Fig. 1. ZSCAN4 is expressed in HNSCC and is upregulated in tumorspheres.
a ZSCAN4 is expressed in HNSCC cell lines, as shown by qPCR and by b immunoblot analyses, whereas normal human tonsil primary control cells from four different donors are negative. Error bars indicate S.E.M. c Representative phase contrast images of tumorspheres in WT HNSCC cell lines Tu167 and 012SCC. Scale bar indicates 1000 µm d immunoblot assays indicate that ZSCAN4 expression is enriched for in tumorspheres compared with attached cells in complete medium (monolayer).
Fig. 2
Fig. 2. ZSCAN4 expression correlates with CSC markers, larger tumorspheres, and is upregulated in spheroid conditions.
a A schematic illustration of the lentiviral vector with mCherry reporter under the ZSCAN4 promoter. b qRT-PCR for ZSCAN4 expression in Tu167 pZSCAN4-mCherry cells after FACS sorting into three groups: high mCherry (High-Positive), low (Low-Pos), and negatively sorted, indicating ZSCAN4 correlates with mCherry expression. c mCherry reporter assay in Tu167 and d 012SCC cells indicates that mCherry/ZSCAN4 correlates with the CSC Markers CD44 and ALDH1A1. e Tumorsphere formation assay shows a total increase in the number of tumorspheres in mCherry/ZSCAN4 positive cells compared with negative and Tu167 wild type (WT) cells. f Classification of tumorspheres according to size demonstrate a major increase in the larger tumorspheres. All data shown as mean ± S.E.M. observed in triplicate in at least three independent experiments (Tu167, with consistent results in 012SCC). g pZSCAN4-mCherry Tu167 and h 012SCC cells in monolayers (adherent) and 8 days after tumorsphere formation indicates an increase in the frequency of mCherry in tumorspheres. All data shown are mean ± SEM. Asterisks indicate: *p < 0.05, **p < 0.01, ***p < 0.001, ****p < 0.0001, *******p < 10−7.
Fig. 3
Fig. 3. ELDA shows ZSCAN4 induction increases the frequency and size of tumorspheres and tumors.
a Induction of ZSCAN4 in tet-ZSCAN4 Tu167 cells and b 012SCC cells by addition of doxycycline for 48 h (Dox+), prior to generation of tumorspheres, significantly increases the number and size of tumorspheres compared with untreated isogenic controls (Dox−) and to wild type (WT) treated or untreated with Dox. The statistical significance between the groups was determined using two away ANOVA with multiple Tukey’s post hoc comparisons. Asterisks indicate a significant difference from isogenic untreated and WT cells: **p < 0.01, ***p < 0.001. c Illustration of Extreme limiting dilution assay (ELDA) in vivo in NGS immunodeficient mice. tet-ZSCAN4 (Tu167) cells were treated (Dox+) or untreated (Dox−) with Dox for 48 h in culture. No Dox was given to the mice throughout the rest of the experiment. Cells were injected subcutaneously into the right and left flank of NOD/SCID gamma immunodeficient mice in multiple increasing dilutions: 100,000 cells, 10,000 cells, and 1000 cells per inoculation (n = 8), and allowed to form tumors for up to 85 days. d, e Tumor growth shown are mean ± SEM for each group (100,000 n = 6; 10,000 n = 8; 1000 n = 8).
Fig. 4
Fig. 4. Induction of ZSCAN4 promotes CSC factor expression and facilitates chromatin remodeling.
ZSCAN4 induction (tet-ZSCAN4 Tu167 cells) results in a significant increase in a pluripotency factor expression (OCT4, NANOG, KLF4, and SOX2) as shown by qRT-PCR. Data shown as mean ± S.E.M. observed in triplicate in three independent experiments. Separate t-tests confirm a significant difference from isogenic untreated cells: **p < 0.01, ***p < 0.001. b immunoblots show a marked increase in pluripotency and CSC markers. c Immunoblot analyses indicate ZSCAN4 induction leads to an increase in open chromatin marks: histone 3 (H3) acetylation at lysine residues 14, 18, and 27 (K14ac, K18ac, K27ac) and H3K4 methylation (H3K4me). H3 was used as a loading control. d Chip-qPCR indicates a significant enrichment in histone 3 acetylation at Lysine 14 and 27 at NANOG and OCT3/4 promoters after ZSCAN4 induction. Data shown as mean ± S.E.M. The statistical significance between the two groups was determined by separate t-tests ***p < 0.01. ****p < 0.0001.
Fig. 5
Fig. 5. ZSCAN4 is required for the expression of cancer stem cell markers.
RT-qPCR analysis of ZSCAN4 knockdown (KD) by two different shRNA (shRNA 1 and 2) in Tu167 (a) and 012SCC (b), indicates that ZSCAN4 depletion results in decreased expression of the pluripotent stem cell factors OCT3/4, SOX2, KLF4, and NANOG compared with non-targeting control (NTC) shRNA in isogenic control cells. Asterisks indicate: *p<0.05, **p<0.01, ***p<0.001. The statistical significance was determined by two away ANOVA with multiple Tukey’s post hoc tests. The reduction in pluripotency and CSC factors were further validated by: c Immunoblot after ZSCAN4 knockdown compared to isogenic cells with Empty vector or NTC-shRNA expressing endogenous levels of ZSCAN4. Actin B was used as loading control. d Representative images of co-immunostaining of SOX2 (red) and NANOG (green) as well as e OCT3/4 (green) and ZSCAN4 (red). Nuclei are visualized by DAPI.
Fig. 6
Fig. 6. ZSCAN4 is essential for tumorsphere growth and survival and depletion severely affects tumor growth.
a Representative images of tumorspheres in ZSCAN4 depleted cells compared with isogenic cells with Empty vector or NTC-shRNA. Scale bar indicate 1000 µm. b ZSCAN4 Knockdown (KD) results in fewer and c smaller tumorspheres when compared with both control cell lines (Empty and NTC-shRNA). Significance of data were confirmed by separate one-way ANOVAs followed by Tukey’s post hoc tests. All data shown as mean ± S.E.M. observed in triplicate in at least three independent experiments. Asterisks indicate: *p < 0.05, **p < 0.01. d Schematic illustration of mouse xenograft model. NGS mice were injected subcutaneously with Tu167 ZSCAN4 knockdown cells (n = 10), or NTC-shRNA cells as controls (n = 10) and allowed to form xenograft tumors. e Tumor volume at indicated time. Error bars denote S.E.M., (p ≤ 0.001) starting from week 3. f Kaplan–Meier survival curve of mice inoculated (p ≤ 0.001); results are shown from day of cell injection to the day of euthanasia.

References

    1. Boyer LA, Lee TI, Cole MF, Johnstone SE, Levine SS, Zucker JP, et al. Core transcriptional regulatory circuitry in human embryonic stem cells. Cell. 2005;122:947–56. - PMC - PubMed
    1. Loh YH, Wu Q, Chew JL, Vega VB, Zhang W, Chen X, et al. The Oct4 and Nanog transcription network regulates pluripotency in mouse embryonic stem cells. Nat Genet. 2006;38:431–40. - PubMed
    1. Boyer LA, Plath K, Zeitlinger J, Brambrink T, Medeiros LA, Lee TI, et al. Polycomb complexes repress developmental regulators in murine embryonic stem cells. Nature. 2006;441:349–53. - PubMed
    1. Lee TI, Jenner RG, Boyer LA, Guenther MG, Levine SS, Kumar RM, et al. Control of developmental regulators by Polycomb in human embryonic stem cells. Cell. 2006;125:301–13. - PMC - PubMed
    1. Ben-Porath I, Thomson MW, Carey VJ, Ge R, Bell GW, Regev A, et al. An embryonic stem cell-like gene expression signature in poorly differentiated aggressive human tumors. Nat Genet. 2008;40:499–507. - PMC - PubMed

Publication types

MeSH terms