

SMRT Sequencing of Paramecium Bursaria Chlorella Virus-1 Reveals Diverse Methylation Stability in Adenines Targeted by Restriction Modification Systems
- PMID: 32508769
- PMCID: PMC7248222
- DOI: 10.3389/fmicb.2020.00887
SMRT Sequencing of Paramecium Bursaria Chlorella Virus-1 Reveals Diverse Methylation Stability in Adenines Targeted by Restriction Modification Systems
Abstract
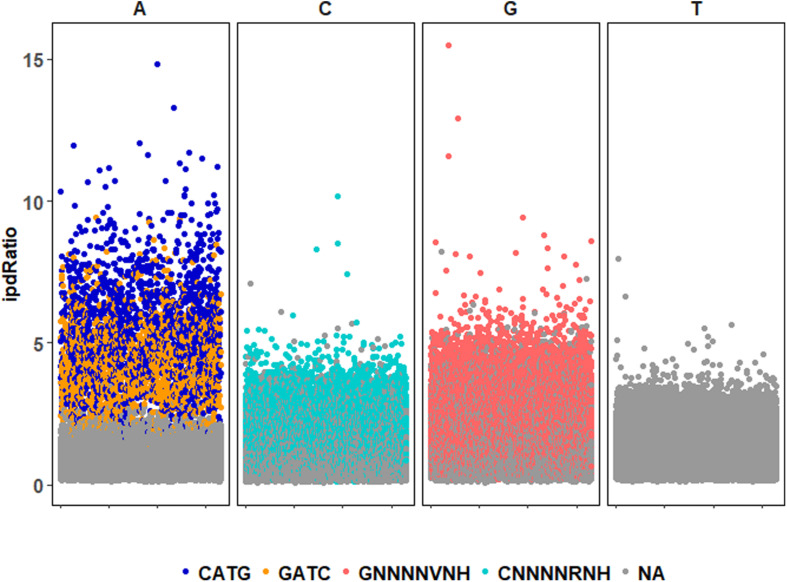
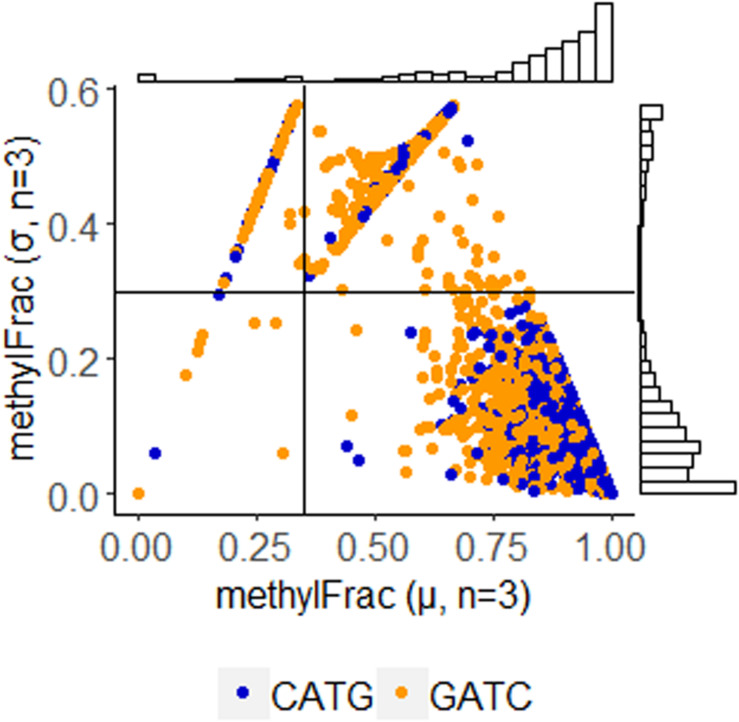
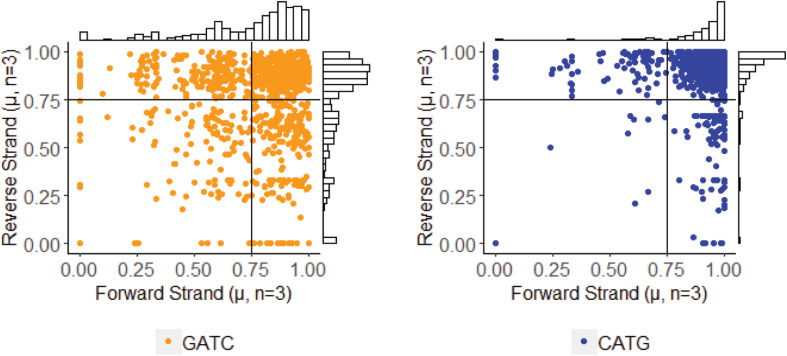
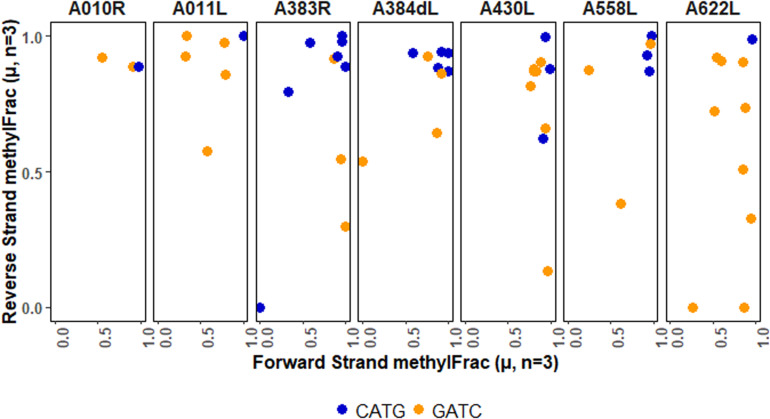
Chloroviruses (family Phycodnaviridae) infect eukaryotic, freshwater, unicellular green algae. A unique feature of these viruses is an abundance of DNA methyltransferases, with isolates dedicating up to 4.5% of their protein coding potential to these genes. This diversity highlights just one of the long-standing values of the chlorovirus model system; where group-wide epigenomic characterization might begin to elucidate the function(s) of DNA methylation in large dsDNA viruses. We characterized DNA modifications in the prototype chlorovirus, PBCV-1, using single-molecule real time (SMRT) sequencing (aka PacBio). Results were compared to total available sites predicted in silico based on DNA sequence alone. SMRT-software detected N6-methyl-adenine (m6A) at GATC and CATG recognition sites, motifs previously shown to be targeted by PBCV-1 DNA methyltransferases M.CviAI and M. CviAII, respectively. At the same time, PacBio analyses indicated that 10.9% of the PBCV-1 genome had large interpulse duration ratio (ipdRatio) values, the primary metric for DNA modification identification. These events represent 20.6x more sites than can be accounted for by all available adenines in GATC and CATG motifs, suggesting base or backbone modifications other than methylation might be present. To define methylation stability, we cross-compared methylation status of each GATC and CATG sequence in three biological replicates and found ∼81% of sites were stably methylated, while ∼2% consistently lack methylation. The remaining 17% of sites were stochastically methylated. When methylation status was analyzed for both strands of each target, we show that palindromes existed in completely non-methylated states, fully-methylated states, or hemi-methylated states, though GATC sites more often lack methylation than CATG sequences. Given that both sequences are targeted by not just methyltransferases, but by restriction endonucleases that are together encoded by PBCV-1 as virus-originating restriction modification (RM) systems, there is strong selective pressure to modify all target sites. The finding that most instances of non-methylation are associated with hemi-methylation is congruent with observations that hemi-methylated palindromes are resistant to cleavage by restriction endonucleases. However, sites where hemi-methylation is conserved might represent a unique regulatory function for PBCV-1. This study serves as a baseline for future investigation into the epigenomics of chloroviruses and their giant virus relatives.
Keywords: DNA methylation; NCLDV; PBCV-1; algal-virus; chloroviruses; hemimethylation; restriction modification.
Copyright © 2020 Coy, Gann, Papoulis, Holder, Ajami, Petrosino, Zinser, Van Etten and Wilhelm.
Figures
Similar articles
-
Virion-associated restriction endonucleases of chloroviruses.J Virol. 2006 Aug;80(16):8114-23. doi: 10.1128/JVI.00486-06. J Virol. 2006. PMID: 16873267 Free PMC article.
-
DNA methyltransferase induced by PBCV-1 virus infection of a Chlorella-like green alga.Mol Cell Biol. 1986 May;6(5):1440-5. doi: 10.1128/mcb.6.5.1440-1445.1986. Mol Cell Biol. 1986. PMID: 3537703 Free PMC article.
-
Paramecium bursaria chlorella virus 1 proteome reveals novel architectural and regulatory features of a giant virus.J Virol. 2012 Aug;86(16):8821-34. doi: 10.1128/JVI.00907-12. Epub 2012 Jun 13. J Virol. 2012. PMID: 22696644 Free PMC article.
-
Giant viruses infecting algae.Annu Rev Microbiol. 1999;53:447-94. doi: 10.1146/annurev.micro.53.1.447. Annu Rev Microbiol. 1999. PMID: 10547698 Review.
-
Chlorella viruses.Adv Virus Res. 2006;66:293-336. doi: 10.1016/S0065-3527(06)66006-5. Adv Virus Res. 2006. PMID: 16877063 Free PMC article. Review.
Cited by
-
Clandestinovirus: A Giant Virus With Chromatin Proteins and a Potential to Manipulate the Cell Cycle of Its Host Vermamoeba vermiformis.Front Microbiol. 2021 Aug 10;12:715608. doi: 10.3389/fmicb.2021.715608. eCollection 2021. Front Microbiol. 2021. PMID: 34447361 Free PMC article.
-
Diverse DNA modification in marine prokaryotic and viral communities.Nucleic Acids Res. 2022 Feb 22;50(3):1531-1550. doi: 10.1093/nar/gkab1292. Nucleic Acids Res. 2022. PMID: 35051998 Free PMC article.
-
Host-encoded DNA methyltransferases modify the epigenome and host tropism of invading phages.iScience. 2025 Mar 22;28(4):112264. doi: 10.1016/j.isci.2025.112264. eCollection 2025 Apr 18. iScience. 2025. PMID: 40241747 Free PMC article.
-
Genome-wide methylome analysis of two strains belonging to the hypervirulent Neisseria meningitidis serogroup W ST-11 clonal complex.Sci Rep. 2021 Mar 18;11(1):6239. doi: 10.1038/s41598-021-85266-7. Sci Rep. 2021. PMID: 33737546 Free PMC article.
-
Kratosvirus quantuckense: the history and novelty of an algal bloom disrupting virus and a model for giant virus research.Front Microbiol. 2023 Nov 30;14:1284617. doi: 10.3389/fmicb.2023.1284617. eCollection 2023. Front Microbiol. 2023. PMID: 38098665 Free PMC article. Review.
References
-
- Ahlgren N. A., Chen Y., Needham D. M., Parada A. E., Sachdeva R., Trinh V., et al. (2017). Genome and epigenome of a novel marine thaumarchaeota strain suggest viral infection, phosphorothioation DNA modification and multiple restriction systems. Environ. Microbiol. 19 2434–2452. 10.1111/1462-2920.13768 - DOI - PubMed
LinkOut - more resources
Full Text Sources
Other Literature Sources
Molecular Biology Databases