Temperature Variability at Local Scale in the Bordeaux Area. Relations With Environmental Factors and Impact on Vine Phenology
- PMID: 32508854
- PMCID: PMC7251079
- DOI: 10.3389/fpls.2020.00515
Temperature Variability at Local Scale in the Bordeaux Area. Relations With Environmental Factors and Impact on Vine Phenology
Abstract
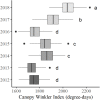
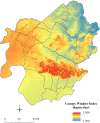
Climate is a major factor of the physical environment influencing terroir expression in viticulture. Thermal conditions strongly impact vine development and grape composition. Spatializing this parameter at local scale allows for more refined vineyard management. In this study, temperature variability was investigated over an area of 19,233 ha within the appellations of Saint-Émilion, Pomerol, and their satellites (Bordeaux, France). A network of 90 temperature sensors was deployed inside grapevine canopies of this area and temperatures were measured from 2012 through 2018. To determine the effect of temperature on vine development, the phenological stages (budbreak, flowering, and véraison) were recorded on 60 reference plots planted with Vitis vinifera L. cv. Merlot located near the temperature sensors. Results showed great spatial variability in temperature, especially minimum temperature, with an amplitude of up to 10°C on a given day. The spatial variability of the Winkler index measured in the canopy inside a given vintage was around 320 degree-days. This research explores the main factors affecting spatial variability in temperature, such as environmental factors and meteorological conditions. The impact of temperature on vine behavior was also analyzed. Observed phenological dates were compared to those estimated using the Grapevine Flowering Véraison model. Maps of temperatures and phenological observations were created over this area and provided a useful tool for improved adaptation of plant material and training systems to local temperature variability and change.
Keywords: climate; local scale; phenology; spatial modeling; terroir; vine development; viticulture.
Copyright © 2020 de Rességuier, Mary, Le Roux, Petitjean, Quénol and van Leeuwen.
Figures


References
-
- Alikadic A., Pertot I., Eccel E., Dolci C., Zarbo C., Caffarra A., et al. (2019). The impact of climate change on grapevine phenology and the influence of altitude: a regional study. Agric. For. Meteorol. 271 73–82. 10.1016/j.agrformet.2019.02.030 - DOI
-
- Baggiolini M. (1952). Stade repère de la vigne. Romande Agric. Vitic. 8 4–6.
-
- Beltrando G. (2000). La climatologie: une science géographique. L’Inf. Géogr. 64 241–261. 10.3406/ingeo.2000.2705 - DOI
-
- Bock A., Sparks T., Estrella N., Menzel A. (2011). Changes in the phenology and composition of wine from Franconia, Germany. Clim. Res. 50 69–81. 10.3354/cr01048 - DOI
LinkOut - more resources
Full Text Sources

