. 2020 May 14:2020:7082679.
doi: 10.1155/2020/7082679. eCollection 2020.

Size-Optimized Microspace Culture Facilitates Differentiation of Mouse Induced Pluripotent Stem Cells into Osteoid-Rich Bone Constructs

Affiliations

Size-Optimized Microspace Culture Facilitates Differentiation of Mouse Induced Pluripotent Stem Cells into Osteoid-Rich Bone Constructs

Phoonsuk Limraksasin et al. Stem Cells Int. .

Abstract

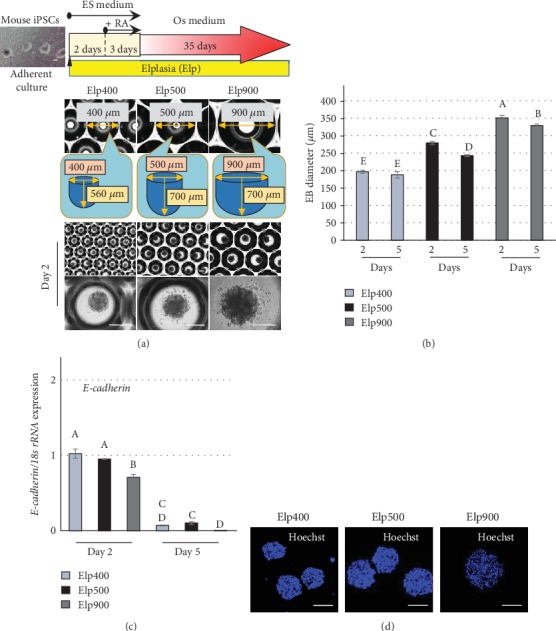
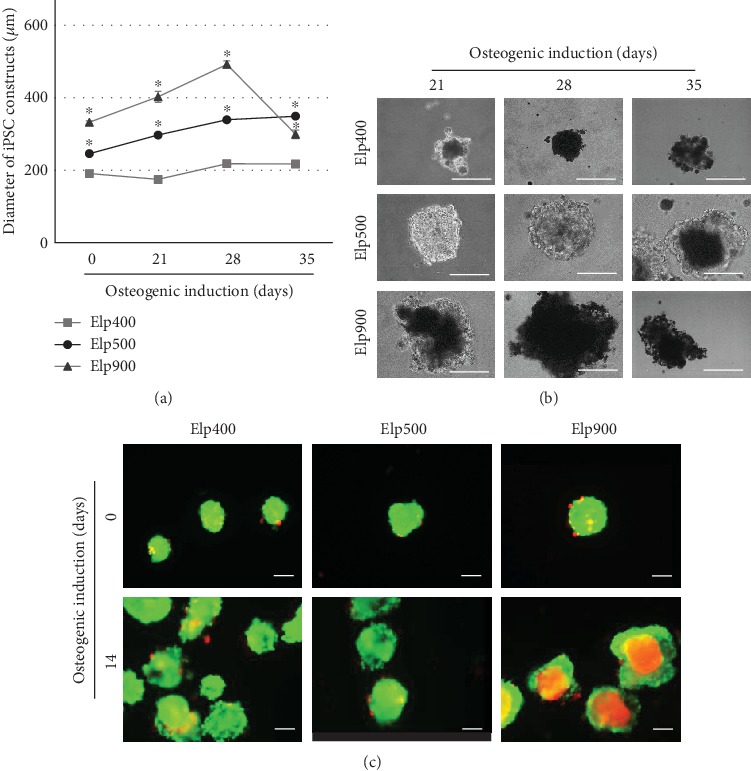
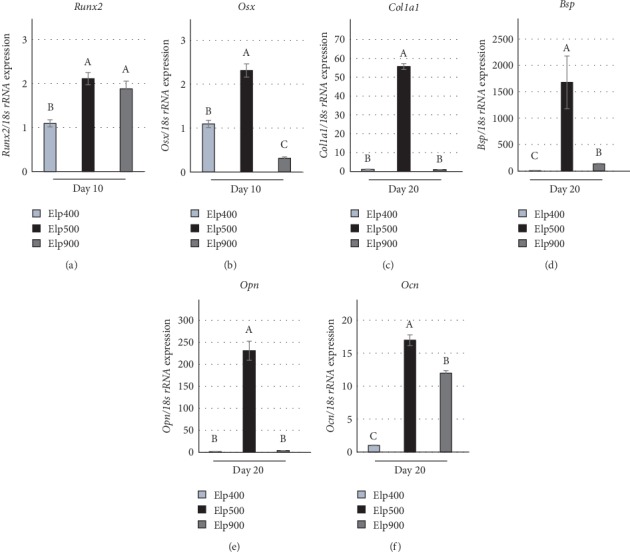
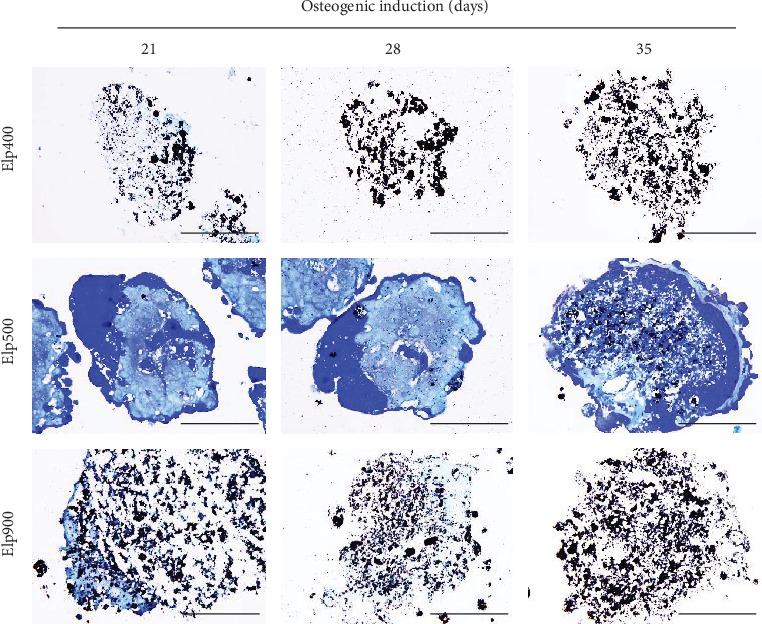
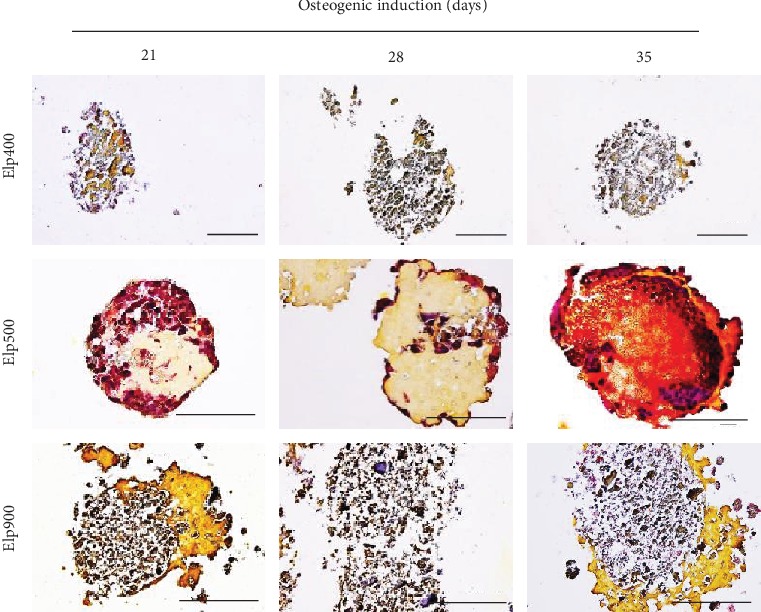
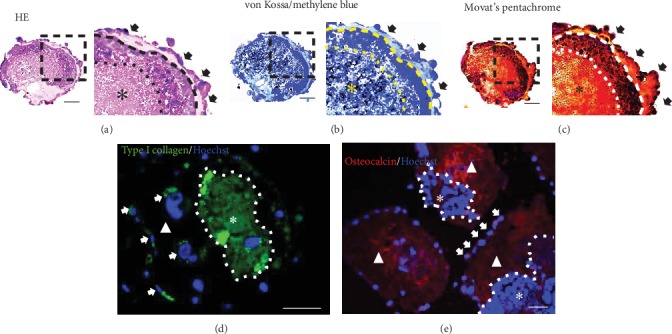
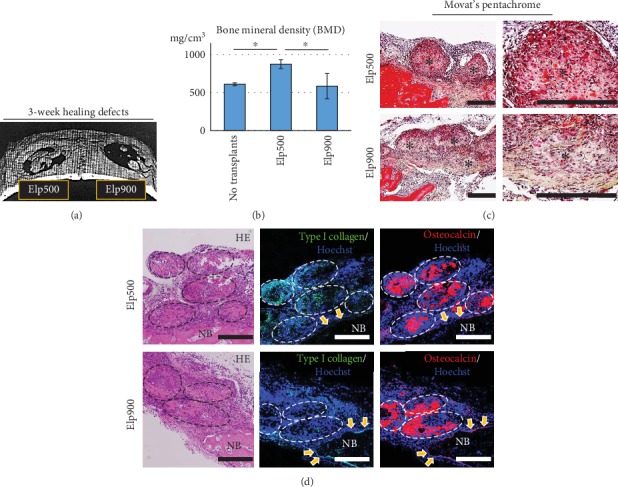
Microspace culture is promising for self-organization of induced pluripotent stem cells (iPSCs). However, the optimal size of microspaces for osteogenic differentiation is unclear. We hypothesized that a specific microspace size could facilitate self-organizing iPSC differentiation to form bone-like tissue in vitro. The objectives of this study were to investigate such effects of microspace size and to evaluate bone regeneration upon transplantation of the resulting osteogenic constructs. Dissociated mouse gingival fibroblast-derived iPSCs were plated in ultra-low-attachment microspace culture wells containing hundreds of U-bottom-shaped microwell spots per well to form cell aggregates in growth medium. The microwells had different aperture diameters/depths (400/560 μm (Elp400), 500/700 μm (Elp500), and 900/700 μm (Elp900)) (Kuraray; Elplasia). After 5 days of aggregation, cells were maintained in osteogenic induction medium for 35 days. Only cells in the Elp500 condition tightly aggregated and maintained high viability during osteogenic induction. After 10 days of induction, Elp500 cell constructs showed significantly higher gene expression of Runx2, Osterix, Collagen 1a1, Osteocalcin, Bone sialoprotein, and Osteopontin compared to constructs in Elp400 and Elp900. In methylene blue-counterstained von Kossa staining and Movat's pentachrome staining, only Elp500 constructs showed robust osteoid formation on day 35, with high expression of type I collagen (a major osteoid component) and osteocalcin proteins. Cell constructs were transplanted into rat calvarial bone defects, and micro-CT analysis after 3 weeks showed better bone repair with significantly higher bone mineral density in the Elp500 group compared to the Elp900 group. These results suggest that microspace size affects self-organized osteogenic differentiation of iPSCs. Elp500 microspace culture specifically induces mouse iPSCs into osteoid-rich bone-like tissue possessing high bone regeneration capacity.


Conflict of interest statement

The authors declare that they have no conflicts of interest.

Figures

Figure 1
Figure 1
Microspace size influences the condensation of iPSC aggregates. (a) Fabrication and osteogenic induction of 3D-iPSC constructs. Representative images of iPSC aggregates were obtained under phrase-contrast microscopy after 2 days of aggregation in Elp400, Elp500, and Elp900. Scale bars: 200 μm. (b) Size measurement of iPSC aggregates using ImageJ software (National Institutes of Health, Bethesda, MD, USA) to analyze Ferret's diameter at culture days 2 and 5. Different letters indicate significant differences between each group (P < 0.05, ANOVA with Tukey's multiple comparison test). The data represent the mean ± SD (n = 3). (c) Cell-cell adhesion marker gene expression with different microspace sizes. E-cadherin expression was determined by quantitative real-time RT-PCR at days 2 and 5. Different letters indicate significant differences between groups (P < 0.05, ANOVA with Tukey's multiple comparison test). The data represent the mean ± SD (n = 3). (d) Representative images of nuclear staining of iPSC aggregates using Hoechst. Scale bars: 200 μm.
Figure 2
Figure 2
Microspace size influences growth rate and viability of OI-iPSC constructs during osteogenic differentiation. (a) Size and growth rate of iPSC constructs during osteogenic induction in different-sized microspaces at days 0, 21, 28, and 35. Asterisks indicate statistically significant difference for Elp500 and Elp900 compared to Elp400 (P < 0.05, ANOVA with Dunnett's multiple comparison test). The data represent the mean ± SD (n = 3). (b) Representative morphological images of OI-iPSC constructs cultured in Elp400, Elp500, and Elp900 at days 21, 28, and 35 after osteogenic initiation. Scale bars: 200 μm. (c) Viability of cells in iPSC constructs before osteogenic induction (day 0) and 14 days after osteogenic commencement (day 14) was demonstrated using the Live/Dead Viability/Cytotoxicity Kit. Scale bars: 200 μm.
Figure 3
Figure 3
Microspace size influences the osteogenic marker gene expression of OI-iPSC constructs. The expression of osteogenic marker genes in Elp400, Elp500, and Elp900 was determined by real-time RT-PCR. (a and b) The gene expression of osteogenic-related transcriptional factors including (a) Runx2 and (b) Osterix (Osx) was determined at day 10 of osteogenic induction. (c–f) After maintenance for 20 days, the expression of bone ECM-related genes-related genes such as (c) Collagen 1a1 (Col1a1), (d) Bone sialoprotein (Bsp), (e) Osteopontin (Opn), and (f) Osteocalcin (Ocn) was evaluated. 18s rRNA expression was used as an internal control. Different letters indicate significant differences between groups (P < 0.05, ANOVA with Tukey's multiple comparison test). The data represent the mean ± SD (n = 3).
Figure 4
Figure 4
Microspace size influences the morphology and mineralization of OI-iPSC constructs. Representative images of histological analysis of OI-iPSC constructs in Elp400, Elp500, and Elp900. Paraffin-embedded sections (without decalcification) of OI-iPSC constructs at days 21, 28, and 35 were stained with von Kossa and counterstained with methylene blue. Black stain indicates mature mineralization. Dark blue and light blue indicate cells and ECM, respectively. Scale bars: 100 μm.
Figure 5
Figure 5
Microspace size influences osteoid formation of OI-iPSC constructs. Histological analysis using Movat's pentachrome staining was performed on paraffin-embedded sections (without decalcification) of OI-iPSC constructs at days 21, 28, and 35. Representative images of OI-iPSC constructs cultured in Elp400, Elp500, and Elp900 are shown. Different colors indicate different components of OI-iPSC constructs: black color for nuclei, red color for cytoplasm/osteoid/coarse collagen fibers, and yellow color for collagen fiber/calcification. Scale bars: 100 μm.
Figure 6
Figure 6
Identification of bone ECM related protein in OI-iPSC constructs cultured for 35 days in Elp500. Histological analysis was performed using HE, methylene blue-counterstained von Kossa, and Movat's pentachrome staining (without decalcification of sections). (a–c) Representative images of OI-iPSC constructs stained with (a) HE, (b) methylene blue-counterstained von Kossa, and (c) Movat's pentachrome. The right panels show magnifications of the dashed square regions. Black arrows indicate the outer cell layer. The inner cell layer is located in between the dashed line and dotted line. The inner ECM is indicated by asterisks. (d and e) Immunofluorescent assessment of (d) type I collagen and (e) osteocalcin in OI-iPSC constructs. The white dotted line separates OI-iPSC constructs into two layers; the outer layer is indicated by triangles and the inner layer is indicated by asterisks. Positive staining of cells for type I collagen and osteocalcin is demonstrated using white arrows. Scale bars: 50 μm.
Figure 7
Figure 7
Comparative bone regeneration capacity of OI-iPSC constructs fabricated using Elp500 and Elp900 in critical-size calvarial defects. After healing for 3 weeks, new bone formation was evaluated using micro-CT and histological and immunofluorescent staining. (a) Representative 3D reconstruction image from micro-CT showing new bone formation in the defect area. (b) New bone formation was quantitatively analyzed by bone morphometry. Asterisks indicate statistically significant differences (P < 0.05, ANOVA with Tukey's multiple comparison test). The data represent the mean ± SD (n = 4). (c) Movat's pentachrome staining of decalcified sections of a defect after healing for 3 weeks. Right panels show magnifications of the OI-iPSC constructs of the left panels. Asterisks indicate the constructs. Scale bars: 200 μm. (d) Immunofluorescent analysis of type I collagen and osteocalcin in remaining OI-iPSC constructs. The dashed oval regions show the remaining OI-iPSC constructs. Yellow arrows indicate osteoblasts lining the new bone (NB) area. Scale bars: 200 μm.

Similar articles

Cited by

References

    1. Egusa H., Sonoyama W., Nishimura M., Atsuta I., Akiyama K. Stem cells in dentistry—part I: stem cell sources. Journal of Prosthodontic Research. 2012;56(3):151–165. doi: 10.1016/j.jpor.2012.06.001. - DOI - PubMed
    1. Yamada M., Egusa H. Current bone substitutes for implant dentistry. Journal of Prosthodontic Research. 2018;62(2):152–161. doi: 10.1016/j.jpor.2017.08.010. - DOI - PubMed
    1. Amini A. R., Laurencin C. T., Nukavarapu S. P. Bone tissue engineering: recent advances and challenges. Critical Reviews in Biomedical Engineering. 2012;40(5):363–408. doi: 10.1615/CritRevBiomedEng.v40.i5.10. - DOI - PMC - PubMed
    1. Egusa H., Sonoyama W., Nishimura M., Atsuta I., Akiyama K. Stem cells in dentistry—part II: clinical applications. Journal of Prosthodontic Research. 2012;56(4):229–248. doi: 10.1016/j.jpor.2012.10.001. - DOI - PubMed
    1. O'Brien F. J. Biomaterials & scaffolds for tissue engineering. Materials Today. 2011;14(3):88–95. doi: 10.1016/S1369-7021(11)70058-X. - DOI