

Prediction of therapeutic outcome and survival in a transgenic mouse model of pancreatic ductal adenocarcinoma treated with dendritic cell vaccination or CDK inhibitor using MRI texture: a feasibility study
- PMID: 32509212
- PMCID: PMC7270001
Prediction of therapeutic outcome and survival in a transgenic mouse model of pancreatic ductal adenocarcinoma treated with dendritic cell vaccination or CDK inhibitor using MRI texture: a feasibility study
Abstract
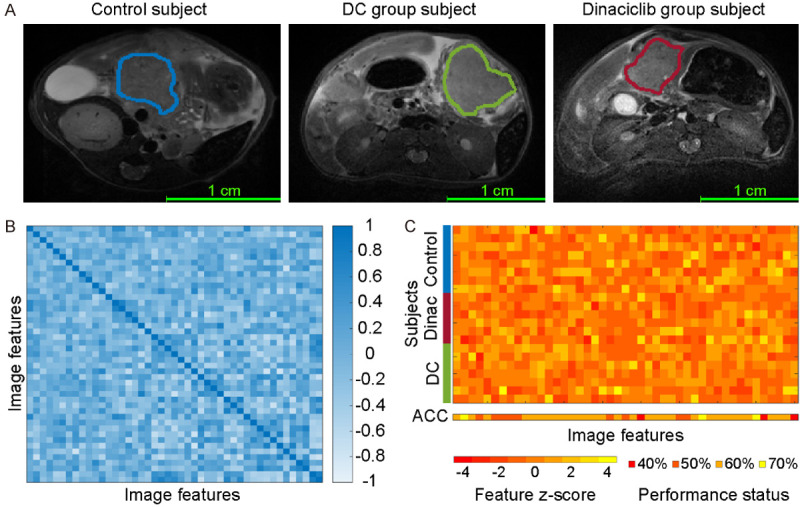
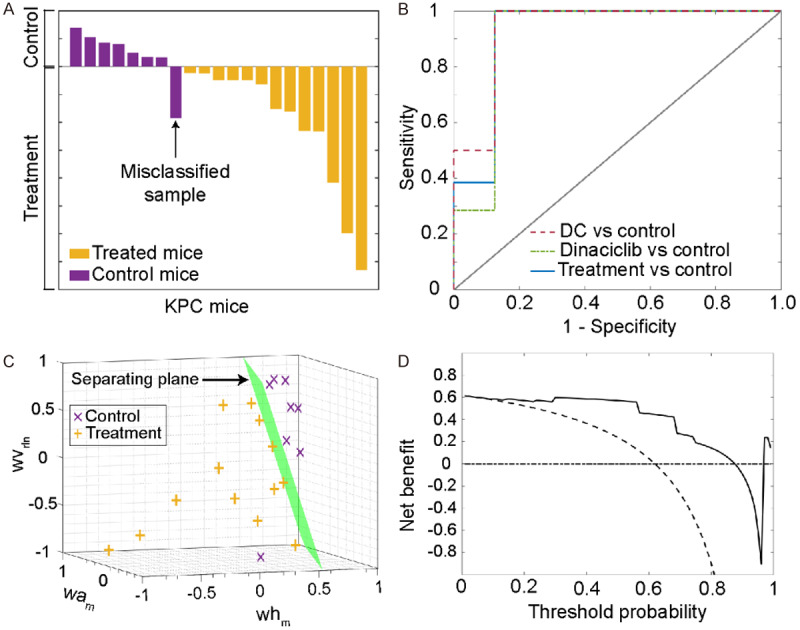
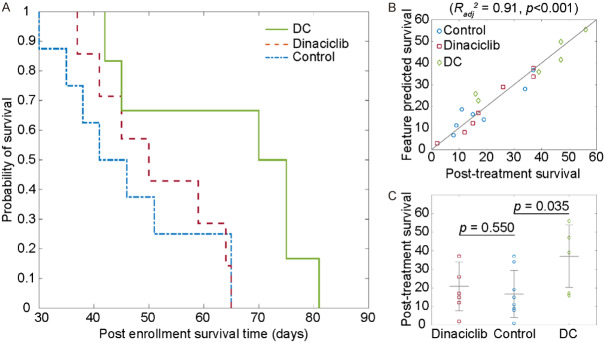
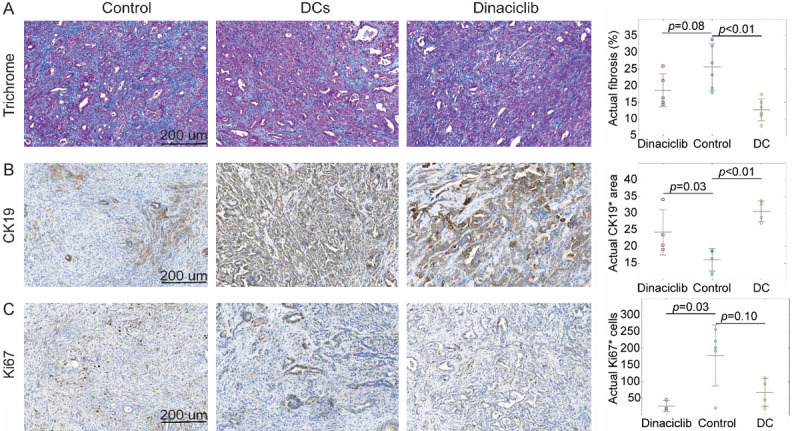
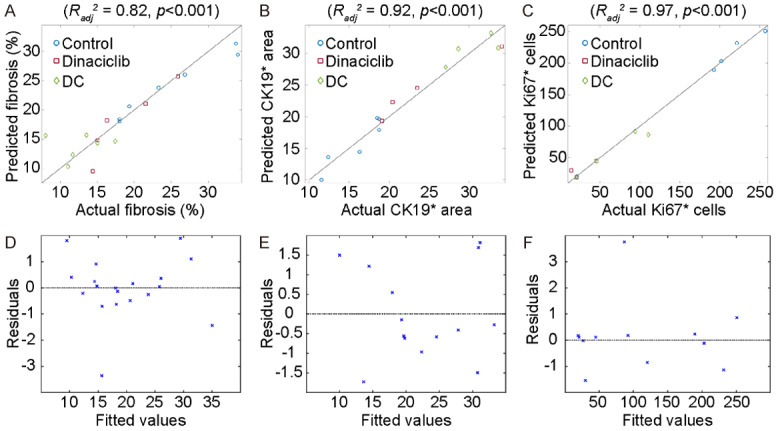
There is a lack of a well-established approach for assessment of early treatment outcomes for modern therapies for pancreatic ductal adenocarcinoma (PDAC) e.g. dinaciclib or dendritic cell (DC) vaccination. Here, we developed multivariate models using MRI texture features to detect treatment effects following dinaciclib drug or DC vaccine therapy in a transgenic mouse model of PDAC including 21 LSL-KrasG12D ; LSL-Trp53R172H ; Pdx-1-Cre (KPC) mice used as untreated control subjects (n=8) or treated with dinaciclib (n=7) or DC vaccine (n=6). Support vector machines (SVM) technique was performed to build a linear classifier with three variables for detection of tumor tissue changes following drug or vaccine treatments. Besides, multivariate regression models were generated with five variables to predict survival behavior and histopathological tumor markers (Fibrosis, CK19, and Ki67). The diagnostic performance was evaluated using accuracy, area under the receiver operating characteristic curve (AUC) and decision curve analyses. The regression models were evaluated with adjusted r-squared (Radj 2). SVM classifier successfully distinguished changes in tumor tissue with an accuracy of 95.24% and AUC of 0.93. The multivariate models generated with five variables were strongly associated with histopathological tumor markers, fibrosis (Radj 2=0.82, P<0.001), CK19 (Radj 2=0.92, P<0.001) and Ki67 (Radj 2=0.97, P<0.001). Furthermore, the multivariate regression model successfully predicted survival of KPC mice by interpreting tumor characteristics from MRI data (Radj 2=0.91, P<0.001). The results demonstrated that MRI texture features had great potential to generate diagnosis and prognosis models for monitoring early treatment response following dinaciclib drug or DC vaccine treatment and also predicting histopathological tumor markers and long-term clinical outcomes.
Keywords: Dendritic cell vaccine; dinaciclib; machine learning; magnetic resonance imaging; pancreatic ductal adenocarcinoma; texture analysis.
AJTR Copyright © 2020.
Conflict of interest statement
None.
Figures
Similar articles
-
MRI radiomics for early prediction of response to vaccine therapy in a transgenic mouse model of pancreatic ductal adenocarcinoma.J Transl Med. 2020 Feb 10;18(1):61. doi: 10.1186/s12967-020-02246-7. J Transl Med. 2020. PMID: 32039734 Free PMC article.
-
Detection of Immunotherapeutic Response in a Transgenic Mouse Model of Pancreatic Ductal Adenocarcinoma Using Multiparametric MRI Radiomics: A Preliminary Investigation.Acad Radiol. 2021 Jun;28(6):e147-e154. doi: 10.1016/j.acra.2020.04.026. Epub 2020 Jun 2. Acad Radiol. 2021. PMID: 32499156 Free PMC article.
-
Dinaciclib prolongs survival in the LSL-KrasG12D/+ ; LSL-Trp53R172H/+ ; Pdx-1-Cre (KPC) transgenic murine models of pancreatic ductal adenocarcinoma.Am J Transl Res. 2020 Mar 15;12(3):1031-1043. eCollection 2020. Am J Transl Res. 2020. PMID: 32269732 Free PMC article.
-
Non-invasive dynamic monitoring initiation and growth of pancreatic tumor in the LSL-KrasG12D/+;LSL-Trp53R172H/+;Pdx-1-Cre (KPC) transgenic mouse model.J Immunol Methods. 2019 Feb;465:1-6. doi: 10.1016/j.jim.2018.11.009. Epub 2018 Nov 20. J Immunol Methods. 2019. PMID: 30468734
-
Differences between KC and KPC pancreatic ductal adenocarcinoma mice models, in terms of their modeling biology and their clinical relevance.Pancreatology. 2020 Jan;20(1):79-88. doi: 10.1016/j.pan.2019.11.006. Epub 2019 Nov 18. Pancreatology. 2020. PMID: 31780287 Review.
Cited by
-
Early assessment of irreversible electroporation ablation outcomes by analyzing MRI texture: preclinical study in an animal model of liver tumor.Am J Transl Res. 2022 Aug 15;14(8):5541-5551. eCollection 2022. Am J Transl Res. 2022. PMID: 36105031 Free PMC article.
-
Dendritic cell vaccination combined with irreversible electroporation for treating pancreatic cancer-a narrative review.Ann Transl Med. 2024 Aug 1;12(4):77. doi: 10.21037/atm-23-1882. Epub 2024 May 28. Ann Transl Med. 2024. PMID: 39118942 Free PMC article. Review.
-
Early Differentiation of Irreversible Electroporation Ablation Regions With Radiomics Features of Conventional MRI.Acad Radiol. 2022 Sep;29(9):1378-1386. doi: 10.1016/j.acra.2021.11.020. Epub 2021 Dec 18. Acad Radiol. 2022. PMID: 34933803 Free PMC article.
References
-
- Bray F, Ferlay J, Soerjomataram I, Siegel RL, Torre LA, Jemal A. Global cancer statistics 2018: GLOBOCAN estimates of incidence and mortality worldwide for 36 cancers in 185 countries. CA Cancer J Clin. 2018;68:394–424. - PubMed
-
- Kamisawa T, Wood LD, Itoi T, Takaori K. Pancreatic cancer. Lancet. 2016;388:73–85. - PubMed
Grants and funding
LinkOut - more resources
Full Text Sources
Molecular Biology Databases
Research Materials
Miscellaneous