

LINC00152 promotes pancreatic cancer cell proliferation, migration and invasion via targeting miR-150
- PMID: 32509216
- PMCID: PMC7269995
LINC00152 promotes pancreatic cancer cell proliferation, migration and invasion via targeting miR-150
Abstract
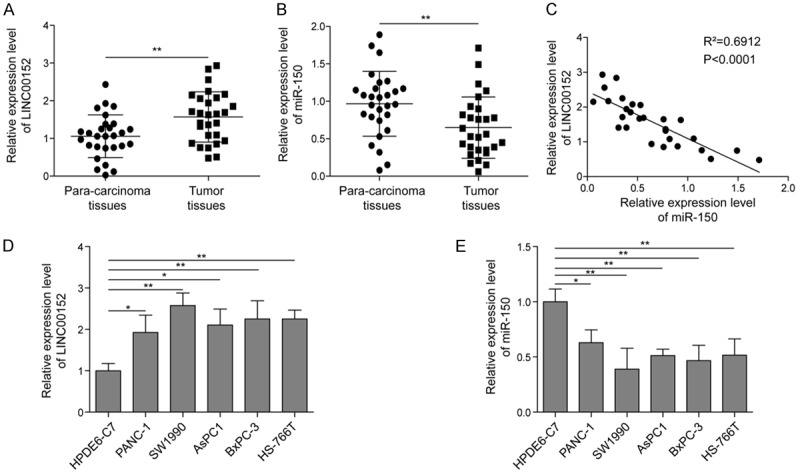
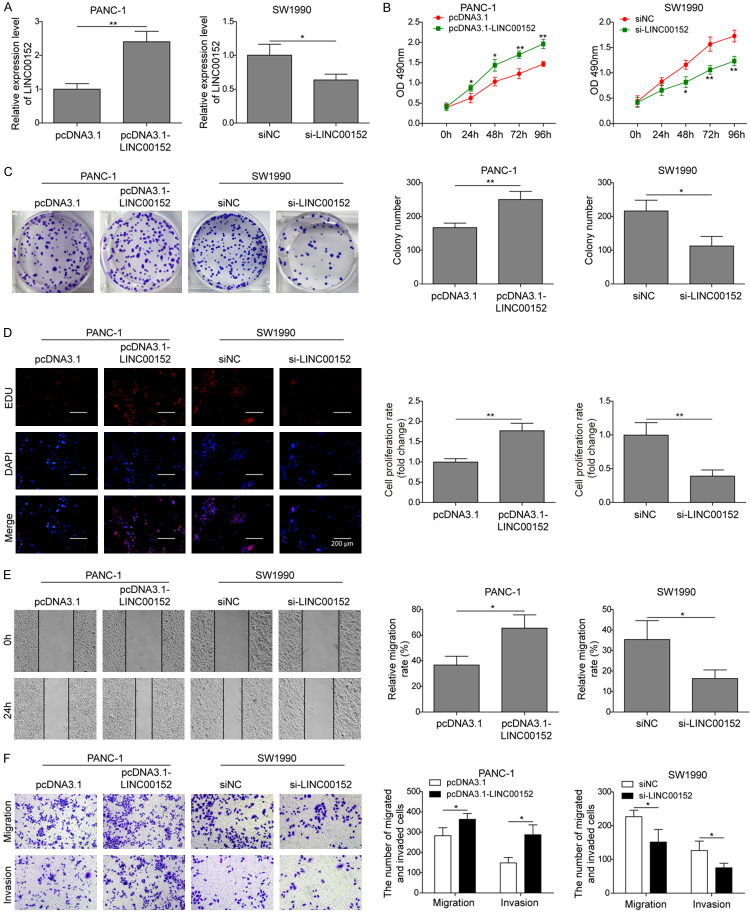
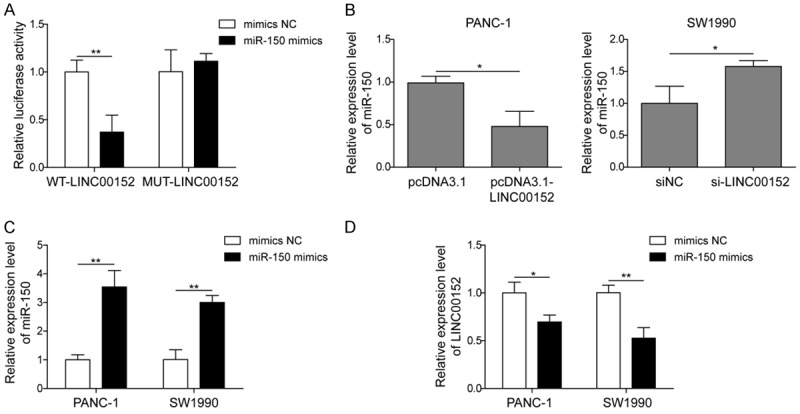
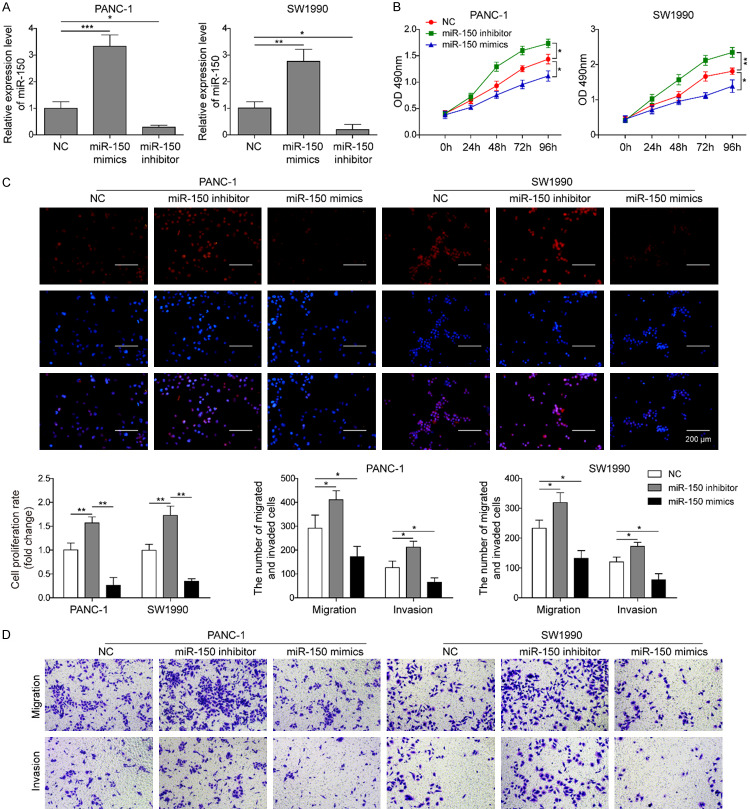
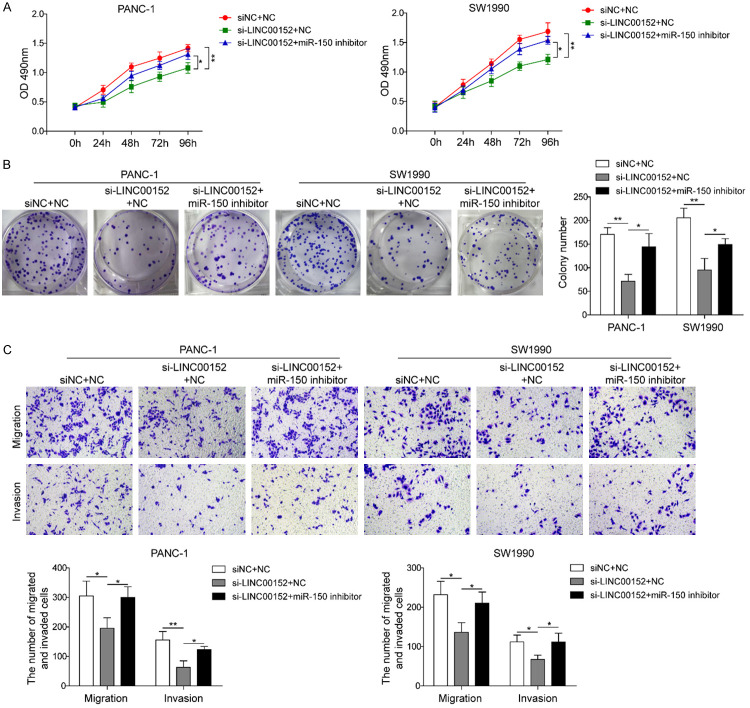
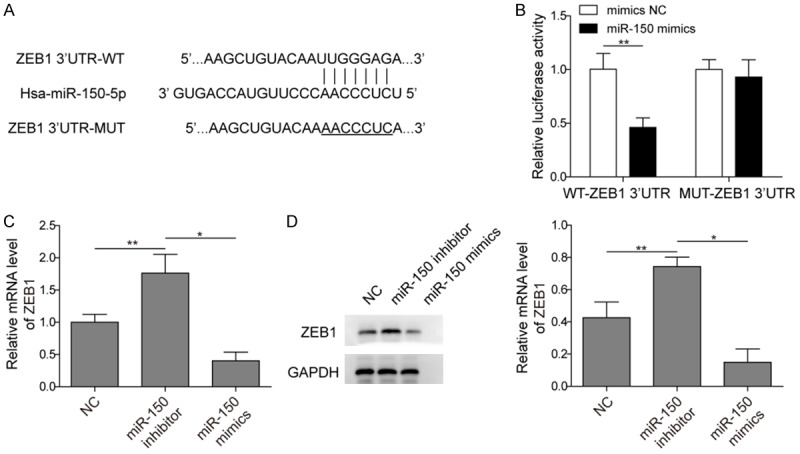
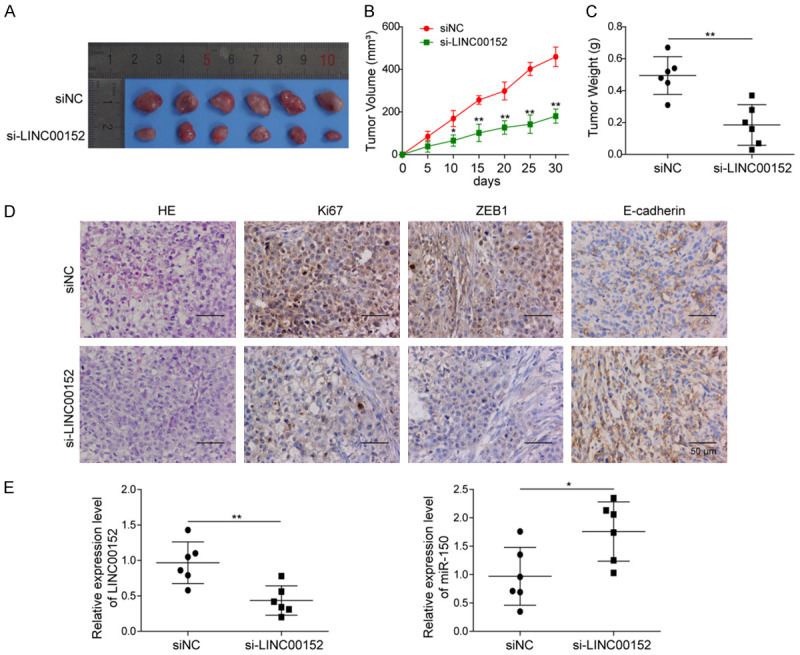
Pancreatic cancer (PC) is one of the top deaths causing cancers with low 5-year survival rate. Long non-coding RNAs (lncRNAs) are recognized as a crucial type of nonprotein-coding transcripts implicated in tumorigenesis. Emerging evidence has implied that LINC00152 exerts the potential oncogenic functions in various cancers. Nevertheless, the role of LINC00152 in PC remains elusive. In the present study, we found that LINC00152 was significantly up-regulated while miR-150 was down-regulated both in tissues and cell lines of PC, indicating their negative correlation in PC progression. Functionally, overexpression of LINC00152 promoted cell proliferation, migration and invasion, while LINC00152 knockdown reversed these effects. Mechanistic experiments reveal that miR-150 acted as a target of LINC00152 confirmed by luciferase reporter assay. Moreover, inhibition of miR-150 could markedly attenuate the suppression of cell proliferation, migration and invasion by knocking down LINC00152. Altogether, our findings concluded that LINC00152 facilitated PC progression through inhibiting miR-150 expression, indicating an innovative therapeutic target for PC.
Keywords: LINC00152; miR-150; pancreatic cancer.
AJTR Copyright © 2020.
Conflict of interest statement
None.
Figures
Similar articles
-
Long Intergenic Noncoding RNA 00152 Promotes Glioma Cell Proliferation and Invasion by Interacting with MiR-16.Cell Physiol Biochem. 2018;46(3):1055-1064. doi: 10.1159/000488836. Epub 2018 Apr 13. Cell Physiol Biochem. 2018. PMID: 29669323
-
Long Intergenic Nonprotein Coding RNA 0152 Promotes Hepatocellular Carcinoma Progression by Regulating Phosphatidylinositol 3-Kinase/Akt/Mammalian Target of Rapamycin Signaling Pathway through miR-139/PIK3CA.Am J Pathol. 2020 May;190(5):1095-1107. doi: 10.1016/j.ajpath.2019.11.010. Epub 2020 Jan 16. Am J Pathol. 2020. PMID: 31954697
-
Long Non-Coding RNA LINC00152 Regulates Cell Proliferation, Migration And Invasion In Esophageal Squamous Cell Carcinoma Via miR-107/Rab10 Axis.Onco Targets Ther. 2019 Oct 17;12:8553-8567. doi: 10.2147/OTT.S221515. eCollection 2019. Onco Targets Ther. 2019. PMID: 31802892 Free PMC article.
-
LINC00152: A pivotal oncogenic long non-coding RNA in human cancers.Cell Prolif. 2017 Aug;50(4):e12349. doi: 10.1111/cpr.12349. Epub 2017 May 2. Cell Prolif. 2017. PMID: 28464433 Free PMC article. Review.
-
Long non-coding RNA LINC00152 in cancer: Roles, mechanisms, and chemotherapy and radiotherapy resistance.Front Oncol. 2022 Aug 10;12:960193. doi: 10.3389/fonc.2022.960193. eCollection 2022. Front Oncol. 2022. PMID: 36033524 Free PMC article. Review.
Cited by
-
Non-Coding RNA Signatures of B-Cell Acute Lymphoblastic Leukemia.Int J Mol Sci. 2021 Mar 7;22(5):2683. doi: 10.3390/ijms22052683. Int J Mol Sci. 2021. PMID: 33799946 Free PMC article. Review.
-
Integrated analysis of immune- and apoptosis-related lncRNA-miRNA-mRNA regulatory network in children with Henoch Schönlein purpura nephritis.Transl Pediatr. 2022 Oct;11(10):1682-1696. doi: 10.21037/tp-22-437. Transl Pediatr. 2022. PMID: 36345450 Free PMC article.
-
Exosomal LINC00460/miR-503-5p/ANLN positive feedback loop aggravates pancreatic cancer progression through regulating T cell-mediated cytotoxicity and PD-1 checkpoint.Cancer Cell Int. 2022 Dec 8;22(1):390. doi: 10.1186/s12935-022-02741-5. Cancer Cell Int. 2022. PMID: 36482354 Free PMC article.
-
Role of long intergenic non-protein coding RNA 00152 in pancreatic cancer glycolysis via the manipulation of the microRNA-185-5p/Krüppel-like factor 7 axis.J Cancer. 2021 Aug 28;12(21):6330-6343. doi: 10.7150/jca.63128. eCollection 2021. J Cancer. 2021. PMID: 34659523 Free PMC article.
-
Non-coding RNAs in pancreatic ductal adenocarcinoma: New approaches for better diagnosis and therapy.Transl Oncol. 2021 Jul;14(7):101090. doi: 10.1016/j.tranon.2021.101090. Epub 2021 Apr 5. Transl Oncol. 2021. PMID: 33831655 Free PMC article. Review.
References
-
- Siegel RL, Miller KD, Jemal A. Cancer statistics, 2018. CA Cancer J Clin. 2018;68:7–30. - PubMed
-
- Chen W, Zheng R, Baade PD, Zhang S, Zeng H, Bray F, Jemal A, Yu XQ, He J. Cancer statistics in China, 2015. CA Cancer J Clin. 2016;66:115–132. - PubMed
-
- Ferlay J, Soerjomataram I, Dikshit R, Eser S, Mathers C, Rebelo M, Parkin DM, Forman D, Bray F. Cancer incidence and mortality worldwide: sources, methods and major patterns in GLOBOCAN 2012. Int J Cancer. 2015;136:E359–386. - PubMed
-
- Nagano T, Fraser P. No-nonsense functions for long noncoding RNAs. Cell. 2011;145:178–181. - PubMed
LinkOut - more resources
Full Text Sources