

Trends in response rates and respondent characteristics in five National Maternity Surveys in England during 1995-2018
- PMID: 32509303
- PMCID: PMC7249643
- DOI: 10.1186/s13690-020-00427-w
Trends in response rates and respondent characteristics in five National Maternity Surveys in England during 1995-2018
Abstract
Background: The National Perinatal Epidemiology Unit in England has conducted five National Maternity Surveys (NMS) at varying intervals since 1995. This paper aims to describe the changes in NMS response rates over time and to compare the demographic characteristics of respondents to each NMS.
Methods: This paper is based on secondary data analysis of the NMS (cross-sectional postal surveys) from 1995 to 2018. All women aged 16 years and over who gave birth in England (and Wales in 1995) during specified time periods from 1995 to 2018 were eligible to be selected. For each survey, between 3570 and 16,000 women who were 3-6 months postpartum were selected at random by the Office for National Statistics, using birth registrations. Women could participate on paper, by telephone (from 2006) or online (from 2010).
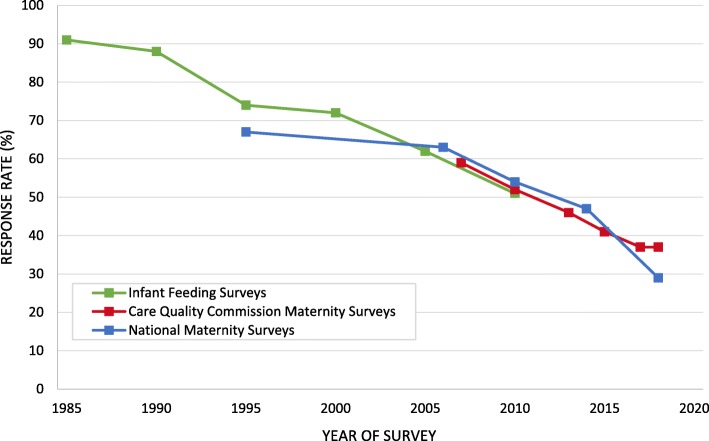
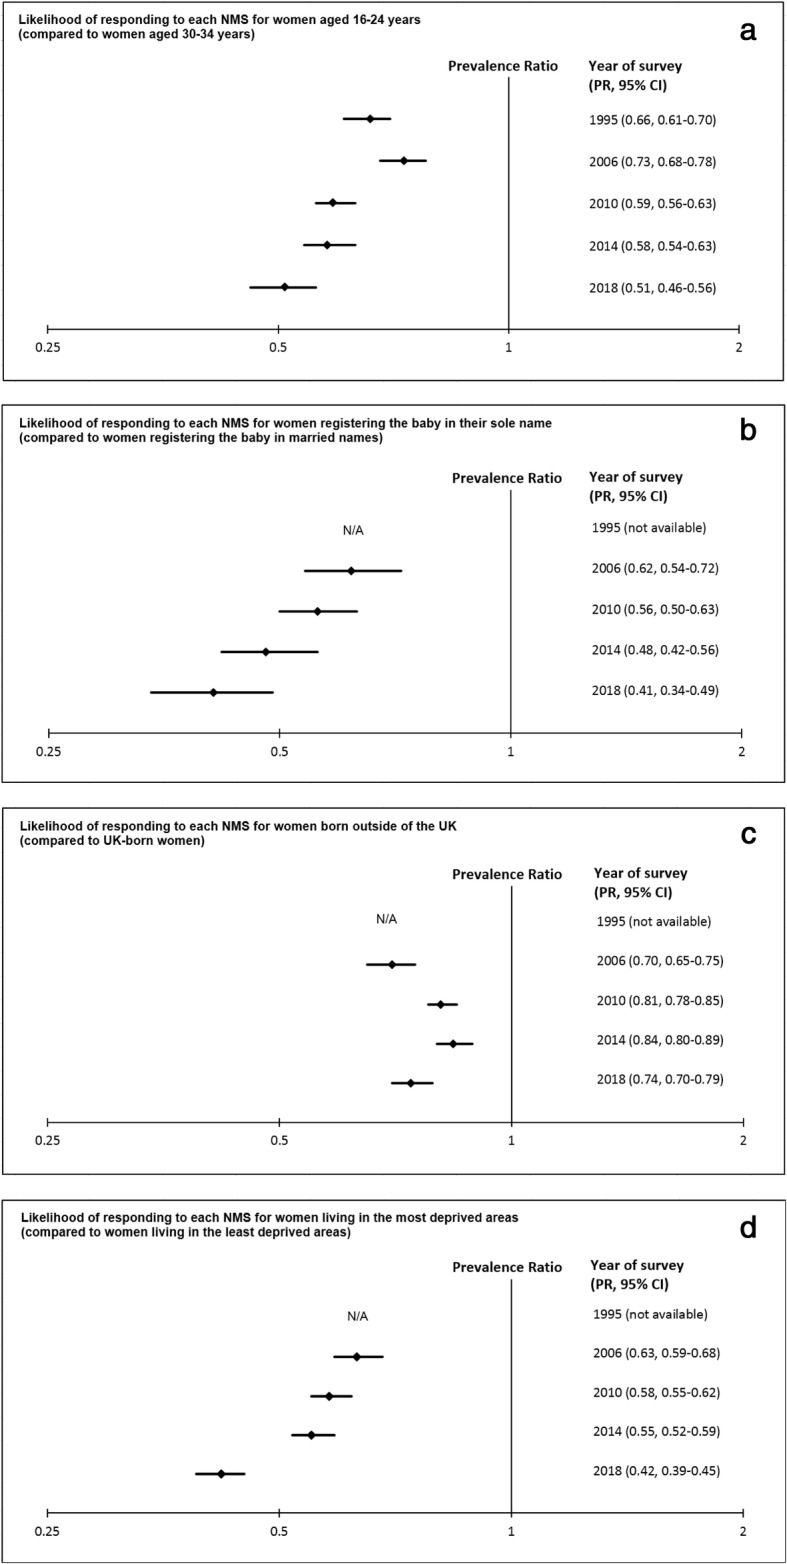
Results: The response rate to the NMS decreased from 67% in 1995 to 29% in 2018. The decline was evident across demographic groups. In all NMS, response rates were higher in women who were older (crude prevalence ratios (PR) for 16-24 years versus 30-34 years = 0.51-0.73 (across surveys)), married (crude PR for sole versus married registrants = 0.41-0.62), born in the UK (crude PR for non UK-born versus UK-born = 0.70-0.84), and living in less deprived areas (crude PR for least versus most deprived = 0.42-0.63). However, the association between each demographic characteristic and response varied across surveys, with the youngest women, women who registered the birth of the baby in their sole name, and women living in the most deprived areas becoming relatively less likely to respond over time. In multivariable analysis in 2014 and 2018, the effects of age, marital status, country of birth and level of area deprivation on response were attenuated but all four demographic characteristics remained statistically significantly associated with response.
Conclusions: Response rates to the NMS have declined significantly during the last 23 years. The demographic characteristics associated with response were consistent across surveys, but the size of the effect varied significantly, with underrepresented groups becoming relatively less likely to participate over time. It is important to find strategies to increase response rates, particularly amongst underrepresented groups, and to validate the data collected.
Keywords: Maternity survey; Survey response rate.
© The Author(s) 2020.
Conflict of interest statement
Competing interestsThe authors have no competing interests to declare.
Figures
References
-
- Fuller E, Mindell J, Prior G. Health survey for England 2017. London: NHS Digital; 2018.
-
- NHS England. GP Patient Survey: surveys and reports. NHS England; 2018. Available from: http://www.gp-patient.co.uk/surveysandreports. Accessed 18 October 2019.
-
- Care Quality Commission. Maternity service surveys. Available from: https://www.cqc.org.uk/publications/surveys/maternity-services-survey-2018. Accessed 18 October 2019.
-
- Dillman DA, Smyth JD, Christian LM. Internet, phone, mail, and mixed-mode surveys: the tailored design method. 4. New Jersey: John Wiley & Sons; 2014.
LinkOut - more resources
Full Text Sources
Research Materials
