. 2020 May 1;10(5):1321-1343.
eCollection 2020.

Prolactin and androgen R1881 induce pro-survival carboxypeptidase-D and EDD E3 ligase in triple-negative and HER2+ breast cancer

Affiliations

Prolactin and androgen R1881 induce pro-survival carboxypeptidase-D and EDD E3 ligase in triple-negative and HER2+ breast cancer

Tyler M MacDonald et al. Am J Cancer Res. .

Abstract

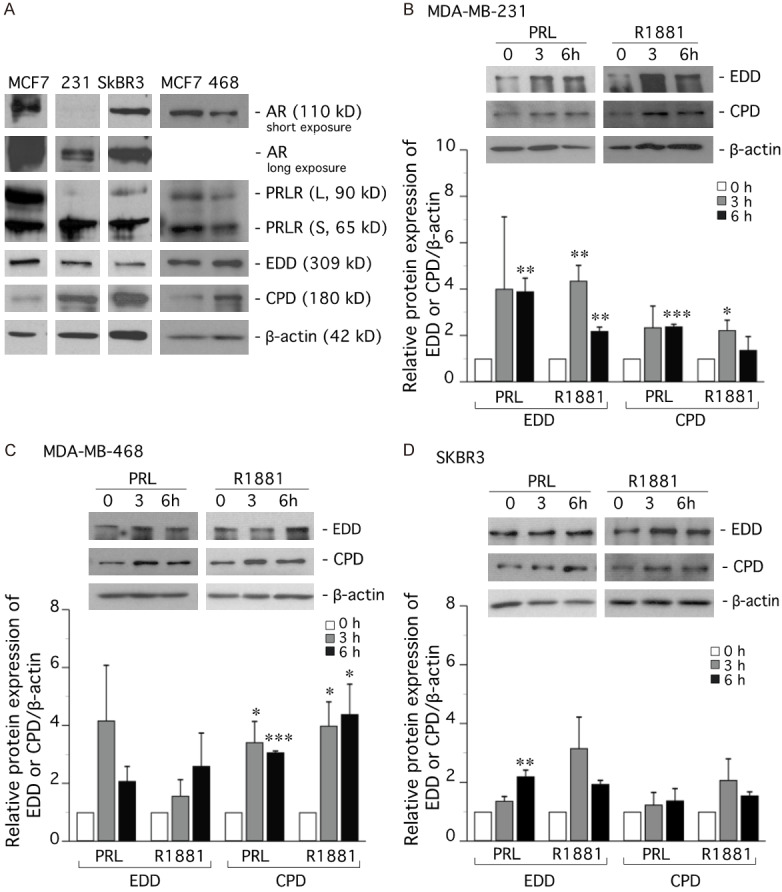
Plasma membrane carboxypeptidase-D (CPD) hydrolyzes C-terminal arginine (Arg) from extracellular substrates, and Arg is converted into nitric oxide (NO) in the cell. CPD is upregulated by prolactin (PRL) and androgens in breast cancer (BCa) cells, increasing NO production to promote cell survival. EDD E3 ubiquitin ligase, upregulated by PRL/androgens, is implicated in TORC1 signaling. This study investigated CPD and EDD in triple-negative (TNBC) and HER2+ BCa. Kaplan-Meier analysis showed a negative correlation between CPD or EDD mRNA expression in TNBC patients and relapse-free survival. Immunohistochemistry showed that benign and malignant breast tissues stained abundantly for the PRL receptor (PRLR) and androgen receptor (AR). CPD and EDD staining were elevated in TNBC and HER2+ tumors as compared to benign tissues. In TNBC/HER2+ cell lines, CPD and EDD protein expression were upregulated by PRL or synthetic androgen methyltrienolone (R1881) at 3-6 h. PRL/R1881-induced CPD in TNBC and HER2+ cells increased intracellular NO production, which was abolished by PRLR antagonist ∆1-9-G129R-hPRL and AR antagonist flutamide. In turn, treatment with NO increased viability and decreased apoptosis in Arg-deprived TNBC cells. Cell viability and apoptosis were also affected in HER2+ cells with CPD knockdown. Lastly, EDD knockdown decreased PRL/R1881-induced phosphorylation of initiation factor 4E binding protein-1 and decreased 4E release in TNBC cells. In summary, PRL/R1881-induced CPD promotes TNBC/HER2+ cell survival through production of NO, and EDD promotes TNBC cell survival by TORC1 activation. This study implicates CPD and EDD as useful therapeutic targets for TNBC/HER2+ tumors, and suggests that PRLR and AR blockade are also beneficial to these patients.

Keywords: EDD E3 ligase; Prolactin; androgen; breast cancer; carboxypeptidase-D; cell survival.


Conflict of interest statement

None.

Figures

Figure 1
Figure 1
Kaplan-Meier Plots: prognostic value of CPD or EDD mRNA expression in TNBC patients. (A, B) KM plots were obtained from online database (http://kmplot.com/analysis/) to show the impact of CPD or EDD mRNA expression on relapse-free survival in TNBC patients. Survival curves for (A) CPD (Affymetrix ID: 201941_) in basal-like patients (n=618) or (B) EDD (UBR5), Affymetrix ID: 208882_s_, in basal-like (high-grade 3) patients (n=293). Patient samples were bifurcated by the median into low (black) and high (red) expression groups for each gene. Survival hazard ratio, 95% confidence intervals, and log rank P were displayed on the webpage. P value of <0.05 was considered statistically significant.
Figure 2
Figure 2
IHC: AR staining is high in benign and malignant breast tissues. FFPE high-grade (HG; grade-3, regardless of receptor status), TNBC, HER2+ tumors or matched benign breast tissues were sectioned at 5 µm and used in IHC analysis for AR levels and distribution (see Materials and Methods). A. Representative AR staining in benign breast tissue, HG, TNBC and HER2+ tumors. B. Graph depicts AR staining area as a % of total area; mean ± SEM, along with individual data points. Red dot indicates a grade-2 TNBC sample. n = number of specimens for each group.
Figure 3
Figure 3
PRLR and phospho-Stat5 stainings are high in benign and malignant breast tissues. A. Comparison of anti-PRLR antibodies H-300 and D-7. Three different FFPE BCa tumors were cut and near-adjacent sections from each were immunostained for PRLR, using either rabbit polyclonal H-300 or its replacement mouse monoclonal clone D-7, each raised to the same epitope in the hPRLR (see Materials and Methods). B, C. As in Figure 2, FFPE breast tissues were used in IHC analysis for phospho-Stat5. Some near-adjacent sections were also stained for PRLR, using anti-PRLR H-300 antibody. B. Representative phospho-Stat5 and PRLR immunostaining as indicated. C. Graph depicts phospho-Stat5 staining as a % of total area; mean ± SEM. Red dot indicates a grade-2 TNBC sample. *, significantly higher (P<0.05) staining in HER2+ tissues than in benign. #, significantly higher (P<0.05) staining in HER2+ than in HG tissues.
Figure 4
Figure 4
CPD staining is high in TNBC and HER2+ BCa. As in Figure 2, FFPE breast tissues were used in IHC analysis for CPD. A. Representative CPD staining as indicated. B. Graph depicts CPD staining area as a % of total area; mean ± SEM. Red dot indicates a grade-2 TNBC sample. * significantly higher (P<0.05) staining in all BCa tissues than benign tissues. C. CPD co-localized with nitrotyrosine (NT) staining. Adjacent sections of FFPE high-grade TNBC and HER2+ tumors were immunostained for CPD or NT. Closed black arrows: areas with intense staining for both CPD and NT. Open black arrows: areas with weak staining for both.
Figure 5
Figure 5
EDD staining is high in TNBC and HER2+ BCa. As in Figure 2, FFPE breast tissues were used in IHC analysis for EDD. A. Representative EDD staining as indicated. B. Graph depicts EDD staining levels as a % of total area; mean ± SEM. Red dot indicates a grade-2 TNBC sample. * significantly higher (P<0.05) staining in all BCa tissues than benign tissues.
Figure 6
Figure 6
PRL and R1881 upregulate CPD and EDD in TNBC and HER-2-enriched cell lines. (A) Western analysis of PRLR (long and short forms), AR, CPD and EDD in TNBC (MDA-MB-231, MDA-MB-468) and HER2-enriched (SKBR3) cell lines. (B) MDA-MB-231, (C) MDA-MB-468, and (D) SKBR3 cells were made quiescent in DMEM supplemented with 1% charcoal-stripped FBS (charcoal removed steroids and PRL). After 24 h, the cells were treated with PRL (10 ng/ml) or R1881 (10 nM) for 3 or 6 h. Cell lysates were subjected to Western analysis and representative blots are displayed. Graphs show EDD and CPD expression as mean ± SEM of at least three independent experiments. *P<0.05 ; **P<0.01 ; ***P<0.001, compared to 0 h control.
Figure 7
Figure 7
PRL/R1881 increase CPD-mediated NO production in TNBC and HER2-enriched cells. Quiescent MDA-MB-231 (A, B), MDA-MB468 (C), and SKBR3 (D) cells were cultured in Arg-free DMEM for 48 h. To the culture medium was then added PRL (20 ng/ml), R1881 (10 nM) or PRL+R1881 in combination for 2-3 h. Some cells were pre-treated with the receptor antagonists ∆1-9-129R-hPRL (∆1-9; 40 ng/ml) and/or flutamide (Flu; 20 mM) 15 min prior to adding hormones. Cells were then assayed for intracellular NO production using the DAF-2T assay (see Materials and Methods). (A) representative DIC and fluorescence microscopy images for MDA-MB-231 cells. (B-D) Intracellular DAF-2T fluorescence intensity was quantified using (B, C) CellProfiler or (D) manual counting of fluorescent cells followed by confirmation with CellProfiler. Fluorescent image data was normalized to the FAR control. Mean ± SEM (n=3-9). *P<0.01, **P<0.001.
Figure 8
Figure 8
Loss of CPD decreases TNBC cell viability. NO increases viability and decreases apoptosis. A, B. TNBC MDA-MB-231 and MDA-MB-468 cells were transfected with two sets of siRNA targeting CPD (siCPD1, siCPD2) or two sets of non-targeting siRNA (siNT1, siNT2) or left untransfected (Con). The day of transfection was designated Day 0. RNA was collected on Days 2, 3 and 4. A. RT-qPCR was used to measure CPD and β-actin mRNA expression. B. Cell viability was assessed by trypan blue cell counting. Data was normalized to the untransfected controls. Mean ± SEM of at least 3 independent experiments. **P<0.01, ***P<0.001, compared to siNT1-transfected cells. C. MDA-MB-231 and MDA-MB-468 cells, cultured in Arg-free medium containing 5% heat-inactivated, charcoal-stripped FBS for 24 h, were treated with increasing concentrations of DETA-NONOate. Cell viability was assessed by trypan blue cell counting after 3 days. Mean ± SEM (n=4). ***P<0.001 compared to control. D. MDA-MB-231 cells, in Arg-free medium plus 5% heat-inactivated, charcoal-stripped FBS for 48 h were treated ± PRL and ± FAR, then stained with Annexin V/PI for flow cytometry (see Materials and Methods). Cells undergoing apoptosis (both early and late) were plotted. Mean ± SEM (n=3). ***P<0.001.
Figure 9
Figure 9
Loss of CPD decreases viability and increases apoptosis of HER2-enriched cells. SKBR3 cells were transfected with siRNA targeting CPD (siCPD1 or siCPD2), non-targeting siRNA (siNT1) or left untransfected (Con). The cells were harvested on the days indicated to confirm CPD gene knockdown using (A) semi-quantitative RT-PCR or (B) Western analysis, with the CPD/b-actin ratio indicated in each case. (C) On days 2-6 post-transfection, live cells were counted with trypan blue (left panel), and cell counts on days 4 and 5 were replotted to clearly show statistical significance (right panel). Mean ± SEM (n=4). *P<0.05, **P<0.01. (D) SKBR3 cells were transfected with CPD-targeting siCPD2 or non-targeting siNT1 or left untransfected (Con). On Day 5 post-transfection, cells were trypsinized, and stained with Annexin V/PI for flow cytometry. (Upper panel) Representative Annexin V/PI analysis of one sample set showing early apoptosis (bottom right quadrant) and late apoptosis (top right quadrant). (Lower panel) Graphs showing the % of cells in early and late apoptosis, normalized to untransfected cells. Mean ± SEM (n=4), *P<0.05, **P<0.01.
Figure 10
Figure 10
Loss of EDD decreases PRL/R1881-induced phosphorylation of 4EBP1 and 4E release. (A) siRNA knockdown of EDD was confirmed by RT-qPCR. Mean ± SEM (n=3 for each cell line). (B, C) Quiescent MCF-7 cells were transfected with siEDD, non-targeting siNT1 or left untransfected (Con) for 48 h, and then treated with R1881 (10 nM) for 1 h. In (B), cell lysates (input) were used for SDS-PAGE and Western analysis, followed by densitometry of the α-, β-, and γ-4EBP1 bands. In (C), CAP-binding assays were performed by incubating cell lysates with m7GTP agarose beads (see Materials and Methods). The beads were washed and the m7GTP eluate was used for SDS-PAGE and Western analysis of eIF4E, which was analyzed by densitometry. β-Actin was used as a control to confirm sufficient washing of the agarose affinity resin. (D-G) are identical experiments as in (B, C) but using quiescent MDA-MB-231 cells treated with (D, E) 10 ng/ml PRL or (F, G) 10 nM R1881. Immunoblots shown are representatives of at least three independent experiments.

Similar articles

Cited by

References

    1. Carey LA, Perou CM, Livasy CA, Dressler LG, Cowan D, Conway K, Karaca G, Troester MA, Tse CK, Edmiston S, Deming SL, Geradts J, Cheang MC, Nielsen TO, Moorman PG, Earp HS, Millikan RC. Race, breast cancer subtypes, and survival in the Carolina breast cancer study. JAMA. 2006;295:2492–2502. - PubMed
    1. Yersal O, Barutca S. Biological subtypes of breast cancer: prognostic and therapeutic implications. World J Clin Oncol. 2014;5:412–424. - PMC - PubMed
    1. Creighton CJ. The molecular profile of luminal B breast cancer. Biologics. 2012;6:289–297. - PMC - PubMed
    1. Ellis MJ, Tao Y, Luo J, A’Hern R, Evans DB, Bhatnagar AS, Chaudri Ross HA, von Kameke A, Miller WR, Smith I, Eiermann W, Dowsett M. Outcome prediction for estrogen receptor-positive breast cancer based on postneoadjuvant endocrine therapy tumor characteristics. J Natl Cancer Inst. 2008;100:1380–1388. - PMC - PubMed
    1. Rakha EA, Elsheikh SE, Aleskandarany MA, Habashi HO, Green AR, Powe DG, El-Sayed ME, Benhasouna A, Brunet JS, Akslen LA, Evans AJ, Blamey R, Reis-Filho JS, Foulkes WD, Ellis IO. Triple-negative breast cancer: distinguishing between basal and nonbasal subtypes. Clin Cancer Res. 2009;15:2302–2310. - PubMed

LinkOut - more resources