

Factors Predicting a Greater Likelihood of Poor Visual Field Reliability in Glaucoma Patients and Suspects
- PMID: 32509439
- PMCID: PMC7255630
- DOI: 10.1167/tvst.9.1.4
Factors Predicting a Greater Likelihood of Poor Visual Field Reliability in Glaucoma Patients and Suspects
Abstract
Purpose: Identify factors predicting worse or better than expected visual field (VF) performance.
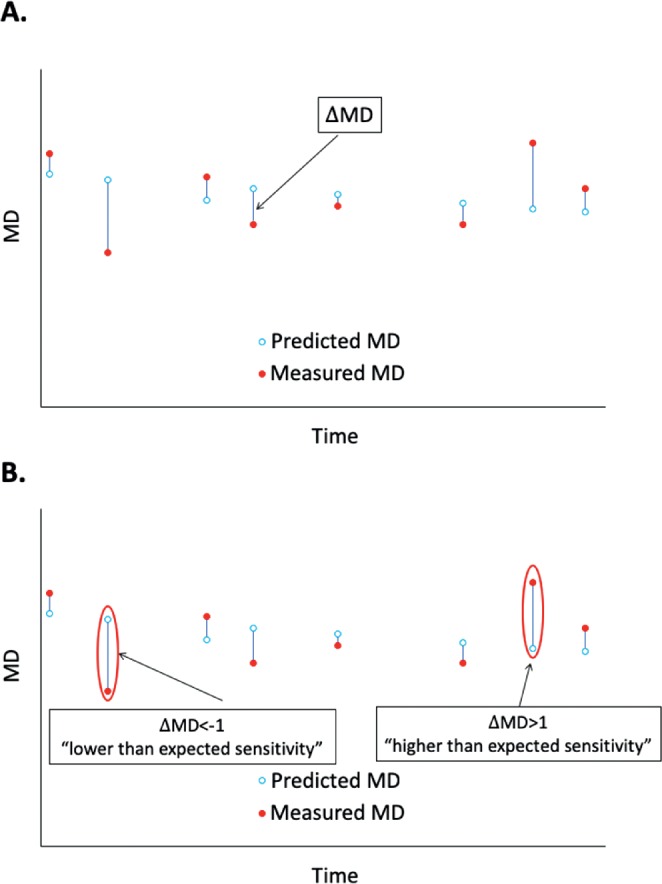
Methods: A total of 10,262 VFs from 1538 eyes of 909 subjects with manifest or suspected glaucoma were analyzed. Linear mixed-effects models predicted mean deviation (MD) at each timepoint. Differences between observed and predicted MD (ΔMD) were calculated and logistic regression identified factors predicting lower than expected (ΔMD <-1 dB) or higher than expected (ΔMD >1 dB) sensitivity.
Results: Both higher and lower than expected sensitivity were more likely in VFs with severe compared with mild damage (relative risk [RR] >1.3, P < 0.05). Higher than expected sensitivity was more likely in VFs with moderate damage (RR = 2.57, P < 0.001). False-positive (FP) errors increased the likelihood of higher than expected sensitivity at all disease stages (RR >2.1 per 10% increase, P < 0.001), whereas false-negative (FN) errors increased the likelihood of lower than expected sensitivity in mild and moderate disease (RR >1.19 per 10% increase, P < 0.05). Fixation loss errors slightly increased the likelihood of higher than expected VF sensitivity in moderate and severe disease (RR >1.1 per 10% increase, P < 0.01). Longer test duration increased likelihood of lower than expected sensitivity at all disease stages (RR >1.36 per minute increase, P < 0.001). Lower than expected sensitivity was more likely in late afternoon tests (RR = 1.27, P < 0.01). A total of 26.6% of VFs had higher or lower than expected sensitivity in the absence of FPs, FNs, or fixation losses.
Conclusions: FPs, test duration, and FNs are the primary measures predicting if a VF is likely to be reliable, although tests with normal reliability measures may still be unreliable. Our results help clinicians judge VF reliability and highlight the need to integrate reliability measures with other clinical data when making treatment decisions.
Translational relevance: This likelihood model derived from a large dataset helps clinicians identify VFs that may either falsely suggest disease progression or mask true worsening, thereby improving the utility of VFs in clinical practice.
Keywords: false negatives; false positives; fixation losses; visual field; visual field reliability.
Copyright 2020 The Authors.
Conflict of interest statement
Disclosure: I.F. Aboobakar, None; J. Wang, None; B.C. Chauhan, None; M.V. Boland, None; D.S. Friedman, None; P.Y. Ramulu, None; J. Yohannan, None
Figures

Similar articles
-
Evidence-based Criteria for Assessment of Visual Field Reliability.Ophthalmology. 2017 Nov;124(11):1612-1620. doi: 10.1016/j.ophtha.2017.04.035. Epub 2017 Jul 1. Ophthalmology. 2017. PMID: 28676280 Free PMC article.
-
The Effect of Transitioning from SITA Standard to SITA Faster on Visual Field Performance.Ophthalmology. 2021 Oct;128(10):1417-1425. doi: 10.1016/j.ophtha.2021.03.032. Epub 2021 Mar 30. Ophthalmology. 2021. PMID: 33798655 Free PMC article.
-
The Effect of Testing Reliability on Visual Field Sensitivity in Normal Eyes: The Singapore Chinese Eye Study.Ophthalmology. 2018 Jan;125(1):15-21. doi: 10.1016/j.ophtha.2017.08.002. Epub 2017 Aug 30. Ophthalmology. 2018. PMID: 28863943
-
Predictors of Long-Term Visual Field Fluctuation in Glaucoma Patients.Ophthalmology. 2020 Jun;127(6):739-747. doi: 10.1016/j.ophtha.2019.11.021. Epub 2019 Dec 5. Ophthalmology. 2020. PMID: 31952885
-
Visual fields in glaucoma: Where are we now?Clin Exp Ophthalmol. 2023 Mar;51(2):162-169. doi: 10.1111/ceo.14210. Epub 2023 Feb 16. Clin Exp Ophthalmol. 2023. PMID: 36751125 Review.
Cited by
-
A Hybrid Deep Learning-Based Approach for Visual Field Test Forecasting.Ophthalmol Sci. 2025 Apr 24;5(5):100803. doi: 10.1016/j.xops.2025.100803. eCollection 2025 Sep-Oct. Ophthalmol Sci. 2025. PMID: 40520474 Free PMC article.
-
Development of a reliability criterion for the binocular Esterman visual field test.Jpn J Ophthalmol. 2025 Jun 21. doi: 10.1007/s10384-025-01238-8. Online ahead of print. Jpn J Ophthalmol. 2025. PMID: 40542981
-
Standard Reliability and Gaze Tracking Metrics in Glaucoma and Glaucoma Suspects.Am J Ophthalmol. 2022 Feb;234:91-98. doi: 10.1016/j.ajo.2021.06.038. Epub 2021 Jul 17. Am J Ophthalmol. 2022. PMID: 34280366 Free PMC article.
-
Big data in visual field testing for glaucoma.Taiwan J Ophthalmol. 2024 Sep 13;14(3):289-298. doi: 10.4103/tjo.TJO-D-24-00059. eCollection 2024 Jul-Sep. Taiwan J Ophthalmol. 2024. PMID: 39430358 Free PMC article. Review.
-
Determinants of Test Variability in Scotopic Microperimetry: Effects of Dark Adaptation and Test Indices.Transl Vis Sci Technol. 2021 Jan 15;10(1):26. doi: 10.1167/tvst.10.1.26. eCollection 2021 Jan. Transl Vis Sci Technol. 2021. PMID: 33520422 Free PMC article.
References
-
- Nelson-quigg JM, Twelker JD, Johnson CA. Response properties of normal observers and patients during automated perimetry. Arch Ophthalmol. 1989;107:1612–1615. - PubMed
-
- Advanced Glaucoma Intervention Study. Visual field test scoring and reliability. Ophthalmology. 1994;101:1445–1455. - PubMed
-
- Chauhan BC, Malik R, Shuba LM, Rafuse PE, Nicolela MT, Artes PH. Rates of glaucomatous visual field change in a large clinical population. Invest Ophthalmol Vis Sci. 2014;55:4135–4143. - PubMed
-
- Bickler-bluth M, Trick GL, Kolker AE, Cooper DG. Assessing the utility of reliability indices for automated visual fields. Testing ocular hypertensives. Ophthalmology. 1989;96:616–619. - PubMed
Publication types
MeSH terms
Grants and funding
LinkOut - more resources
Full Text Sources
Medical
Miscellaneous
