. 2020 May 20:10:595.
doi: 10.3389/fonc.2020.00595. eCollection 2020.

Development and Clinical Validation of a Novel 4-Gene Prognostic Signature Predicting Survival in Colorectal Cancer

Affiliations

Development and Clinical Validation of a Novel 4-Gene Prognostic Signature Predicting Survival in Colorectal Cancer

Yihang Yuan et al. Front Oncol. .

Abstract

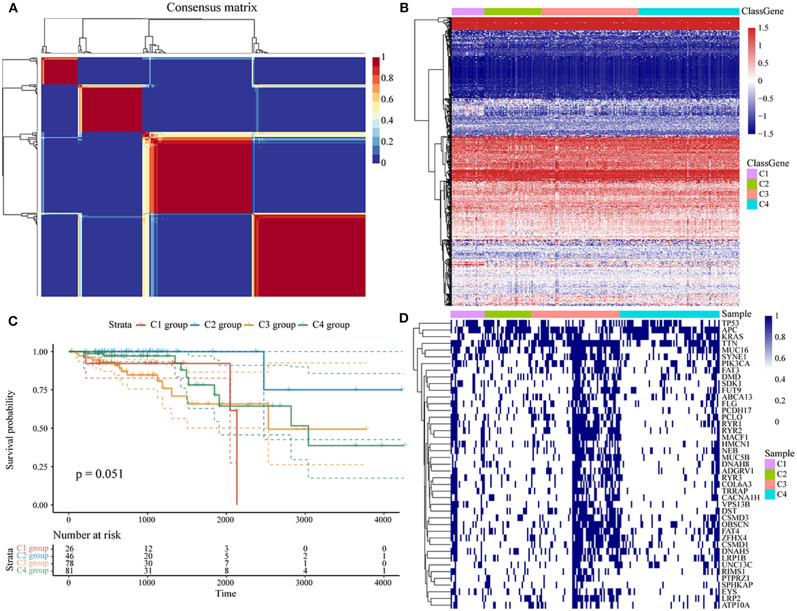
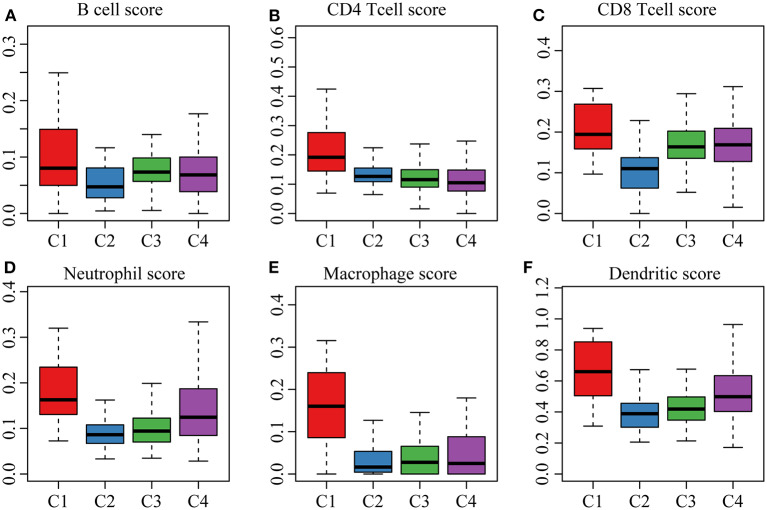
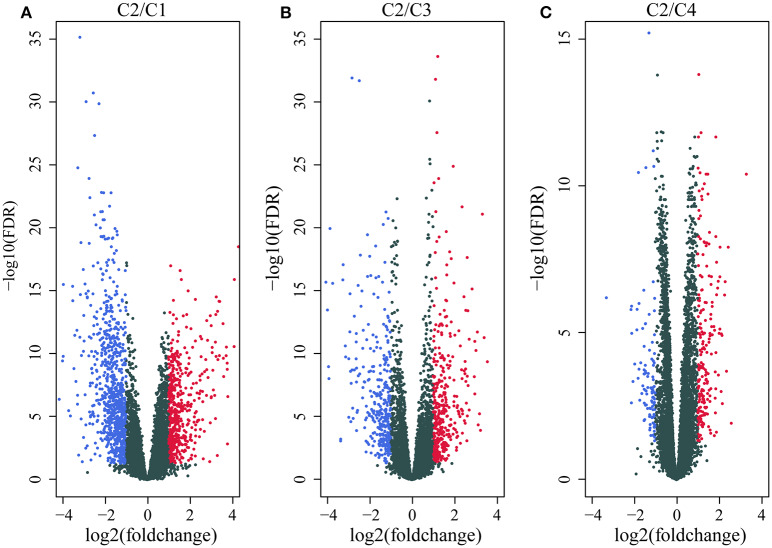
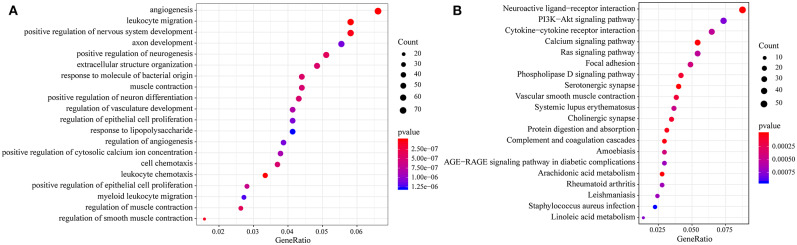
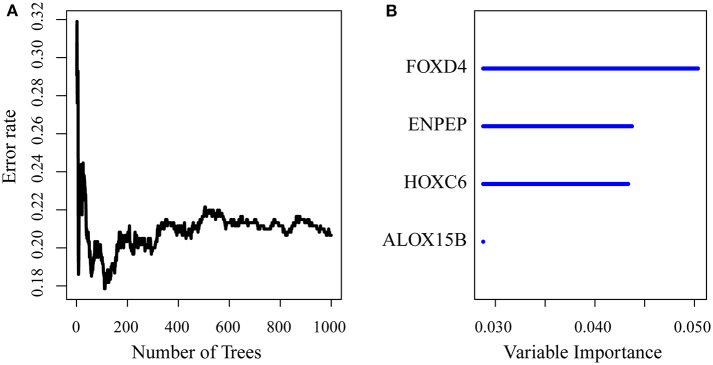
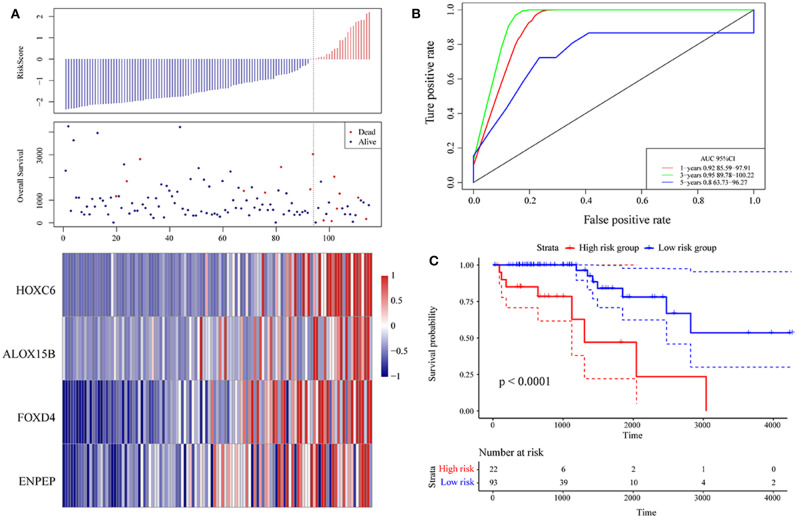
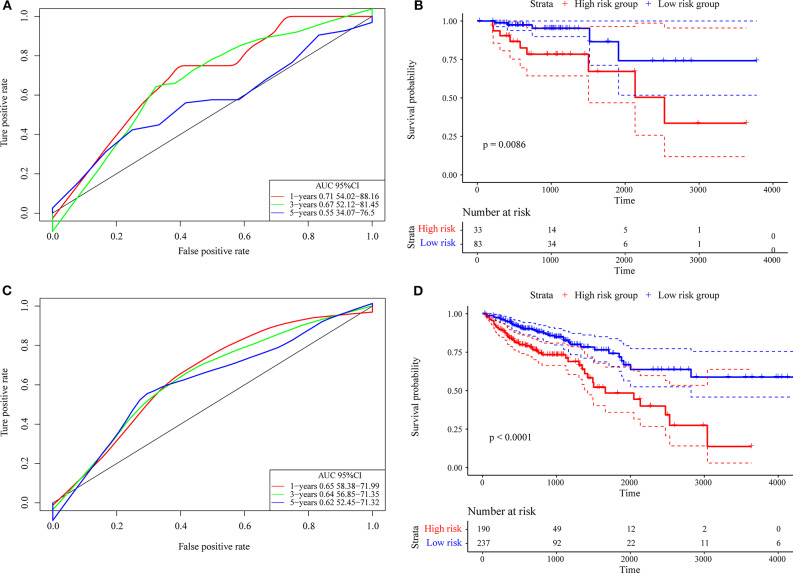
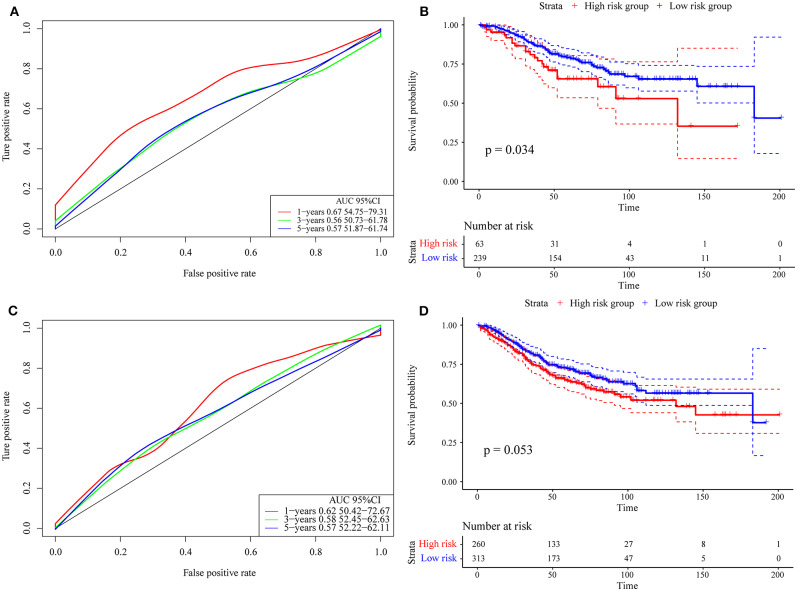
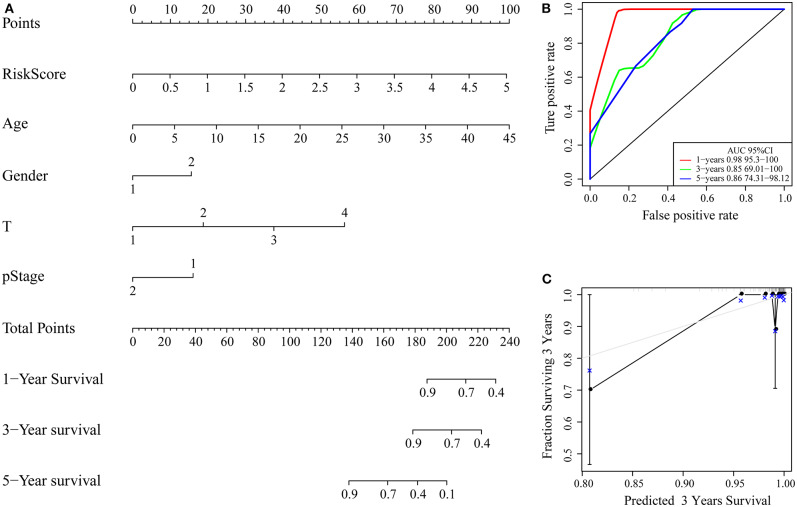
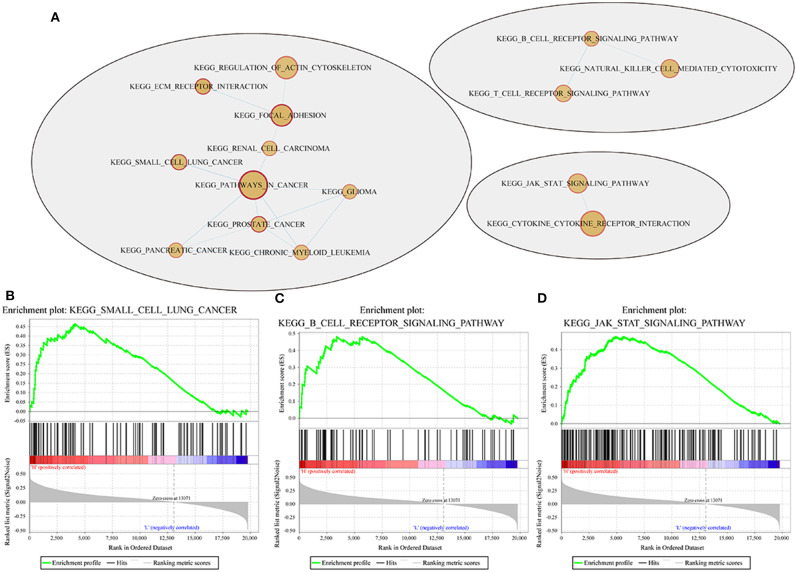
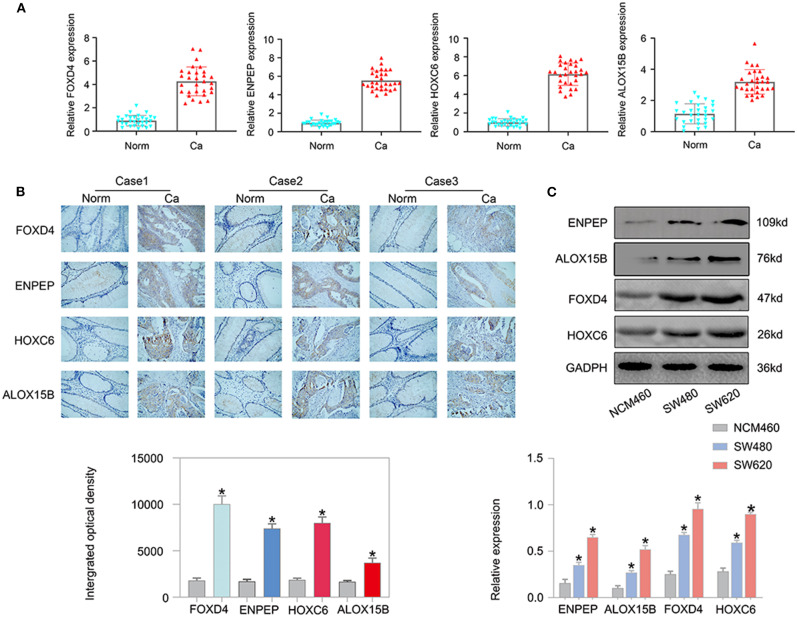
In this study, we collected genes related to energy metabolism, used gene expression data from public databases to classify molecular subtypes of colon cancer (COAD) based on the genes related to energy metabolism, and further evaluated the relationships between the molecular subtypes and prognosis and clinical characteristics. Differential expression analysis of the molecular subtypes yielded 1948 differentially expressed genes (DEGs), whose functions were closely related to the occurrence and development of cancer. Based on the DEGs, we constructed a 4-gene prognostic risk model and identified the high expression of FOXD4, ENPEP, HOXC6, and ALOX15B as a risk factor associated with a high risk of developing COAD. The 4-gene signature has strong robustness and a stable predictive performance in datasets from different platforms not only in patients with early COAD but also in all patients with colon cancer. The enriched pathways of the 4-gene signature in the high- and low-risk groups obtained by GSEA were significantly related to the occurrence and development of colon cancer. Moreover, the results of qPCR, immunohistochemistry staining and Western blot assay revealed that FOXD4, ENPEP, HOXC6, and ALOX15B are over expressed in CRC tissues and cells. These results suggesting that the signature could potentially be used as a prognostic marker for clinical diagnosis.

Keywords: colon cancer; energy metabolism; genes; prognosis; survival.


Figures

Figure 1
Figure 1
(A) Consensus map of NMF clustering; (B) heat map of energy metabolism-related gene expression of the molecular subtypes; (C) OS prognosis and survival curves of the molecular subtypes; (D) the mutation landscape of the top 20 genes with the highest mutations in each subtype in each sample.
Figure 2
Figure 2
(A,B) cell scores of the molecular subtypes; (B) CD4 cell scores of the molecular subtypes; (C) CD8 cell scores of the molecular subtypes; (D) neutrophil scores of the molecular subtypes; (E) macrophage scores of the molecular subtypes; (F) dendritic cell scores of the molecular subtypes.
Figure 3
Figure 3
(A) Volcano map of the differentially expressed genes between the C2 and C1 subtypes; (B) volcano map of the differentially expressed genes between the C2 and C3 subtypes; (C) volcano map of the differentially expressed genes between the C2 and C4 subtypes.
Figure 4
Figure 4
(A) Results of GO enrichment of the top 20 differentially expressed genes; (B) KEGG enrichment of the top 20 genes.
Figure 5
Figure 5
(A) Error rate for the data as a function of the classification tree; (B) out-of-bag importance values for the predictors.
Figure 6
Figure 6
(A) Risk score, survival time, survival state and expression of the 4 genes in the training set; (B) ROC curve and AUC of the 4-gene signature classification; (C) distribution of KM survival curves of the 4-gene signature in the training set.
Figure 7
Figure 7
(A) The internal validation set contains only stage I/II samples for the 4-gene signature classification ROC curve and AUC; (B) stage I/II samples for the 4-gene signature KM survival curve; (C) the internal validation set contains stage I, II/I, and II/IV samples for the 4-gene signature classification ROC curve and AUC; (D) stage I, II/I, and II/IV samples for the 4-gene signature KM survival curve.
Figure 8
Figure 8
(A) Risk score, survival time, survival state and expression of the 4 genes in the external verification set; (B) ROC curve and AUC of the 4-gene signature classification; (C) distribution of KM survival curves of the 4-gene signature in the training set. (D) Stage I, II/I, and II/IV samples for the 4-gene signature KM survival curve.
Figure 9
Figure 9
(A) Nomogram; (B) ROC curve of the nomogram; (C) calibration plots for predicting 3-year OS. The nomogram-predicted aim-listed probability of survival is plotted on the x-axis. The actual survival is plotted on the y-axis.
Figure 10
Figure 10
Pathways enriched in the high- and low-risk groups according to the 4-gene signature. (A) Network map mapped by the GSEA enrichment gene set (red represents the high-risk group); (B–D) results of significantly enriched pathways in the high-risk group by GESA. Enrichment scores (ES, green line) indicate the degree to which the genome is overexpressed at the top or bottom of the list of sequenced genes. The black bars represent the positions of genes belonging to the set of genes in the list of sequences included in the analysis. Positive values indicate a higher correlation with patients in the high-risk group, while negative values indicate a higher correlation with patients in the low-risk group.
Figure 11
Figure 11
The expression of the oncogenes is up-regulated in CRC. According to the qPCR results (A), FOXD4, ENPEP, HOXC6 and ALOX15B were up-regulated in CRC tissues. (B) Immunostaining demonstrated that FOXD4, ENPEP, HOXC6, and ALOX15B were up-regulated in CRC tissues compared with normal tissues. (C) The results of Western blot assay showed that the expression of FOXD4, ENPEP, HOXC6, and ALOX15B are over expressed in CRC cells. *P < 0.05.

Similar articles

Cited by

References

    1. Lancet T. GLOBOCAN 2018: counting the toll of cancer. Lancet. (2018) 392:985 10.1016/S0140-6736(18)32252-32259 - DOI - PubMed
    1. Siegel RL, Miller KD, Jemal A. Cancer statistics, 2018. CA Cancer J Clin. (2018) 68:7–30. 10.3322/caac.21442 - DOI - PubMed
    1. Cheng L, Eng C, Nieman LZ, Kapadia AS, Du XL. Trends in colorectal cancer incidence by anatomic site and disease stage in the United States from 1976 to 2005. Am J Clin Oncol. (2011) 34:573–80. 10.1097/COC.0b013e3181fe41ed - DOI - PubMed
    1. Siegel RL, Miller KD, Fedewa SA, Ahnen DJ, Meester R, Barzi A, et al. . Colorectal cancer statistics, 2017. CA Cancer J Clin. (2017) 67:177–93. 10.3322/caac.21395 - DOI - PubMed
    1. Siegel RL, Miller KD, Jemal A. Cancer statistics, 2016. CA Cancer J Clin. (2016) 66:7–30. 10.3322/caac.21332 - DOI - PubMed

LinkOut - more resources