

How to Conduct a Bayesian Network Meta-Analysis
- PMID: 32509807
- PMCID: PMC7248597
- DOI: 10.3389/fvets.2020.00271
How to Conduct a Bayesian Network Meta-Analysis
Abstract
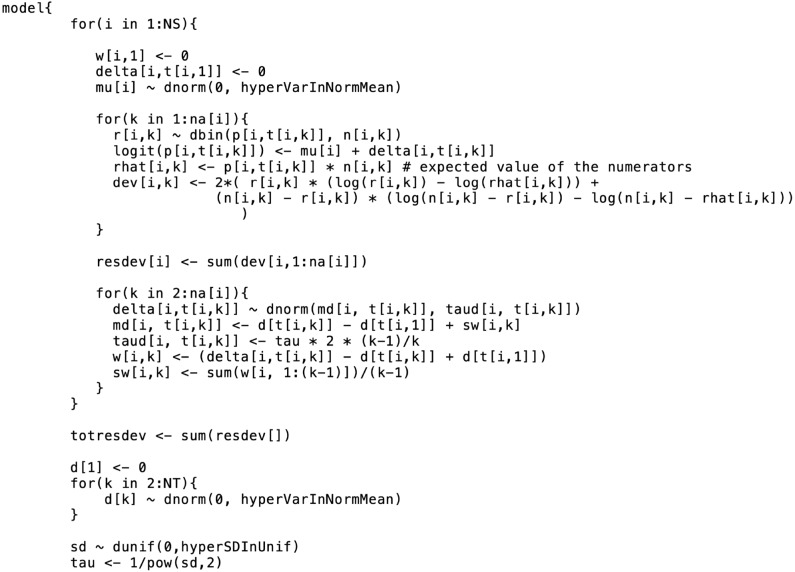
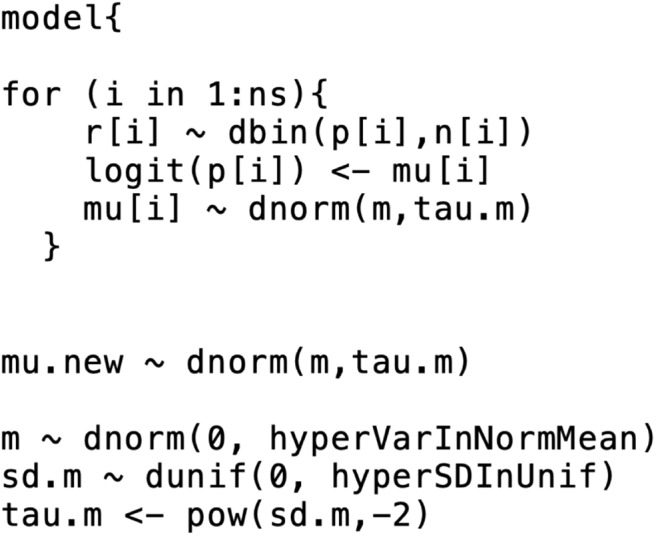
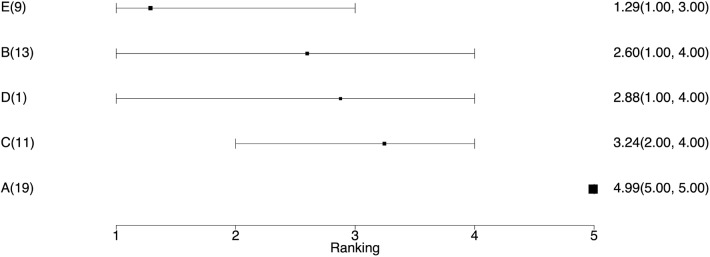
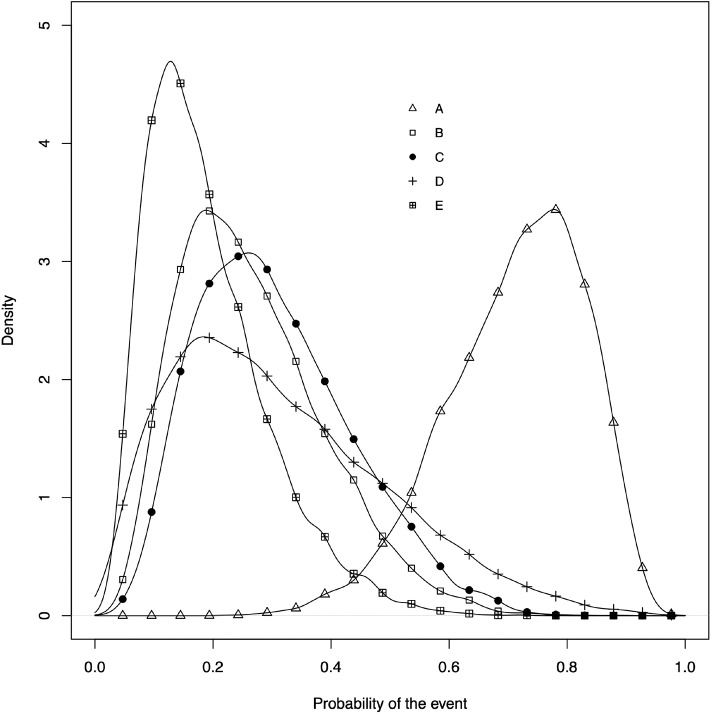
Network meta-analysis is a general approach to integrate the results of multiple studies in which multiple treatments are compared, often in a pairwise manner. In this tutorial, we illustrate the procedures for conducting a network meta-analysis for binary outcomes data in the Bayesian framework using example data. Our goal is to describe the workflow of such an analysis and to explain how to generate informative results such as ranking plots and treatment risk posterior distribution plots. The R code used to conduct a network meta-analysis in the Bayesian setting is provided at GitHub.
Keywords: Bayesian; network meta-analysis; systematic review; tutorial; veterinary science.
Copyright © 2020 Hu, O'Connor, Wang, Sargeant and Winder.
Figures
Similar articles
-
A primer on network meta-analysis for dental research.ISRN Dent. 2012;2012:276520. doi: 10.5402/2012/276520. Epub 2012 Jun 21. ISRN Dent. 2012. PMID: 22919506 Free PMC article.
-
Bayesian Meta-Analysis of Health State Utility Values: A Tutorial with a Practical Application in Heart Failure.Pharmacoeconomics. 2024 Jul;42(7):721-735. doi: 10.1007/s40273-024-01387-7. Epub 2024 May 20. Pharmacoeconomics. 2024. PMID: 38767714 Free PMC article.
-
A Gentle Introduction to Bayesian Network Meta-Analysis Using an Automated R Package.Multivariate Behav Res. 2023 Jul-Aug;58(4):706-722. doi: 10.1080/00273171.2022.2115965. Epub 2022 Oct 18. Multivariate Behav Res. 2023. PMID: 36254763
-
A Hands-On Tutorial for Systematic Review and Meta-Analysis With Example Data Set and Codes.J Speech Lang Hear Res. 2022 Sep 12;65(9):3217-3238. doi: 10.1044/2022_JSLHR-21-00607. Epub 2022 Aug 24. J Speech Lang Hear Res. 2022. PMID: 36001816
-
Comparison of Five Prophylactically Intravenous Drugs in Preventing Opioid-Induced Cough: A Bayesian Network Meta-Analysis of Randomized Controlled Trials.Front Pharmacol. 2021 Nov 17;12:684276. doi: 10.3389/fphar.2021.684276. eCollection 2021. Front Pharmacol. 2021. PMID: 34867314 Free PMC article. Review.
Cited by
-
Rhythm Control of Persistent Atrial Fibrillation in Systolic Heart Failure: A Bayesian Network Meta-Analysis of Randomized Controlled Trials.Int J Heart Fail. 2021 Jun 11;3(3):179-193. doi: 10.36628/ijhf.2021.0008. eCollection 2021 Jul. Int J Heart Fail. 2021. PMID: 36262637 Free PMC article.
-
Pain-related fear of movement dynamics in individuals with and without low back pain participating in weightlifting and/or powerlifting training.PLoS One. 2022 Oct 27;17(10):e0276983. doi: 10.1371/journal.pone.0276983. eCollection 2022. PLoS One. 2022. PMID: 36302048 Free PMC article.
-
Network meta-analysis for an ordinal outcome when outcome categorization varies across trials.Syst Rev. 2024 May 9;13(1):128. doi: 10.1186/s13643-024-02537-w. Syst Rev. 2024. PMID: 38725074 Free PMC article.
-
Network meta-analysis comparing WALANT, locoregional, local and general anesthesia techniques in carpal tunnel release.EFORT Open Rev. 2025 Jan 3;10(1):3-13. doi: 10.1530/EOR-2024-0014. Print 2025 Jan 1. EFORT Open Rev. 2025. PMID: 40071930 Free PMC article.
-
Comparative efficacy of topical interventions for facial photoaging: a network meta-analysis.Sci Rep. 2025 Jul 24;15(1):26889. doi: 10.1038/s41598-025-12597-0. Sci Rep. 2025. PMID: 40707570 Free PMC article.
References
-
- Coleman CI, Phung OJ, Cappelleri JC, Baker WL, Kluger J, White CM, et al. Use of Mixed Treatment Comparisons in Systematic Reviews [Internet]. Agency for Healthcare Research and Quality (2012). Available online at: www.effectivehealthcare.ahrq.gov/reports/final.cfm - PubMed
-
- Smith E, Hubbard S, Cooper N, Abrams K. Using network meta-analysis of individual patient data (IPD) & summary aggregate data (SAD) to identify which combinations of interventions work best for which individuals. Value Health. (2017) 20:A758 10.1016/j.jval.2017.08.2138 - DOI
LinkOut - more resources
Full Text Sources