. 2020 May 27:12:100285.
doi: 10.1016/j.bonr.2020.100285. eCollection 2020 Jun.

Delayed tooth movement in Runx2+/- mice associated with mTORC2 in stretch-induced bone formation

Affiliations

Delayed tooth movement in Runx2+/- mice associated with mTORC2 in stretch-induced bone formation

Tomo Aonuma et al. Bone Rep. .

Abstract

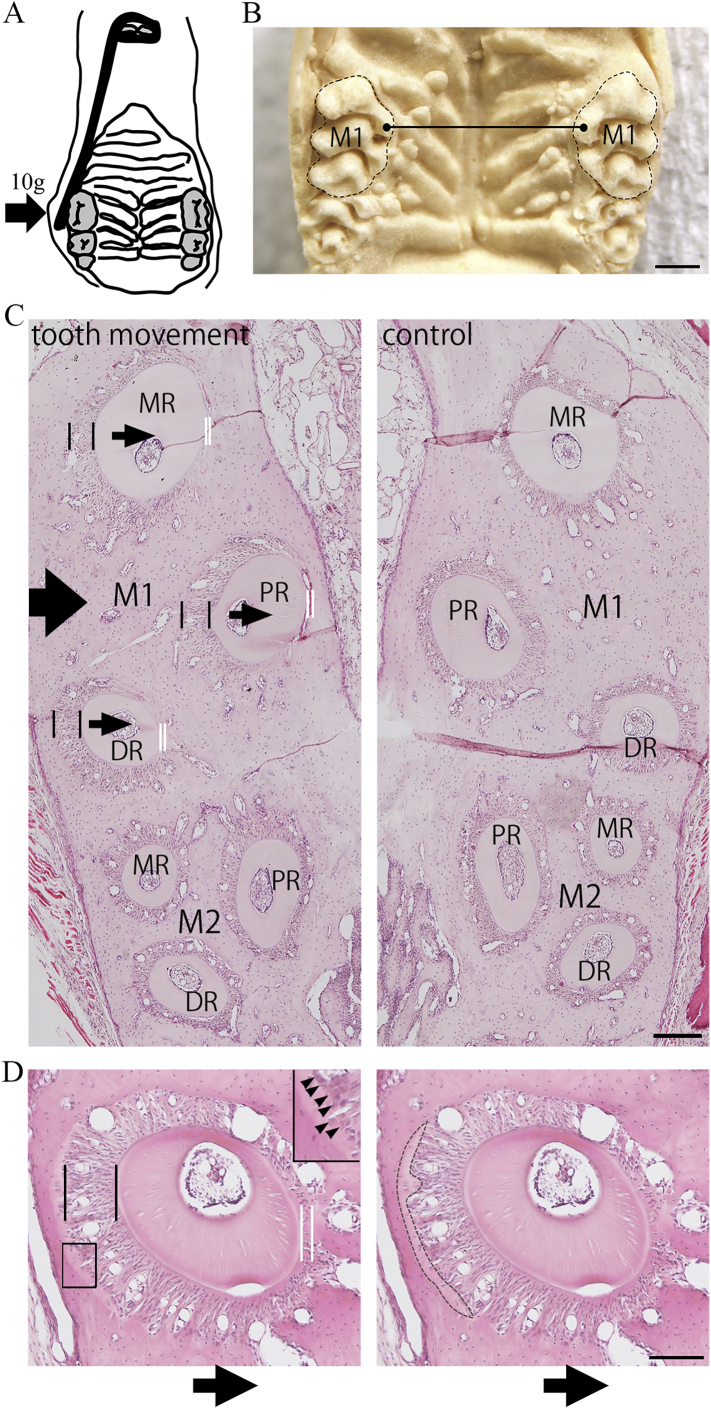
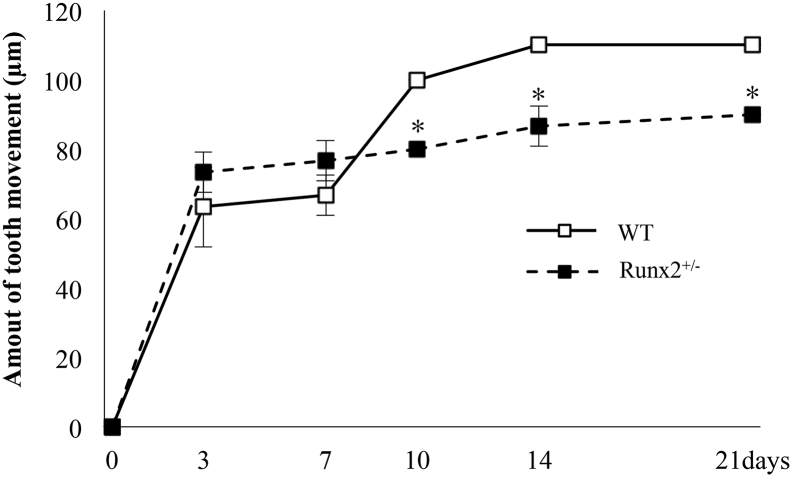
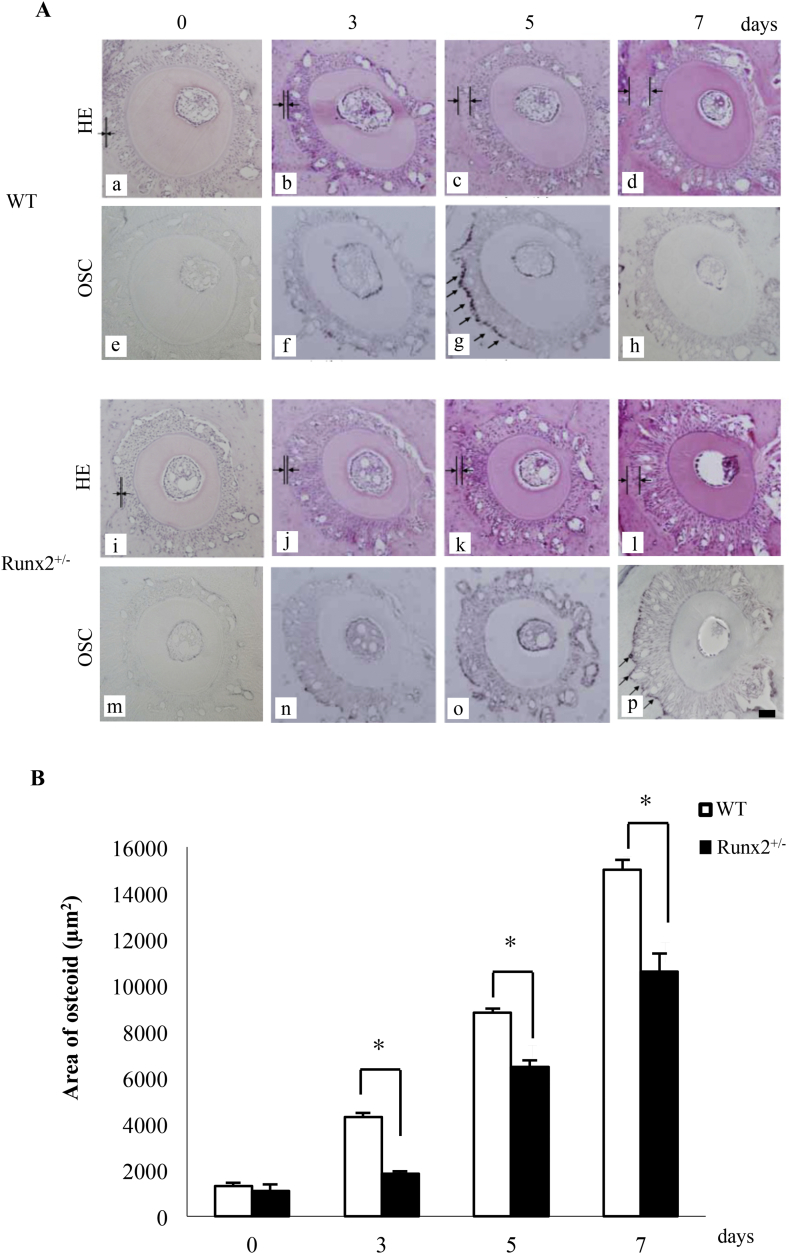
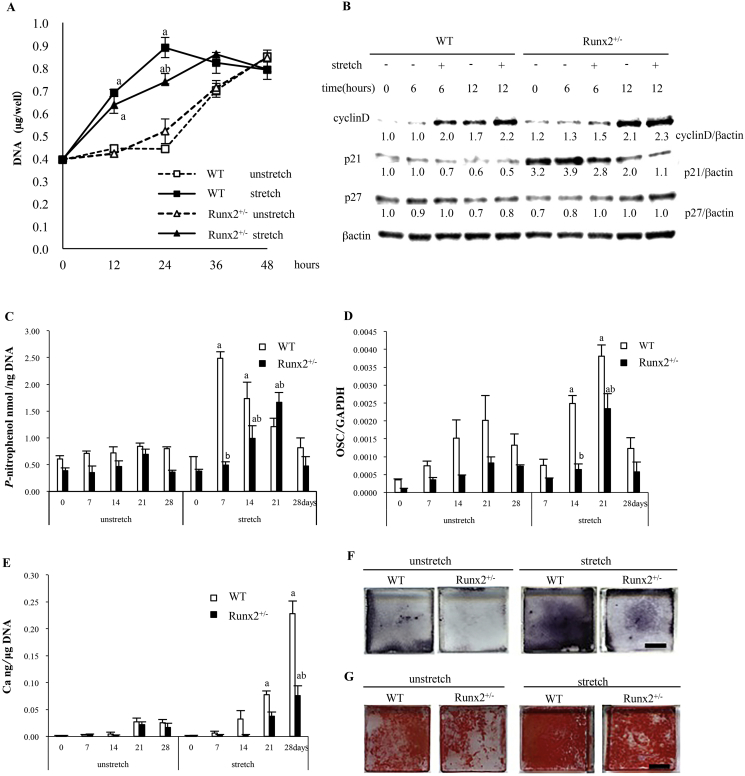
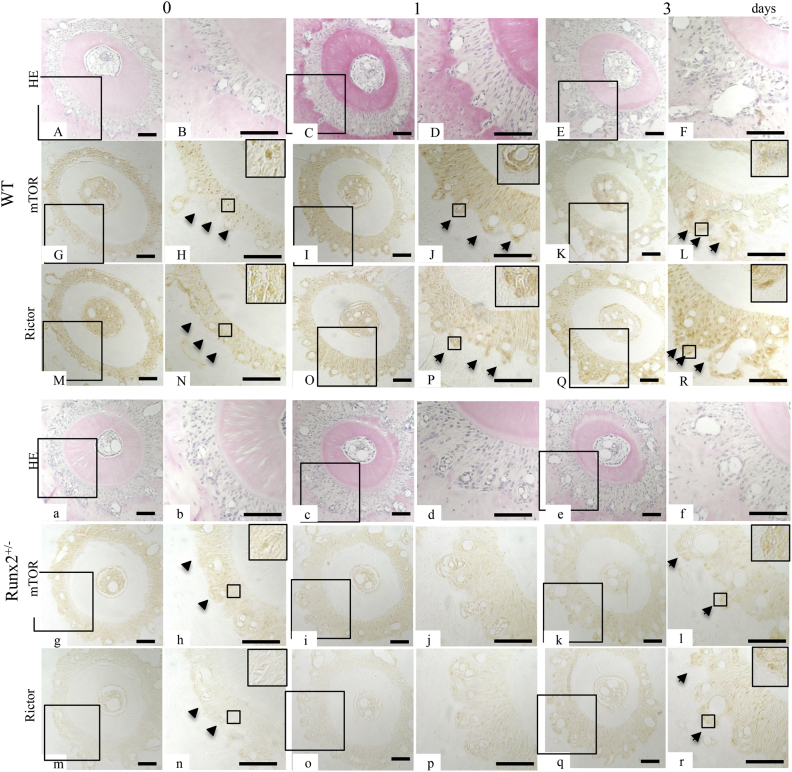
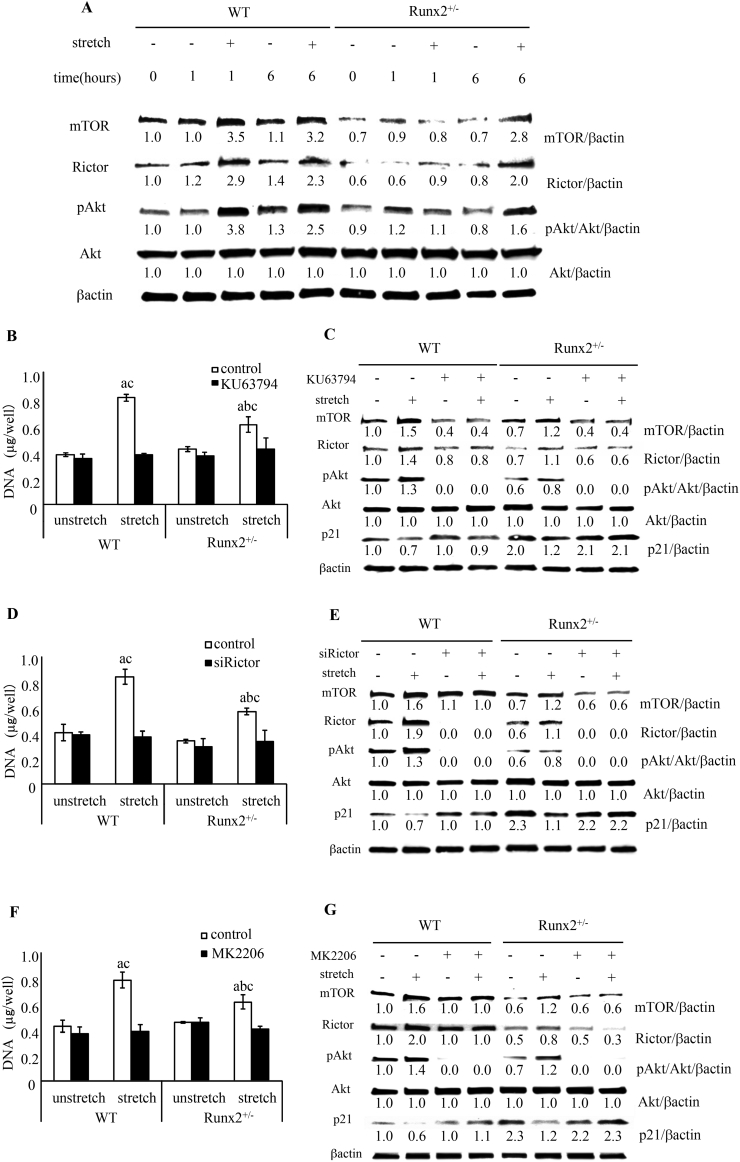
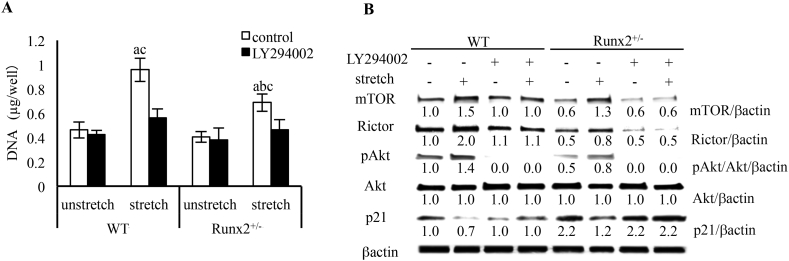
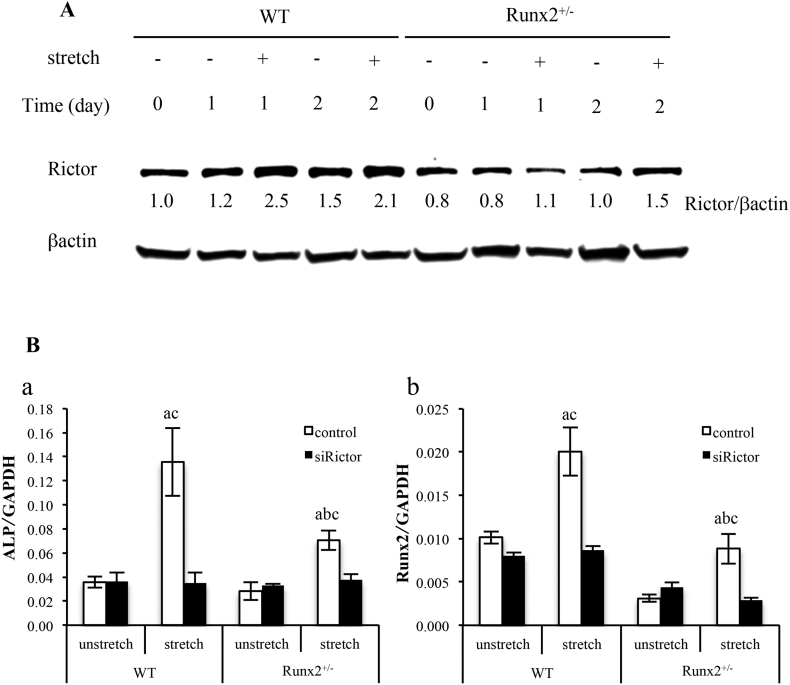
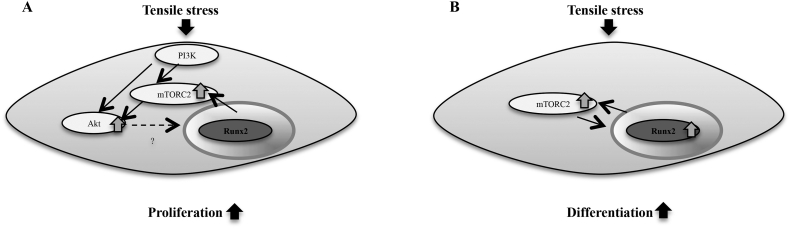
Runt-related transcription factor 2 (Runx2) is an essential transcription factor for osteoblast differentiation, and is activated by mechanical stress to promote osteoblast function. Cleidocranial dysplasia (CCD) is caused by mutations of RUNX2, and CCD patients exhibit malocclusion and often need orthodontic treatment. However, treatment is difficult because of impaired tooth movement, the reason of which has not been clarified. We examined the amount of experimental tooth movement in Runx2+/- mice, the animal model of CCD, and investigated bone formation on the tension side of experimental tooth movement in vivo. Continuous stretch was conducted to bone marrow stromal cells (BMSCs) as an in vitro model of the tension side of tooth movement. Compared to wild-type littermates the Runx2+/- mice exhibited delayed experimental tooth movement, and osteoid formation and osteocalcin (OSC) mRNA expression were impaired in osteoblasts on the tension side of tooth movement. Runx2 heterozygous deficiency delayed stretch-induced increase of DNA content in BMSCs, and also delayed and reduced stretch-induced alkaline phosphatase (ALP) activity, OSC mRNA expression, and calcium content of BMSCs in osteogenic medium. Furthermore Runx2+/- mice exhibited delayed and suppressed expression of mammalian target of rapamycin (mTOR) and rapamycin-insensitive companion of mTOR (Rictor), essential factors of mTORC2, which is regulated by Runx2 to phosphorylate Akt to regulate cell proliferation and differentiation, in osteoblasts on the tension side of tooth movement in vivo and in vitro. Loss of half Runx2 gene dosage inhibited stretch-induced PI3K dependent mTORC2/Akt activity to promote BMSCs proliferation. Furthermore, Runx2+/- BMSCs in osteogenic medium exhibited delayed and suppressed stretch-induced expression of mTOR and Rictor. mTORC2 regulated stretch-elevated Runx2 and ALP mRNA expression in BMSCs in osteogenic medium. We conclude that Runx2+/- mice present a useful model of CCD patients for elucidation of the molecular mechanisms in bone remodeling during tooth movement, and that Runx2 plays a role in stretch-induced proliferation and osteogenesis in BMSCs via mTORC2 activation.

Keywords: BMSCs; Experimental tooth movement; Mechanical stress; Osteoblast; Runx2+/− mice; mTORC2.


Conflict of interest statement

All authors declare that they have no competing interest.

Figures

Fig. 1
Fig. 1
(A) Schematic drawing of experimental tooth movement in mice. Ni—Ti wire was fixed to the maxillary incisors with a composite resin for dental filling, and to load a continuous 10-g force (arrow) for movement of the right maxillary 1st molar toward the palatal side. (B) A representative image of plaster model of maxilla of mice for measurement of the amount of experimental tooth movement. The distance between the tips of mesial palatal cusps (Black dots) of right and left maxillary 1st molars was measured (Black line). Both sides of maxillary first molars were surrounded by dotted line. M1, maxillary 1st molar. Scale Bar, 500 μm. (C) Representative images of horizontal sections of maxillary alveolar bone during experimental tooth movement. Left panel represented right side of alveolar bone (tooth movement side), and right panel represented left side of alveolar bone (control side). Arrow indicated the direction of the force applied. Small narrow arrows indicated the direction of the tooth movement. Spaces between black lines indicated periodontal space of tension side, and the spaces between white lines represented that of compression sides. M1, maxillary 1st molar; M2, maxillary 2nd molar; MR, mesial root; PR, palatal root, DR, distal root. Scale Bar, 200 μm. (D) Representative images for identification of osteoid area. The distal root of the 1st molar during experimental tooth movement were shown. Arrow indicated the direction of the force applied. Spaces between black lines indicated periodontal space of tension side, and the spaces between white lines represented that of compression sides. Areas, identified as uniformly pink area staining with HE and covered with tall and cuboidal osteoblasts in tension side, were surrounded by dotted line as newly formed osteoid. Rectangle in left panel indicated the area enlarged in the inset. Arrowheads indicated the tall and cuboidal osteoblasts. Scale Bar, 100 μm.
Fig. 2
Fig. 2
Time course changes of amount of experimental tooth movement in wild-type and Runx2+/− mice. Time course changes of tooth movement at 3, 7, 10, 14, and 21 days after the initiation of tooth movement. Values are averages ± SD (n = 3). * significantly different from wild-type mice at corresponding time point.
Fig. 3
Fig. 3
Time course changes of osteoid area and OSC mRNA expression pattern in osteoblasts on tension side of alveolar bone in wild-type and Runx2+/− mice. (A) Time course changes of the osteoid area (a-d, and i-l) and OSC mRNA expression (e-h, and m-p) in osteoblasts on tension side of upper first molar in wild-type (a-h) and Runx2+/− mice (i-p). HE staining and in situ hybridization for OSC mRNA were performed on 0 (a, e, i, and m), 3 (b, f, j, and n), 5 (c, g, k, and o), and 7 (d, h, l, and p) days after the initiation of tooth movement. Arrows indicated osteoid layers in HE staining and arrows indicated OSC mRNA expression in osteoblasts in in situ hybridization. Scale bar, 50 μm. (B) Time course changes of the osteoid area on tension side of tooth movement on 0, 3, 5, and 7 days after the initiation of tooth movement. Values are averages ± SD (n = 3). * significantly different from wild-type mice at corresponding time point.
Fig. 4
Fig. 4
Stretch-induced proliferation and osteogenesis in wild-type and Runx2+/− BMSCs. (A) Change of DNA content of wild-type and Runx2+/− BMSCs at 0, 12, 24, 36, and 48 h after the initiation of mechanical stretch. (B) Expression of cell cycle regulation factors protein in BMSCs at 0, 6, and 12 h after the initiation of mechanical stretch. ALP activity (C), OSC mRNA (D) and calcium content (E) in BMSCs in osteogenic media were examined on day 0, 7, 14, 21, and 28. ALP staining on day 7 (F) and Alizarin red staining on day 21 (G) after the initiation of mechanical stretch were investigated. Values are averages ± SD (n = 3). a, significantly different between corresponding unstretched and stretched wild-type and Runx2+/− BMSCs. b, significantly different between stretched wild-type and Runx2+/− BMSCs. Scale bar, 1 cm. A quantification of normalized relative protein levels against respective βactin and corresponding unloaded wild-type mice cells is given below lane.
Fig. 5
Fig. 5
Time course changes of mTOR and Rictor protein expression pattern in osteoblasts on tension side of alveolar bone in wild-type and Runx2+/− mice. HE staining (A-F, and a-f) and immunohistochemistry for mTOR (G-L, and g-l) and Rictor (M-R, and m-r) expression in osteoblasts on tension side of distal root of upper right 1st molar in wild-type (A-R) and Runx2+/− (a-r) mice on 0 (A, B, G, H, M, N, a, b, g, h, m, and n) and 1 (C, D, I, J, O, P, c, d, i, j, o, and p), 3 (E, F, K, L, Q, R, e, f, k, l, q, and r) days after the wire attachment. Arrowheads indicate strong mTOR and Rictor protein expression in periodontal ligament.. B, D, F, H, J, L, N, P, and R are enlarged views of squares in A, C, E, G, I, K, M, O, and Q, and b, d, f, h, j, l, n, p, and r are enlarged views of a, c, e, g, i, k, m, o, and q. Squares in H, J, L, N, P, R, h, l, n, and r indicate the areas enlarged in the inset. Scale bar, 50 μm.
Fig. 6
Fig. 6
Stretch-induced mTORC2/Akt signal and proliferation of wild-type and Runx2+/− BMSCs. (A) Change of mTOR and Rictor protein expression and Akt phosphorylation in BMSCs after 0, 1, and 6 h after the initiation of stretch. DNA content of BMSCs treated with KU63794 (5 μM) (B), siRictor (D), and MK2206 (5 μM), and stretched for 24 h (F). Values are averages ± SD (n = 3). a, significantly different between corresponding unstretched and stretched wild-type and Runx2+/− BMSCs. b, significantly different between stretched wild-type and Runx2+/− BMSCs. c significantly different between control and inhibitor or siRNA treated stretched wild-type and Runx2+/− BMSCs. p21 and mTORC2 related protein expression pattern in BMSCs treated with KU63794 (5 μM) (C), siRictor (E), and MK2206 (5 μM) (G) and stretched for 6 h. A quantification of normalized relative protein levels against respective βactin and corresponding unloaded wild-type mice cells is given below lane.
Fig. 7
Fig. 7
Stretch-induced PI3K signal and cell proliferation in wild-type and Runx2+/− BMSCs. (A) DNA content from BMSCs treated with LY294002 (5 μM) and stretched for 24 h. Values are averages ± SD (n = 3). a, significantly different between corresponding unstretched and stretched wild-type and Runx2+/− BMSCs. b, significantly different between stretched wild-type and Runx2+/− BMSCs. c significantly different between control and inhibitor treated stretched wild-type and Runx2+/− BMSCs. (B) Immunoblot for p21 and mTORC2 related protein and expression pattern in BMSC treated with LY294002 (5 μM) and stretched for 6 h. A quantification of normalized relative protein levels against respective βactin and corresponding unloaded wild-type mice cells is given below lane.
Fig. 8
Fig. 8
Stretch-induced osteoblast differentiation in wild-type and Runx2+/− BMSCs treated by siRictor. (A) BMSCs were down-regulated with siRictor, and stretched for 1 and 2 days after 1 h followed by change of osteogenic medium. (B) mRNA expression of ALP (a), and Runx2 (b) in BMSCs in osteogenic medium on 2 days after mechanical stretch. Values are averages ± SD (n = 3). a, significantly different between corresponding unstretched and stretched wild-type and Runx2+/− BMSCs. b, significantly different between stretched wild-type and Runx2+/− BMSCs. c, significantly different between control and inhibitor treated stretched wild-type and Runx2+/− BMSCs. A quantification of normalized relative protein levels against respective βactin and corresponding unloaded wild-type mice cells is given below lane.
Fig. 9
Fig. 9
Runx2 regulates stretch-induced osteoblast function via mTORC2. (A) Runx2 regulates PI3K/mTORC2/Akt signaling axis in stretch-induced proliferation of BMSCs. (B) Runx2 interacts with mTORC2 in stretch-induced osteoblast differentiation.

References

    1. Aberg T., Cavender A., Gaikwad J.S. Phenotypic changes in dentition of Runx2 homozygote-null mutant mice. J. Histochem. Cytochem. 2004;52(1):131–139. - PubMed
    1. Baldin V., Lukas J., Marcote M.J. Cyclin D1 is a nuclear protein required for cell cycle progression in G1. Genes Dev. 1993;7(5):812–821. - PubMed
    1. Becker A., Lustmann J., Shteyer A. Cleidocranial dysplasia: part 1--general principles of the orthodontic and surgical treatment modality. Am. J. Orthod. Dentofac. Orthop. 1997;111(1):28–33. - PubMed
    1. Becker A., Shteyer A., Bimstein E., Lustmann J. Cleidocranial dysplasia: part 2--treatment protocol for the orthodontic and surgical modality. Am. J. Orthod. Dentofac. Orthop. 1997;111(2):173–183. - PubMed
    1. Beertsen W., McCulloch C.A., Sodek J. The periodontal ligament: unique, multifunctional connective tissue. Periodontol. 1997;2000(13):20–40. - PubMed

LinkOut - more resources