. 2020 May 26:3:78.
doi: 10.1038/s41746-020-0287-6. eCollection 2020.

A machine learning approach predicts future risk to suicidal ideation from social media data

Affiliations

A machine learning approach predicts future risk to suicidal ideation from social media data

Arunima Roy et al. NPJ Digit Med. .

Abstract

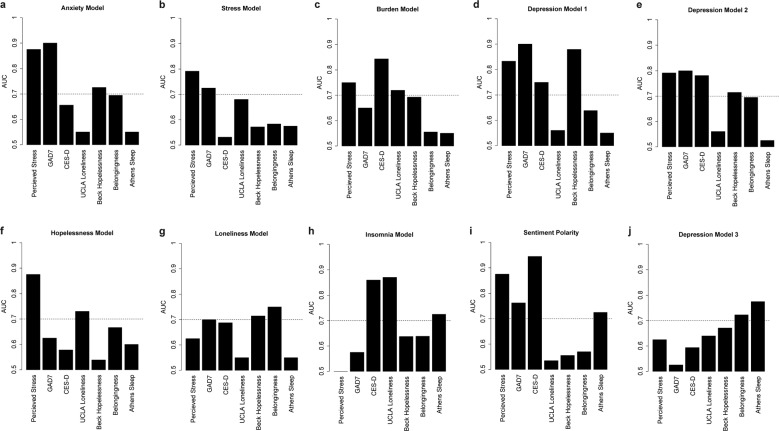
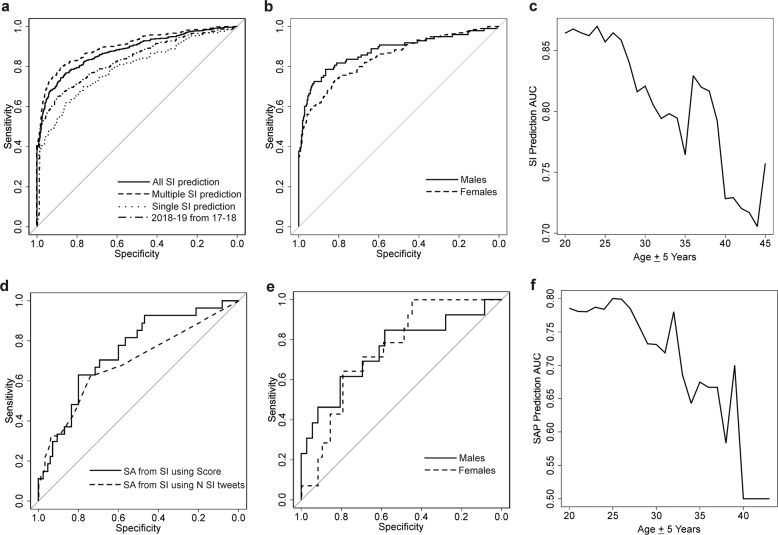
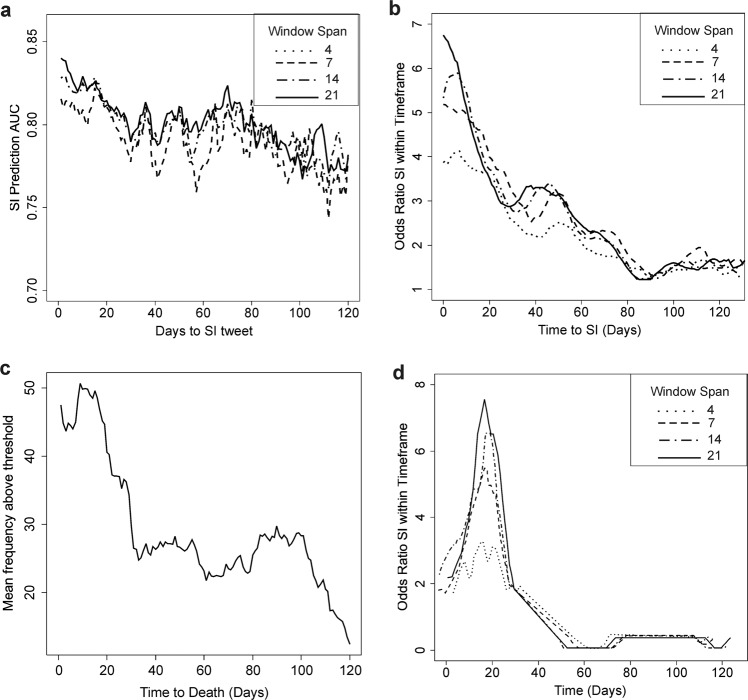
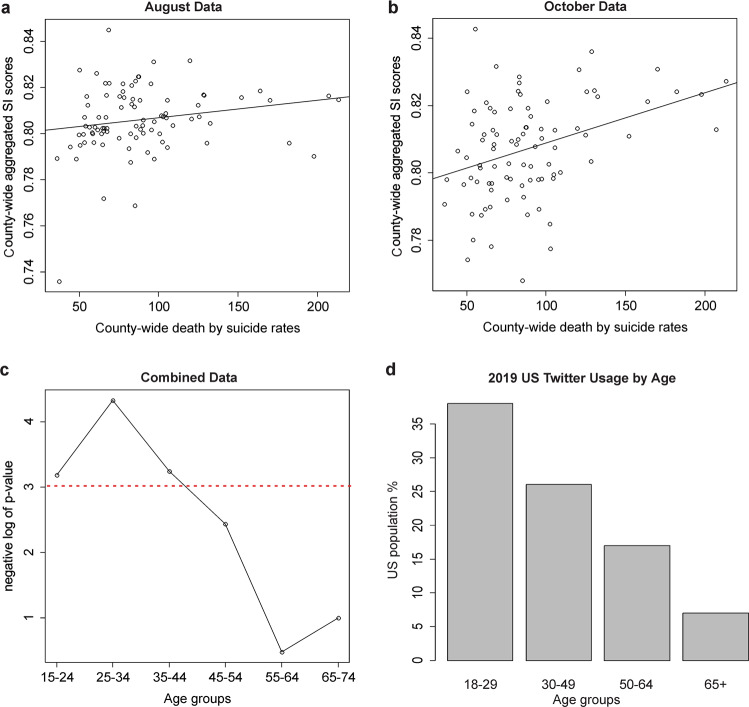
Machine learning analysis of social media data represents a promising way to capture longitudinal environmental influences contributing to individual risk for suicidal thoughts and behaviors. Our objective was to generate an algorithm termed "Suicide Artificial Intelligence Prediction Heuristic (SAIPH)" capable of predicting future risk to suicidal thought by analyzing publicly available Twitter data. We trained a series of neural networks on Twitter data queried against suicide associated psychological constructs including burden, stress, loneliness, hopelessness, insomnia, depression, and anxiety. Using 512,526 tweets from N = 283 suicidal ideation (SI) cases and 3,518,494 tweets from 2655 controls, we then trained a random forest model using neural network outputs to predict binary SI status. The model predicted N = 830 SI events derived from an independent set of 277 suicidal ideators relative to N = 3159 control events in all non-SI individuals with an AUC of 0.88 (95% CI 0.86-0.90). Using an alternative approach, our model generates temporal prediction of risk such that peak occurrences above an individual specific threshold denote a ~7 fold increased risk for SI within the following 10 days (OR = 6.7 ± 1.1, P = 9 × 10-71). We validated our model using regionally obtained Twitter data and observed significant associations of algorithm SI scores with county-wide suicide death rates across 16 days in August and in October, 2019, most significantly in younger individuals. Algorithmic approaches like SAIPH have the potential to identify individual future SI risk and could be easily adapted as clinical decision tools aiding suicide screening and risk monitoring using available technologies.

Keywords: Predictive markers; Psychiatric disorders; Risk factors.


Conflict of interest statement

Competing interestsThe authors have entered into a research partnership with TryCycle Data Systems Inc. on November 14, 2019 to evaluate the efficacy of the above algorithm at identifying SI risk in a clinical setting. This evaluation and the relationship are independent from the work as reported in this journal article. In addition, the authors declare that they do not have any other relationship with the company, and that no financial transactions are involved in this partnership.

Figures

Fig. 1
Fig. 1. Neural network model performance to rate binary construct scales.
Bar plots of the AUC of the ROC curve (y-axis) for neural network based classification of binary statement data adapted from various scales (x-axis) psychometrically validated to rate psychological constructs for the anxiety model (a), stress model (b), burden model (c), depression model 1 (d), depression model 2 (e), hopelessness model (f), loneliness model (g), insomnia model (h), sentiment analysis polarity metric (i), depression model 3 (j). A horizontal dashed line depicts an AUC of 70% accuracy. Binary adaptations of scales appear in Supplementary Table 3.
Fig. 2
Fig. 2. ROC curves for prediction of SI and SA.
a Sensitivity (y axis) and specificity (x axis) is depicted for the prediction of individuals having expressed SI events as compared to controls in the in the original training and test sets across all individuals (straight line), individuals with multiple expressions of SI (dashed line) and those with only a single SI event (dotted line). Prediction of all SI individuals derived from August 2018 to May 2019 using models trained on data derived prior to August 2018 (variable dashed line). b Sensitivity (y axis) and specificity (x axis) is depicted for the prediction of individuals having expressed SI events as compared to controls in the in the original training and test sets across men (straight line) and women (dashed line). c The AUC of SI prediction (y axis) as a function of a sliding window of 10 year age groups centered on the x axis value (x axis). d Sensitivity (y axis) and specificity (x axis) is depicted for the prediction of individuals having expressed past suicide attempts or plans (SAP) from all non-SI individuals using the model score (straight line), from individuals with SI using the model score (dashed line), and from individuals with SI using the number of expressed SI tweets (dotted line). e Sensitivity (y axis) and specificity (x axis) is depicted for the prediction of SAP individuals from non-SI individuals in men (straight line) and women (dashed line). f The AUC of SAP status prediction (y axis) as a function of a sliding window of 10 year age groups centered on the x axis value (x axis).
Fig. 3
Fig. 3. Temporal prediction of suicide risk.
a A plot depicting the AUC of SI event prediction (y axis) as a function of the starting time from which tweet data was processed (x axis) for average model score data deriving from 4, 7, 14, and 21 days. b A plot depicting the OR that an SI event will occur (y axis) as a function of the starting time from which tweet data was processed (x axis) for frequency scores above each individual’s person specific threshold deriving from 4, 7, 14, and 21 days window analysis. c A plot depicting the mean frequency score per individual in N = 8 suicide decedents using a 21 day window span (y axis) as a function of time in days from death by suicide (x axis). d A plot depicting the OR of death by suicide (y axis) as a function of the starting time from which tweet data was processed (x axis) for frequency scores above each individual’s person specific threshold in N = 8 suicide decedents deriving from 4, 7, 14, and 21 days window analysis. Only significant logistic model data below a p value of 0.05 are depicted.
Fig. 4
Fig. 4. Association of SI score with county-wide suicide death rates.
Scatterplots of the 2017 county-wide suicide death rate (x axis) as a function of the mean SI score of tweets collected within that county from a 16 day period in August (a) and October (b). A plot depicting the negative natural log of the p value of Kendall’s association between mean SI score per county (y axis) and the crude rate per age group (x axis) (c). The horizontal dashed red line depicts a p value of 0.05. A bar plot of the percentage of the US population using Twitter in 2019 based on data obtained from Statista (www.statista.com) (d).

Similar articles

Cited by

References

    1. Centers for Disease Control and Prevention. (2013) WISQARS Database. Retrieved from: https://www.cdc.gov/injury/wisqars/index.html.
    1. National Institutes of Mental Health (2019), Conducting research with participants at elevated risk for suicide: considerations for researchers. Retrieved from: https://www.nimh.nih.gov/funding/clinical-research/conducting-research-w....
    1. Belfor EL, Mezzacappa E, Ginnis K. Similarities and differences among adolescents who communicate suicidality to others via electronic versus other means: a pilot study. Adolesc. Psychiatry. 2012;2:258–262. doi: 10.2174/2210676611202030258. - DOI
    1. Marchant A, et al. A systematic review of the relationship between internet use, self-harm and suicidal behaviour in young people: the good, the bad and the unknown. PLoS ONE. 2017;12:e0181722. doi: 10.1371/journal.pone.0181722. - DOI - PMC - PubMed
    1. Ruder TD, Hatch GM, Ampanozi G, Thali MJ, Fischer N. Suicide announcement on Facebook. Crisis. 2011;32:280–282. doi: 10.1027/0227-5910/a000086. - DOI - PubMed