. 2020 Jun 26;40(6):BSR20194324.
doi: 10.1042/BSR20194324.

Identification of metastasis and prognosis-associated genes for serous ovarian cancer

Affiliations

Identification of metastasis and prognosis-associated genes for serous ovarian cancer

Yijun Yang et al. Biosci Rep. .

Abstract

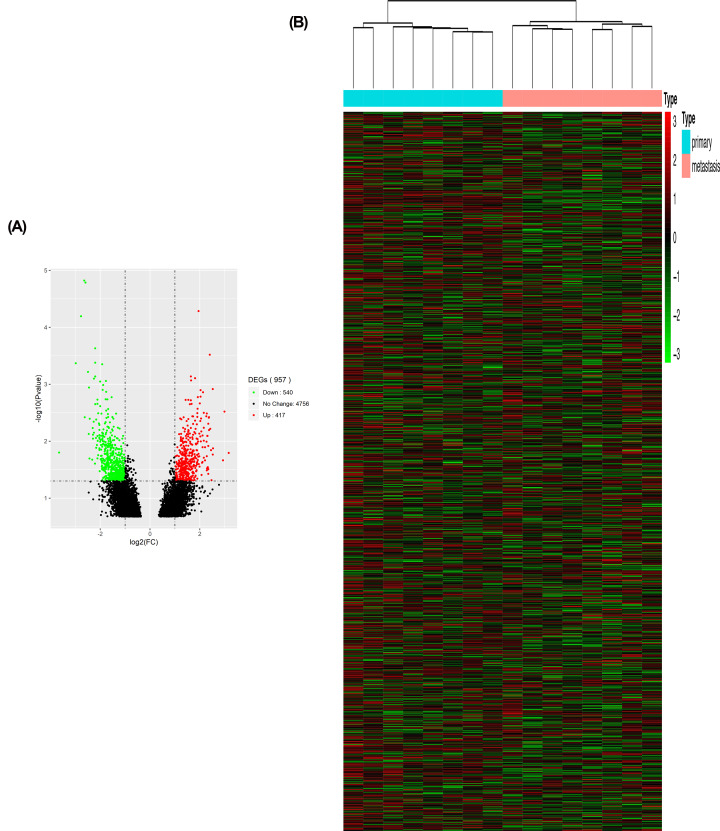
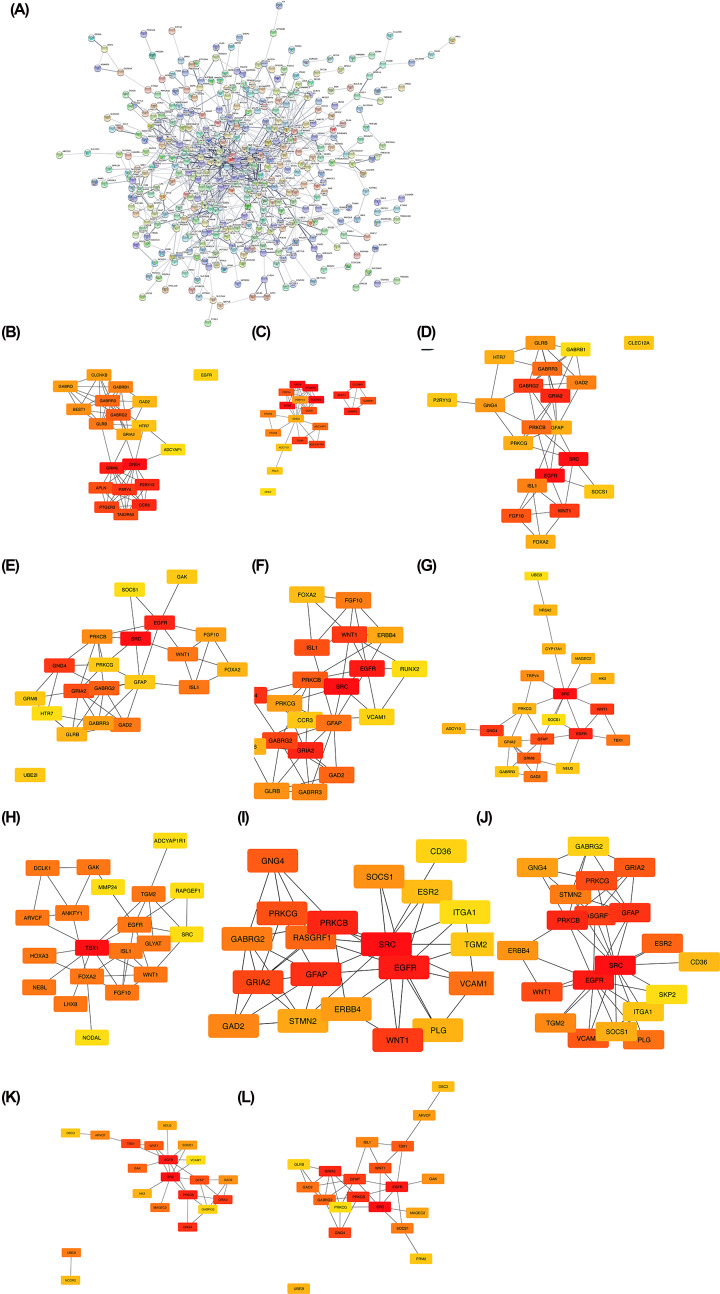
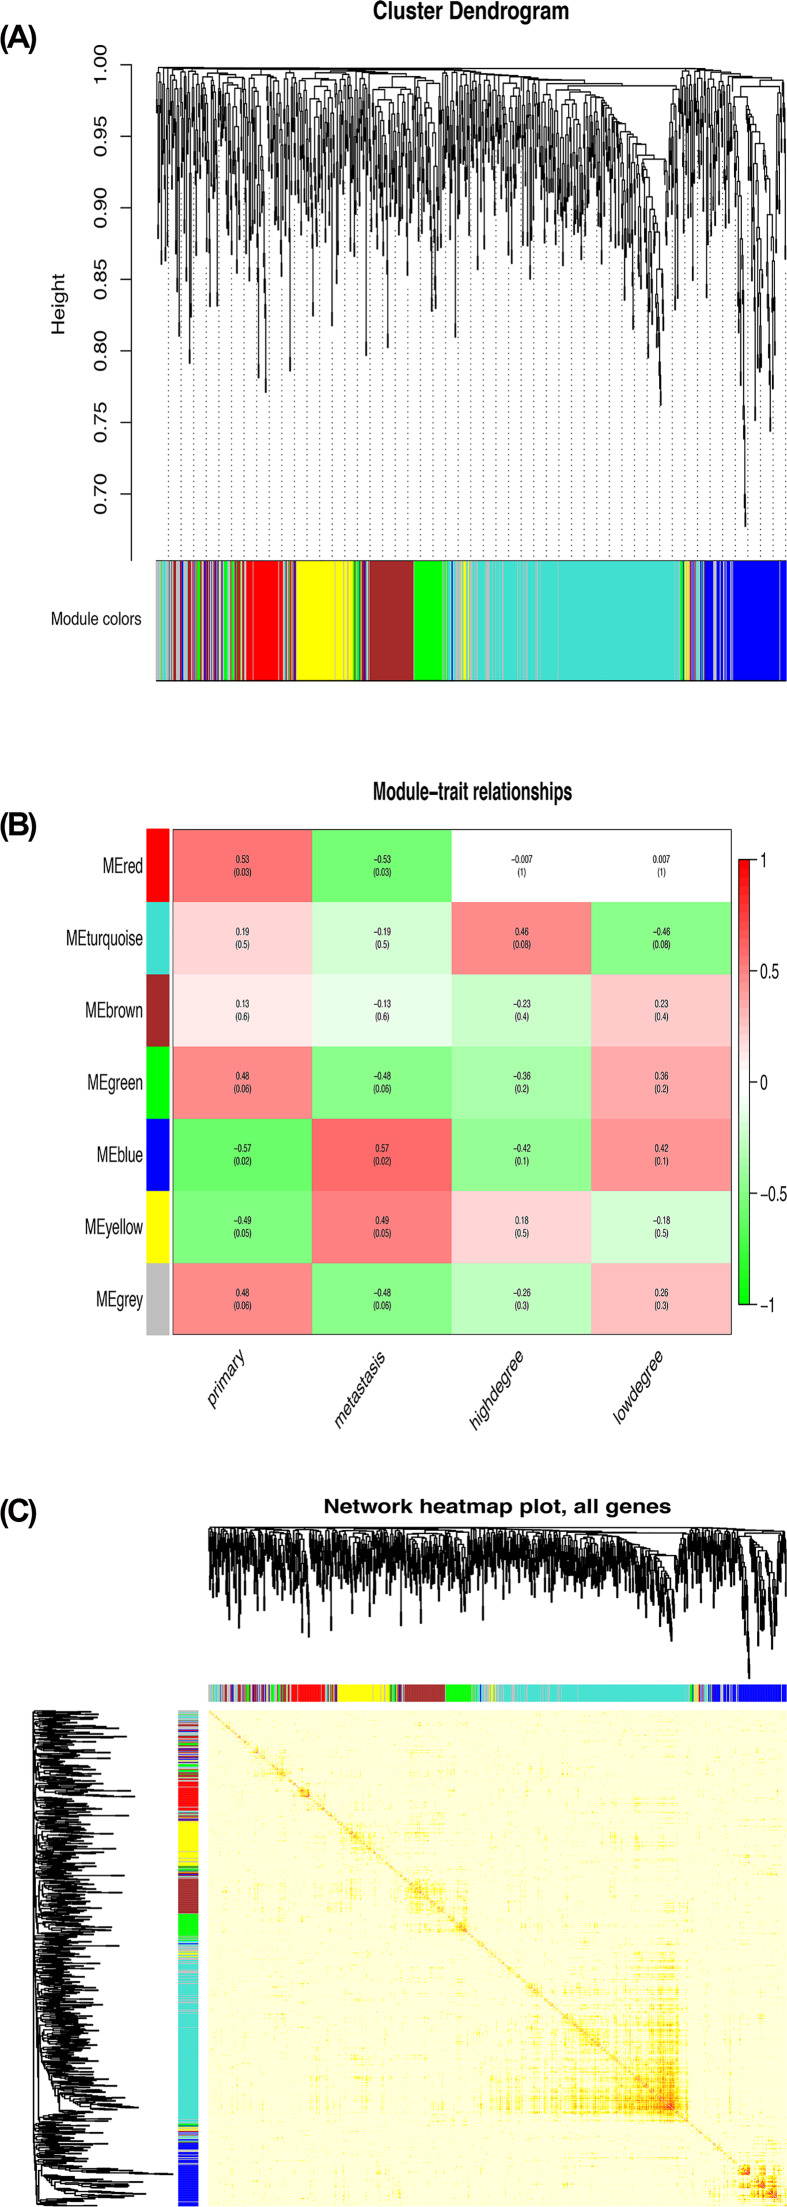
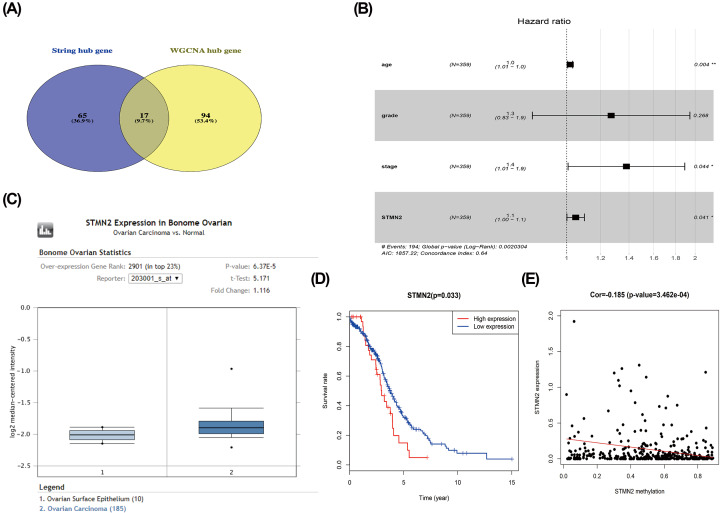
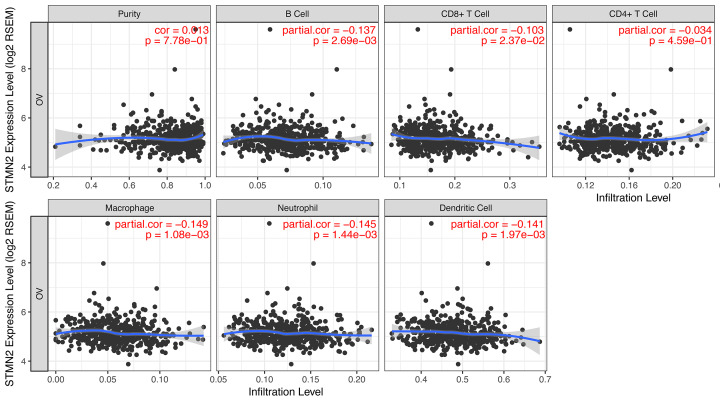
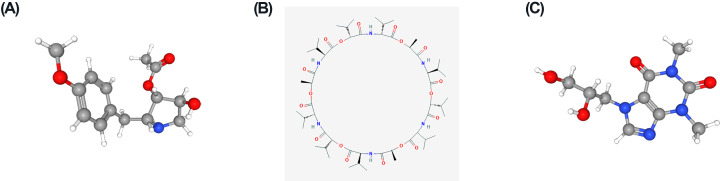
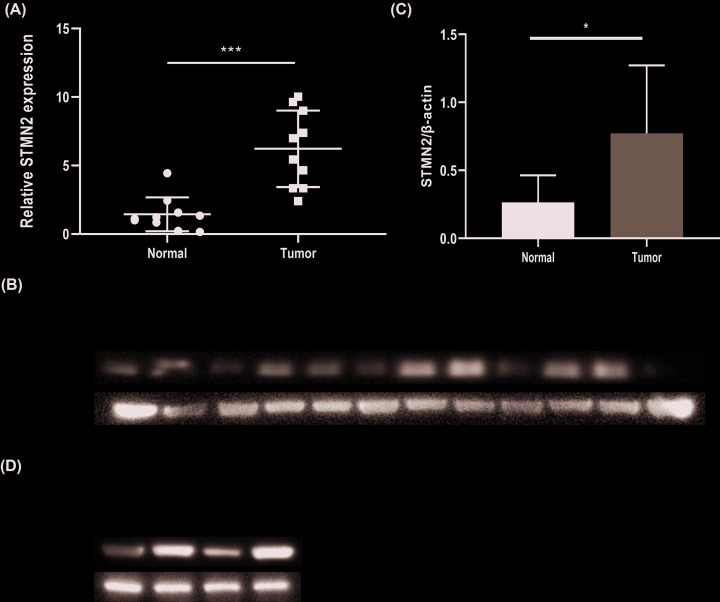
Serous ovarian cancer is one of the most fatal gynecological tumors with an extremely low 5-year survival rate. Most patients are diagnosed at an advanced stage with wide metastasis. The dysregulation of genes serves an important role in the metastasis progression of ovarian cancer. Differentially expressed genes (DEGs) between primary tumors and metastases of serous ovarian cancer were screened out in the gene expression profile of GSE73168 from Gene Expression Omnibus (GEO). Cytoscape plugin cytoHubba and weighted gene co-expression network analysis (WGCNA) were utilized to select hub genes. Univariate and multivariate Cox regression analyses were used to screen out prognosis-associated genes. Furthermore, the Oncomine validation, prognostic analysis, methylation mechanism, gene set enrichment analysis (GSEA), TIMER database analysis and administration of candidate molecular drugs were conducted for hub genes. Nine hundred and fifty-seven DEGs were identified in the gene expression profile of GSE73168. After using Cytoscape plugin cytoHubba, 83 genes were verified. In co-expression network, the blue module was most closely related to tumor metastasis. Furthermore, the genes in Cytoscape were analyzed, showing that the blue module and screened 17 genes were closely associated with tumor metastasis. Univariate and multivariate Cox regression revealed that the age, stage and STMN2 were independent prognostic factors. The Cancer Genome Atlas (TCGA) suggested that the up-regulated expression of STMN2 was related to poor prognosis of ovarian cancer. Thus, STMN2 was considered as a new key gene after expression validation, survival analysis and TIMER database validation. GSEA confirmed that STMN2 was probably involved in ECM receptor interaction, focal adhesion, TGF beta signaling pathway and MAPK signaling pathway. Furthermore, three candidate small molecule drugs for tumor metastasis (diprophylline, valinomycin and anisomycin) were screened out. The quantitative reverse transcription-polymerase chain reaction (qRT-PCR) and western blot showed that STMN2 was highly expressed in ovarian cancer tissue and ovarian cancer cell lines. Further studies are needed to investigate these prognosis-associated genes for new therapy target.

Keywords: TIMER database analysis; bioinformatics analysis; prognosis; serous ovarian cancer; tumor metastasis; weighted gene coexpression network analysis (WGCNA).


Conflict of interest statement

The authors declare that there are no competing interests associated with the manuscript.

Figures

Figure 1
Figure 1. DEGs identified in GSE73168
(A) Volcano map of DEGs between primary tumors and metastases of serous ovarian cancer. The red plots in the volcano represent up-regulation and the green points represent down-regulation. (B) Heatmap of the all DEGs according to the value of |log FC|. The color in heat maps from green to red shows the progression from low expression to high expression cell. log FC: log fold change.
Figure 2
Figure 2. CytoHubba analysis of PPI network
(A) 957 DEGs were filtered into the DEGs PPI network complex that contained 514 node and 842 side. (B) Maximal Clique Centrality methods in cytoHubba. (C) Betweenness methods in cytoHubba. (D) Bottleneck methods in cytoHubba. (E) Closeness methods in cytoHubba. (F) Degree methods in cytoHubba. (G) Density of maximum neighborhood component methods in cytoHubba. (H) EcCentricity methods in cytoHubba. (I) Edge percolated component methods in cytoHubba. (J) Maximum neighborhood component methods in cytoHubba. (K) Radiality methods in cytoHubba. (L) Stress methods in cytoHubba.
Figure 3
Figure 3. Hub module selection
(A) Dendrogram of all DEGs clustered based on a dissimilarity measure (1-TOM). (B) Correlation between modules and traits. The upper number in each cell refers to the correlation coefficient of each module in the trait, and the lower number is the corresponding P-value. Among them, the blue module was the most relevant modules with cancer traits. (C) A heatmap of all genes. The intensity of the red color indicates the strength of the correlation between pairs of modules on a linear scale.
Figure 4
Figure 4. Hub genes analysis
(A) Real key genes belonging to both the blue module and the PPI network. (B) Univariate Cox regression analysis to predict prognostic factors associated with patient survival. (C) Expression boxplots of gene STMN2 in Oncomine database. (D) Survival analysis of STMN2. (E) The expression of STMN2 was negatively correlated with DNA methylation.
Figure 5
Figure 5. STMN2 expression negatively correlates with immune cell infiltration levels in ovarian cancer through TIMER
Correlation between STMN2 expression and the abundances of six immune infiltrates (B cells, CD4+ T cells, CD8+ T cells, neutrophils, macrophages, and dendritic cells) are displayed. The purity-corrected partial Spearman correlation and statistical significance are shown on the top right corners.
Figure 6
Figure 6. The tomographs of the three candidate small molecule drugs for the metastasis
(A) Diprophylline, (B) valinomycin, and (C) anisomycin.
Figure 7
Figure 7. STMN2 is high expression in ovarian cancer tissue and cell lines
(A) qRT-PCR showed that STMN2 was overexpressed in ovarian cancer tissue campared with normal ovarian tissue. (B,C) Western blot experiment showed that STMN2 was overexpressed in ovarian cancer tissue. (D) Western blot showed high expression of STMN2 in ovarian cancer cell lines.

References

    1. Siegel R.L., Miller K.D. and Jemal A. (2019) Cancer statistics, 2019. CA Cancer J. Clin. 69, 7–34 10.3322/caac.21551 - DOI - PubMed
    1. Jimenez-Sanchez A., Memon D., Pourpe S. et al. . (2017) Heterogeneous tumor-immune microenvironments among differentially growing metastases in an ovarian cancer patient. Cell 170, 927.e920–938.e920 10.1016/j.cell.2017.07.025 - DOI - PMC - PubMed
    1. Matz M., Coleman M.P., Carreira H. et al. . (2017) Worldwide comparison of ovarian cancer survival: histological group and stage at diagnosis (CONCORD-2). Gynecol. Oncol. 144, 396–404 10.1016/j.ygyno.2016.11.019 - DOI - PMC - PubMed
    1. Xia L., Su X., Shen J. et al. . (2018) ANLN functions as a key candidate gene in cervical cancer as determined by integrated bioinformatic analysis. Cancer Manag. Res. 10, 663–670 10.2147/CMAR.S162813 - DOI - PMC - PubMed
    1. Yuan L., Zeng G., Chen L. et al. . (2018) Identification of key genes and pathways in human clear cell renal cell carcinoma (ccRCC) by co-expression analysis. Int. J. Biol. Sci. 14, 266–279 10.7150/ijbs.23574 - DOI - PMC - PubMed

Publication types

MeSH terms