

Myeloid cells protect intestinal epithelial barrier integrity through the angiogenin/plexin-B2 axis
- PMID: 32510170
- PMCID: PMC7327495
- DOI: 10.15252/embj.2019103325
Myeloid cells protect intestinal epithelial barrier integrity through the angiogenin/plexin-B2 axis
Abstract
Communication between myeloid cells and epithelium plays critical role in maintaining intestinal epithelial barrier integrity. Myeloid cells interact with intestinal epithelial cells (IECs) by producing various mediators; however, the molecules mediating their crosstalk remain incompletely understood. Here, we report that deficiency of angiogenin (Ang) in mouse myeloid cells caused impairment of epithelial barrier integrity, leading to high susceptibility to DSS-induced colitis. Mechanistically, myeloid cell-derived angiogenin promoted IEC survival and proliferation through plexin-B2-mediated production of tRNA-derived stress-induced small RNA (tiRNA) and transcription of ribosomal RNA (rRNA), respectively. Moreover, treatment with recombinant angiogenin significantly attenuated the severity of experimental colitis. In human samples, the expression of angiogenin was significantly down-regulated in patients with inflammatory bowel disease (IBD). Collectively, we identified, for the first time to our knowledge, a novel mediator of myeloid cell-IEC crosstalk in maintaining epithelial barrier integrity, suggesting that angiogenin may serve as a new preventive agent and therapeutic target for IBD.
Keywords: angiogenin; inflammatory bowel disease; intestinal epithelial cell; myeloid cell.
©2020 The Authors.
Conflict of interest statement
The authors declare that they have no conflict of interest.
Figures
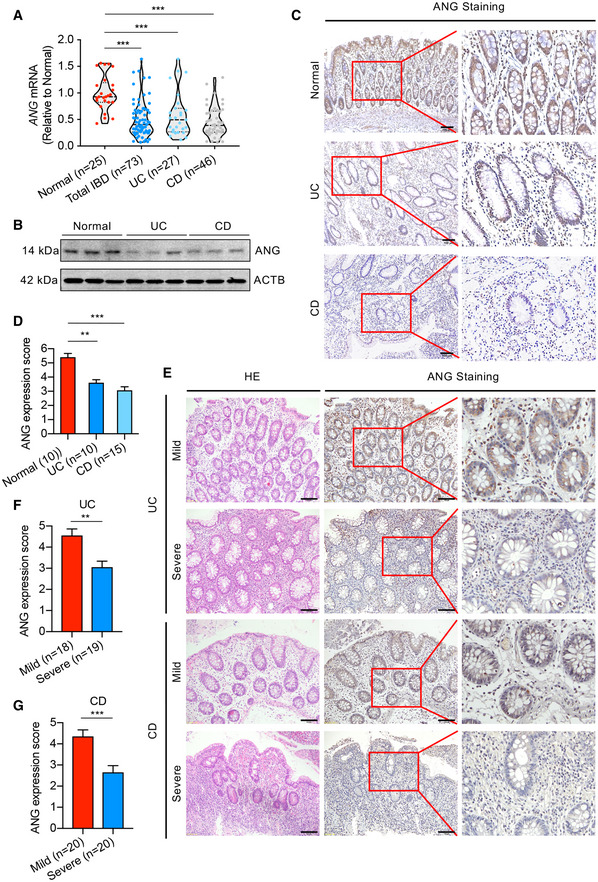
- A
mRNA expression of ANG in colonic tissues from normal controls (n = 25) and UC (n = 27) or CD (n = 46) patients.
- B
Representative Western blotting of ANG in colonic tissues from normal controls and UC or CD patients.
- C
Representative images showing ANG immunohistochemical (IHC) staining in normal control and UC or CD sample.
- D
Corresponding statistical analysis of ANG expression score in normal controls (n = 10) and UC (n = 10) or CD (n = 15) patients.
- E
Representative images showing hematoxylin–eosin (HE) staining and ANG IHC staining in mild and severe IBD samples.
- F, G
Statistical analyses of ANG expression scores in mild (n = 18) and severe (n = 19) UC (F) or mild (n = 20) and severe (n = 20) CD (G) patients.
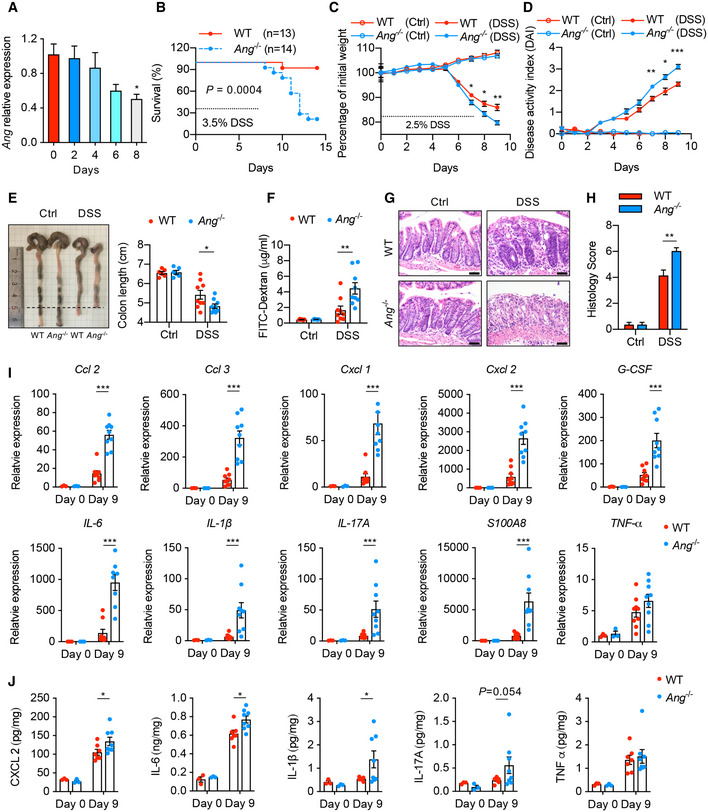
- A
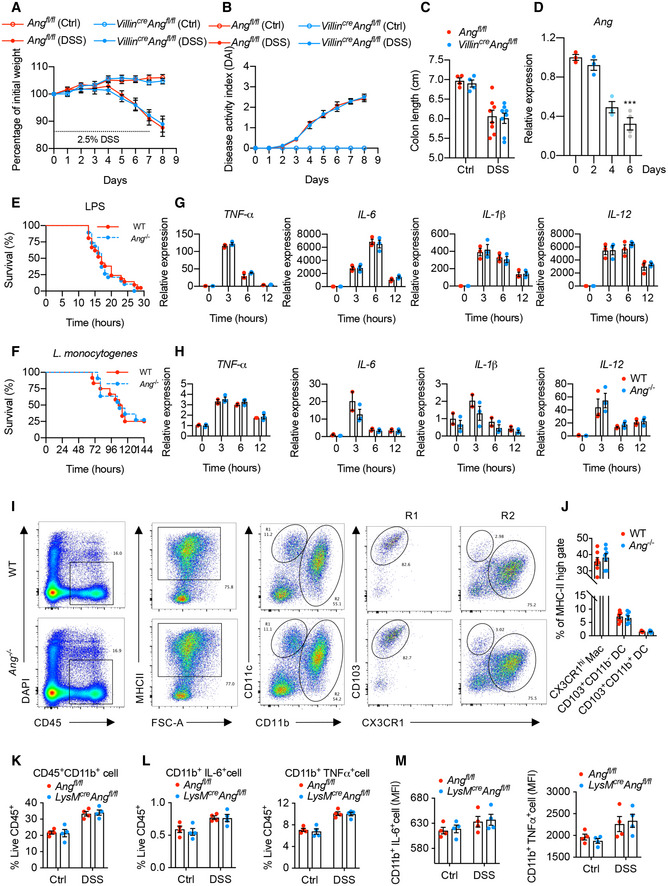
Ang mRNA expression in colonic tissue from 2.5% DSS‐treated WT mice at indicated time point (n = 4 mice/time point).
- B
Kaplan–Meier curve of 3.5% DSS‐treated Ang‐deficient mice (Ang −/−, n = 14) or littermate controls (WT, n = 13).
- C, D
(C) Body weight loss and (D) disease activity index (DAI) of WT and Ang −/− mice with (n = 9) or without (n = 6) 2.5% DSS treatment.
- E–H
(E) Colon length, (F) serum FITC‐dextran level, (G) representative HE staining image, and (H) histopathological score of colonic section from the WT and Ang −/− mice on day 9 with (n = 9) or without (n = 6) 2.5% DSS treatment.
- I
Quantitative mRNA expression of cytokine genes in colonic tissue from the WT and Ang −/− mice on day 0 (n = 3) or day 9 (n = 9) during 2.5% DSS treatment.
- J
Soluble cytokine level in supernatant of cultured colonic tissue isolated from WT and Ang −/− mice on day 0 (n = 3) or day 9 (n = 7) during 2.5% DSS treatment.
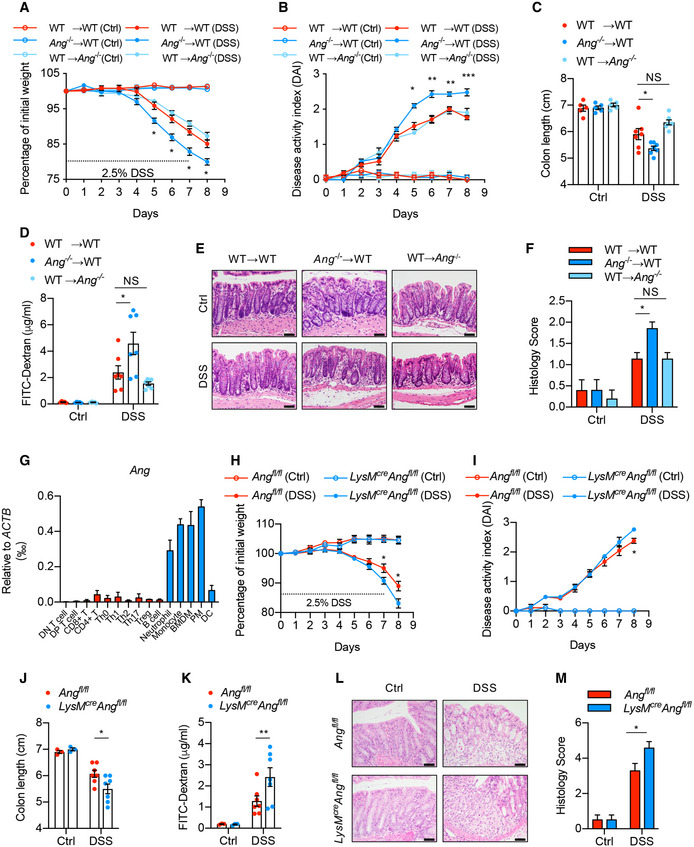
- A, B
(A) Body weight loss and (B) DAI of WT→WT, Ang −/−→WT and WT→Ang −/− chimera mice with (n = 7) or without (n = 5) 2.5% DSS treatment.
- C–F
(C) Colon length, and (D) serum FITC‐dextran level, (E) representative HE staining image, and (F) histopathological score of colonic section from these chimera colitis mice on day 8 with (n = 7) or without (n = 5) 2.5% DSS treatment.
- G
Ang mRNA expression in mouse lymphoid and myeloid cells; data represent two independent experiments (n = 2).
- H, I
(H) Body weight loss and (I) DAI of Ang fl/fl and LyzM cre ;Ang fl/fl mice with (n = 7) or without (n = 3) 2.5% DSS treatment.
- J–M
(J) Colon length, (K) serum FITC‐dextran level, (L) representative HE staining image, and (M) histopathological score of colonic section from the Ang fl/fl and LyzM cre ;Ang fl/fl mice on day 8 with (n = 7) or without (n = 3) 2.5% DSS treatment.
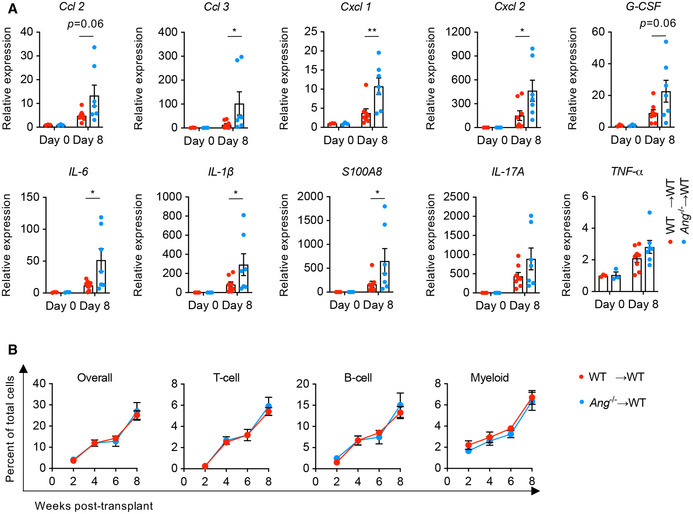
- A
Quantitative mRNA expression of cytokine genes in colonic tissue from WT→WT and Ang −/−→WT chimera mice on day 0 (n = 3) or day 8 (n = 7‐8) during DSS treatment.
- B
Multilineage reconstitution analysis in chimera mice (n = 5).
- A, B
(A) Body weight loss and (B) DAI of Ang fl/fl and Villin cre ;Ang fl/fl mice with (n = 8) or without (n = 5) 2.5% DSS treatment.
- C
Colon length of the Ang fl/fl and Villin cre ;Ang fl/fl mice on day 8 with (n = 8) or without (n = 5) 2.5% DSS treatment.
- D
Ang mRNA expression in colonic myeloid cells from 2.5% DSS‐treated WT mice at indicated time point. (n = 3–4/time point).
- E
Kaplan–Meier curve of WT (n = 21) or Ang −/− (n = 19) mice in LPS‐induced endotoxin shock model.
- F
Kaplan–Meier curves of WT (n = 12) or Ang −/− (n = 12) mice in Listeria monocytogenes (LM)‐induced sepsis model.
- G, H
mRNA expression of cytokine genes in BMDMs from WT or Ang −/− mice administrated with (G) LPS or (H) synthetic RNA duplex poly(I:C) at indicated time point (n = 2–3/time point per group).
- I, J
(I) Representative plot of flow cytometry analysis and (J) the percentages of macrophage and dendritic cell subsets in cLP of WT or Ang −/− mice (n = 6) in steady state.
- K, L
The percentages of CD45+CD11b+ (K), CD11b+IL6+, and CD11b+TNFα+ (L) subsets in LPS‐stimulated cLP of Ang fl/fl or LyzM cre ;Ang fl/fl mice (n = 4) with DSS treatment (day 0 and 4).
- M
MFI of CD11b+IL6+ and CD11b+TNFα+ in LPS‐stimulated cLP of Ang fl/fl or LyzM cre ;Ang fl/fl mice with DSS treatment (day 0 and 4) (n = 4).
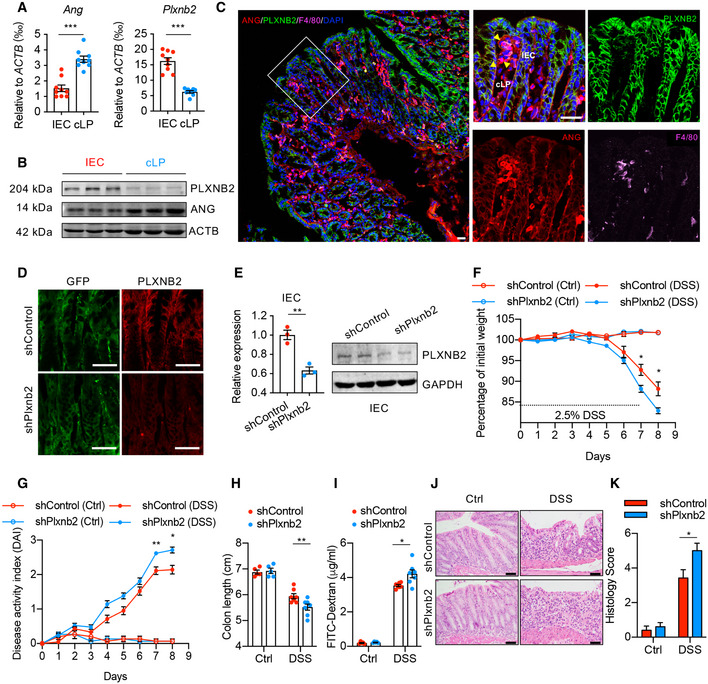
- A, B
(A) Quantitative mRNA expression and (B) Western blotting of ANG and PLXNB2 in isolated IECs or colonic laminar propria (cLP) cells from WT mice (n = 9).
- C
Representative images showing immunofluorescence staining of ANG, PLXNB2, and macrophage surface marker F4/80 in frozen colonic section from WT mice.
- D
Representative images showing immunofluorescence staining of GFP and PLXNB2 in frozen colonic section from WT mice infected with adeno‐associated virus (AAV9).
- E
PLXNB2 expression in IECs from the AAV9‐infected WT mice (n = 3).
- F, G
(F) Body weight loss and (G) DAI of the AA9‐infected WT mice with (n = 7) or without (n = 5) 2.5% DSS treatment.
- H–K
(H) Colon length, (I) serum FITC‐dextran level, (J) representative HE staining image, and (K) histopathological score of colonic section from the AAV9‐infected WT mice on day 8 with (n = 7) or without (n = 5) 2.5% DSS treatment.
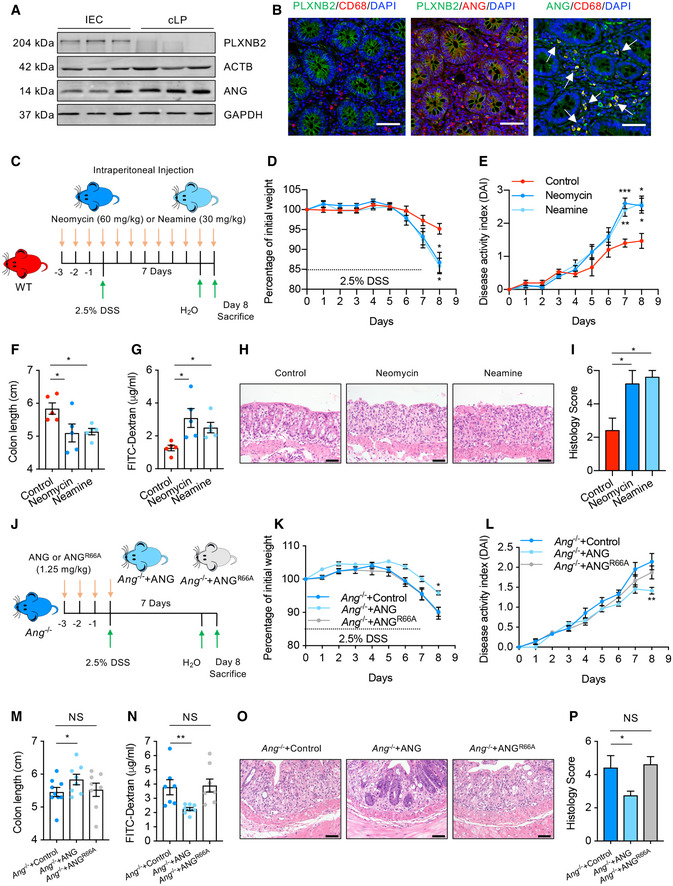
- A
Western blotting of ANG and PLXNB2 in isolated IECs or cLP cells from human colonic tissue.
- B
Representative images showing immunofluorescence staining of ANG, PLXNB2, and macrophage surface marker CD68 in frozen human colonic section derived from the same tissue sample.
- C
Schematic diagram of neomycin or neamine treatment in DSS‐induced colitis model (n = 5).
- D, E
The effects of neomycin or neamine on body weight loss (D) and DAI (E) of WT colitis mice (n = 5).
- F–I
(F) Colon length, (G) serum FITC‐dextran level, (H) representative HE staining image, and (I) histopathological score of colonic section from neomycin‐ or neamine‐treated WT colitis mice on day 8 (n = 5).
- J
Schematic diagram of the ANG rescue experiment in Ang −/− colitis mice. The mice were pre‐treated with 1.25 mg/kg recombinant ANGWT or ANGR66A protein and then subjected to DSS induction (n = 8).
- K, L
(K) Body weight loss and (L) DAI of the ANGWT‐ or ANGR66A‐ pre‐treated Ang −/− colitis mice (n = 8).
- M–P
(M) Colon length, (N) serum FITC‐dextran level, (O) representative HE staining image, and (P) histopathological scores of colonic section from ANGWT‐ or ANGR66A‐pre‐treated Ang −/− colitis mice (n = 8) on day 8.
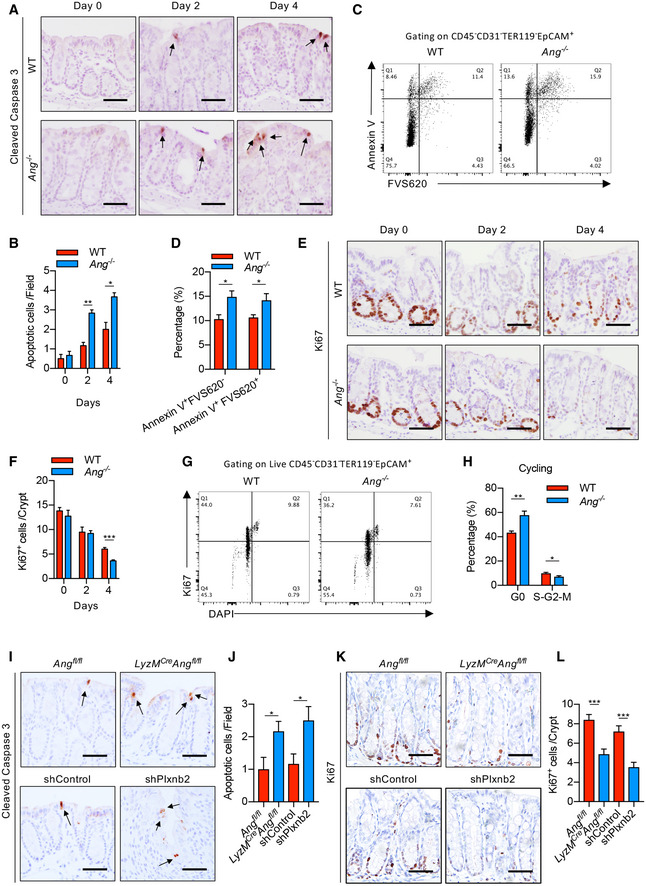
- A, B
(A) Representative images showing cleaved‐caspase 3 staining and (B) the number of apoptotic cells in colonic section from WT or Ang −/− colitis mice (n = 3) at indicated time point; arrows indicate cleaved‐caspase three positive cells; two fields per colon section are quantified.
- C, D
Cell apoptotic status of IECs from WT or Ang −/− colitis mice (n = 5) on day 4.
- E, F
(E) Representative images showing Ki67 staining and (F) the number of proliferating cells per crypt in colonic section from WT or Ang −/− colitis mice (n = 3) at indicated time point; five representative crypts per colon section are quantified.
- G, H
Cell cycle status of IECs from WT or Ang −/− colitis mice (n = 5) on day 4.
- I, J
(I) Representative images showing cleaved‐caspase 3 staining and (J) the number of apoptotic cells in colonic section from Ang fl/fl and LyzM Cre ;Ang fl/fl, or AAV‐shControl‐ and AAV‐shPlxnb2‐treated colitis mice on day 4 (n = 3); arrows indicate cleaved‐caspase three positive cells; two fields per colon section are quantified.
- K, L
(K) Ki67 staining and (L) the number of proliferating cells per crypt in representative colonic section from Ang fl/fl and LyzM Cre ;Ang fl/fl, or AAV‐shControl‐ and AAV‐shPlxnb2‐treated colitis mice on day 4 (n = 3); five representative crypts per colon section are quantified.
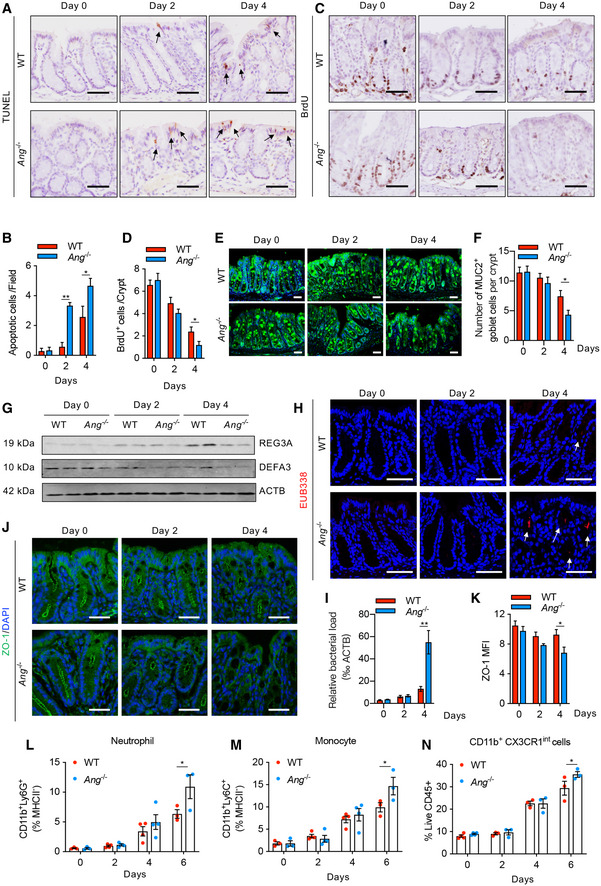
- A, B
(A) TUNEL staining and (B) quantification of apoptotic cells (arrows indicate positive cells; two fields per colon section are quantified; n = 3 mice/group).
- C, D
(C) BrdU incorporation in IECs and (D) quantification of proliferating cells per crypt (five representative crypts per colon section are quantified; n = 3 mice/group).
- E, F
(E) MUC2 staining and (F) quantification of MUC2‐positive cells per crypt (nuclei counterstained with DAPI dye; three representative crypts per colon section are quantified; n = 3 mice/group).
- G
Western blotting of REG3A and DEFA3 in IECs (n = 2 mice/group).
- H
EUB338 staining by fluorescence in situ hybridization (FISH) in crypt (nuclei counterstained with Hoechst dye; arrows indicate positive EUB338 staining).
- I
RT–qPCR quantification of relative bacteria load in fresh colonic tissue (n = 4–6 mice/group).
- J–M
(J) ZO‐1 staining and (K) the corresponding mean fluorescence intensity (MFI) (nuclei counterstained with DAPI dye; three fields per colon section are quantified; n = 3 mice/group). Meanwhile, the percentages of neutrophil (L), monocyte (M) and CD11b+CX3CR1int (N) subsets in cLP of WT or Ang −/− colitis mice were calculated at indicated time point (n = 3–4/time point).
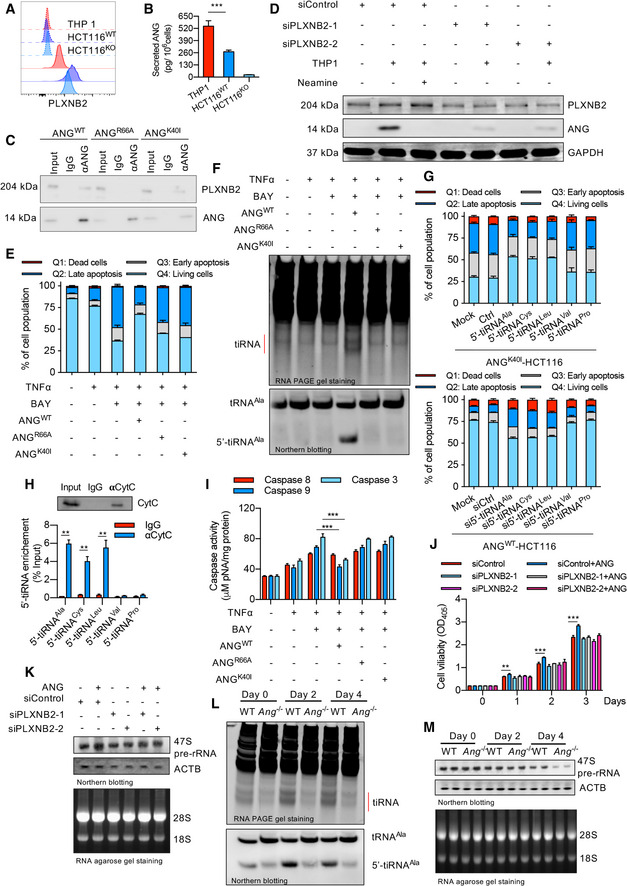
- A
PLXNB2 expressions in HCT116 (including wild type HCT116 (HCT116WT) and ANG knockout HCT116 (HCT116KO)) and THP‐1 as detected by flow cytometry analysis. The upper three dash lines represent the intensity of unstained negative control of these cells, while the solid lines represent the intensity of PLXNB2 antibody staining.
- B
Secreted ANG level in conditioned medium from THP1, HCT116WT, or HCT116KO (n = 3).
- C
The interaction between ANGWT, ANGR66A, or ANGK40I with PLXNB2 in HCT116KO detected by co‐immunoprecipitation assay.
- D
THP‐1‐derived ANG translocating into HCT116KO through PLXNB2 in co‐cultured system as showed by Western blotting.
- E
Flow cytometry analysis of HCT116KO stained with annexin V and PI following different treatments as indicated.
- F
tiRNA and 5′‐tiRNAAla production in HCT116KO following different treatments as indicated.
- G
The effect of 5′‐tiRNA knockdown or overexpression on TNF‐α‐induced apoptosis in ANGWT‐ or ANGK40I‐treated HCT116KO.
- H
The interaction between 5′‐tiRNA and cytochrome c (Cyt c) in HCT116 cells as detected by RIP.
- I
Caspase activity of HCT116KO following different treatments as indicated.
- J
Cell viability of HCT116KO following different treatments as indicated.
- K
Detection of 47S pre‐rRNA transcription level with Northern blotting in HCT116KO following different treatments as indicated.
- L
tiRNA and 5′‐tiRNAAla production in IECs isolated from WT and Ang −/− colitis mice at indicated time point.
- M
47S pre‐rRNA transcription level in IECs from WT and Ang −/− colitis mice at indicated time point.
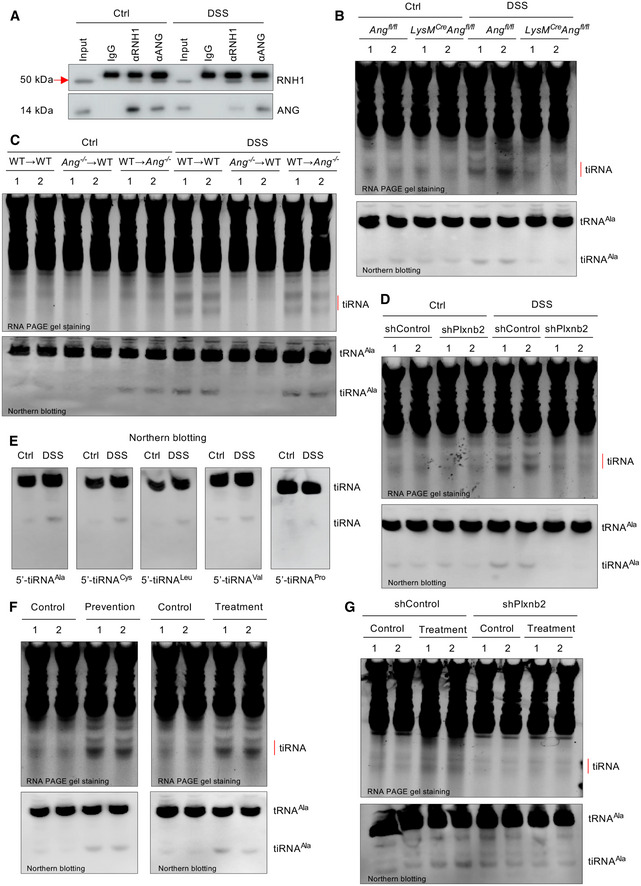
- A
The interaction between ANG and its endogenous inhibitor RNH1 in IECs from DSS‐treated WT mice as detected with co‐immunoprecipitation assay.
- B–D
tiRNA and 5′‐tiRNAAla production in IECs isolated from (B) Ang fl/fl or LyzM cre ;Ang fl/fl, (C) bone marrow chimera or (D) Plxnb2 knockdown mice (n = 2) in response to DSS treatment (day 0, 4).
- E
5′‐tiRNA detection in IECs isolated from DSS‐treated mice (day 6) by Northern blotting.
- F
tiRNA and 5′‐tiRNAAla production in IECs isolated from DSS‐treated mice on day 6 in the ANG prevention or treatment model. The same‐day mice treated with DSS but without ANG supplement serve as a control (n = 2 mice/group).
- G
tiRNA and 5′‐tiRNAAla production in IECs isolated from DSS‐treated WT or Plxnb2 knockdown mice (n = 2) on day 6 with or without ANG injection.
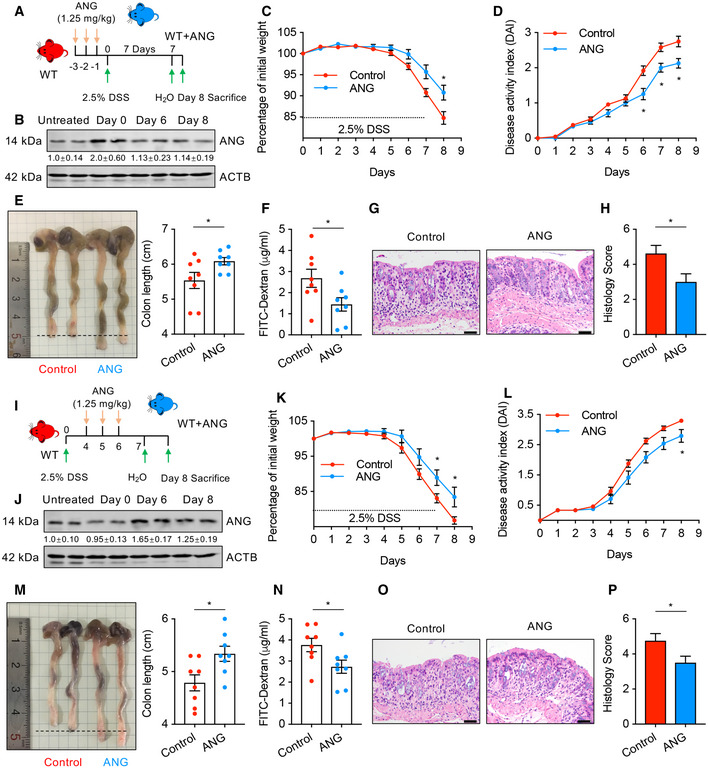
- A
Schematic diagram of the ANG prevention model. Mice (n = 8) were pre‐treated with 1.25 mg/kg recombinant ANG protein and then subjected to DSS induction.
- B
Western blotting of ANG in colonic tissue from WT mice (n = 2) at indicated time point in the ANG prevention model. The grayscale of ANG band in WT mice with no recombinant ANG and DSS treatment (untreated) is arbitrarily set as 1.
- C, D
(C) Body weight loss and (D) DAI of the pre‐treated WT colitis mice (n = 8).
- E–H
(E) Colon length, (F) serum FITC‐dextran level, (G) representative HE staining image, and (H) histopathological score of colon section from the pre‐treated WT colitis mice on day 8 (n = 8).
- I
Schematic diagram of the ANG treatment model. Mice (n = 8) were treated with DSS for 7 days and simultaneously administrated with 1.25 mg/kg recombinant ANG during days 4–6.
- J
Western blotting of ANG in colonic tissue from WT (n = 2) mice at indicated time point in the ANG treatment model. The grayscale of ANG band in WT mice with no recombinant ANG and DSS treatment (untreated) is arbitrarily set as 1.
- K, L
(K) Body weight loss and (L) DAI of the treated WT colitis mice (n = 8).
- M–P
(M) Colon length, (N) serum FITC‐dextran level, (O) representative HE staining image, and (P) histopathological score of colon sections from the treated WT colitis mice on day 8 (n = 8).
References
-
- Atreya R, Mudter J, Finotto S, Mullberg J, Jostock T, Wirtz S, Schutz M, Bartsch B, Holtmann M, Becker C et al (2000) Blockade of interleukin 6 trans signaling suppresses T‐cell resistance against apoptosis in chronic intestinal inflammation: evidence in crohn disease and experimental colitis in vivo . Nat Med 6: 583–588 - PubMed
-
- Bain CC, Scott CL, Uronen‐Hansson H, Gudjonsson S, Jansson O, Grip O, Guilliams M, Malissen B, Agace WW, Mowat AM (2013) Resident and pro‐inflammatory macrophages in the colon represent alternative context‐dependent fates of the same Ly6Chi monocyte precursors. Mucosal Immunol 6: 498–510 - PMC - PubMed
-
- Barker N (2014) Adult intestinal stem cells: critical drivers of epithelial homeostasis and regeneration. Nat Rev Mol Cell Biol 15: 19–33 - PubMed
Publication types
MeSH terms
Substances
Grants and funding
- LY17H160021/Natural Science Foundation of Zhejiang Province (Zhejiang Provincial Natural Science Foundation)
- 81602557/National Natural Science Foundation of China (NSF)
- 81790631/National Natural Science Foundation of China (NSF)
- 31770867/National Natural Science Foundation of China (NSF)
- 2017FZA7006/MOE|Fundamental Research Funds for the Central Universities (Fundamental Research Fund for the Central Universities)
LinkOut - more resources
Full Text Sources
Molecular Biology Databases
Miscellaneous
