. 2020 Nov;20(21-22):e1900359.
doi: 10.1002/pmic.201900359. Epub 2020 Aug 6.

ProTrack: An Interactive Multi-Omics Data Browser for Proteogenomic Studies

Affiliations

ProTrack: An Interactive Multi-Omics Data Browser for Proteogenomic Studies

Anna Pamela Calinawan et al. Proteomics. 2020 Nov.

Abstract

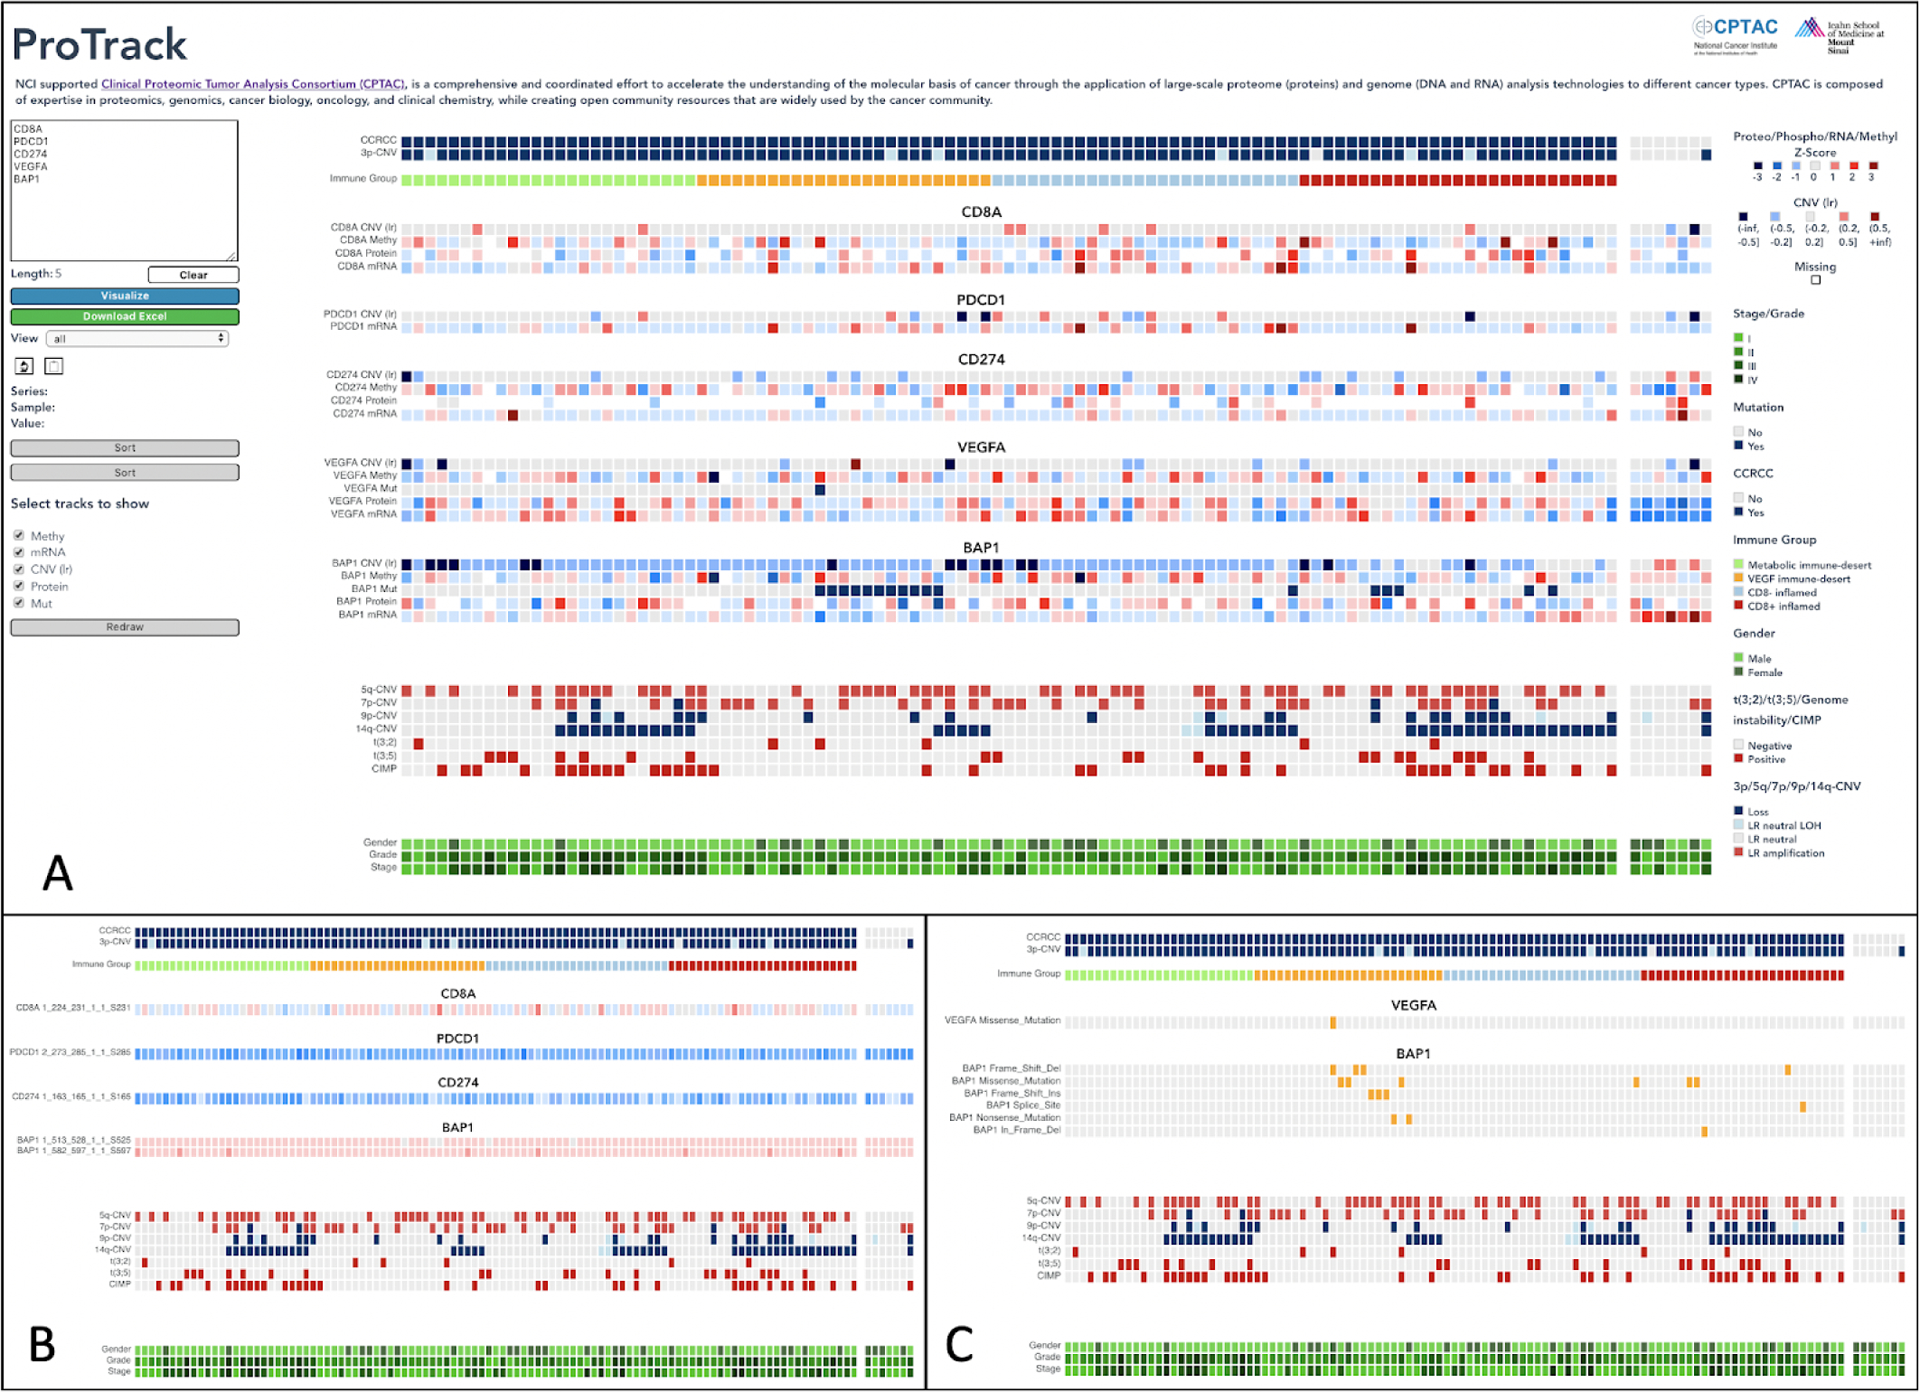
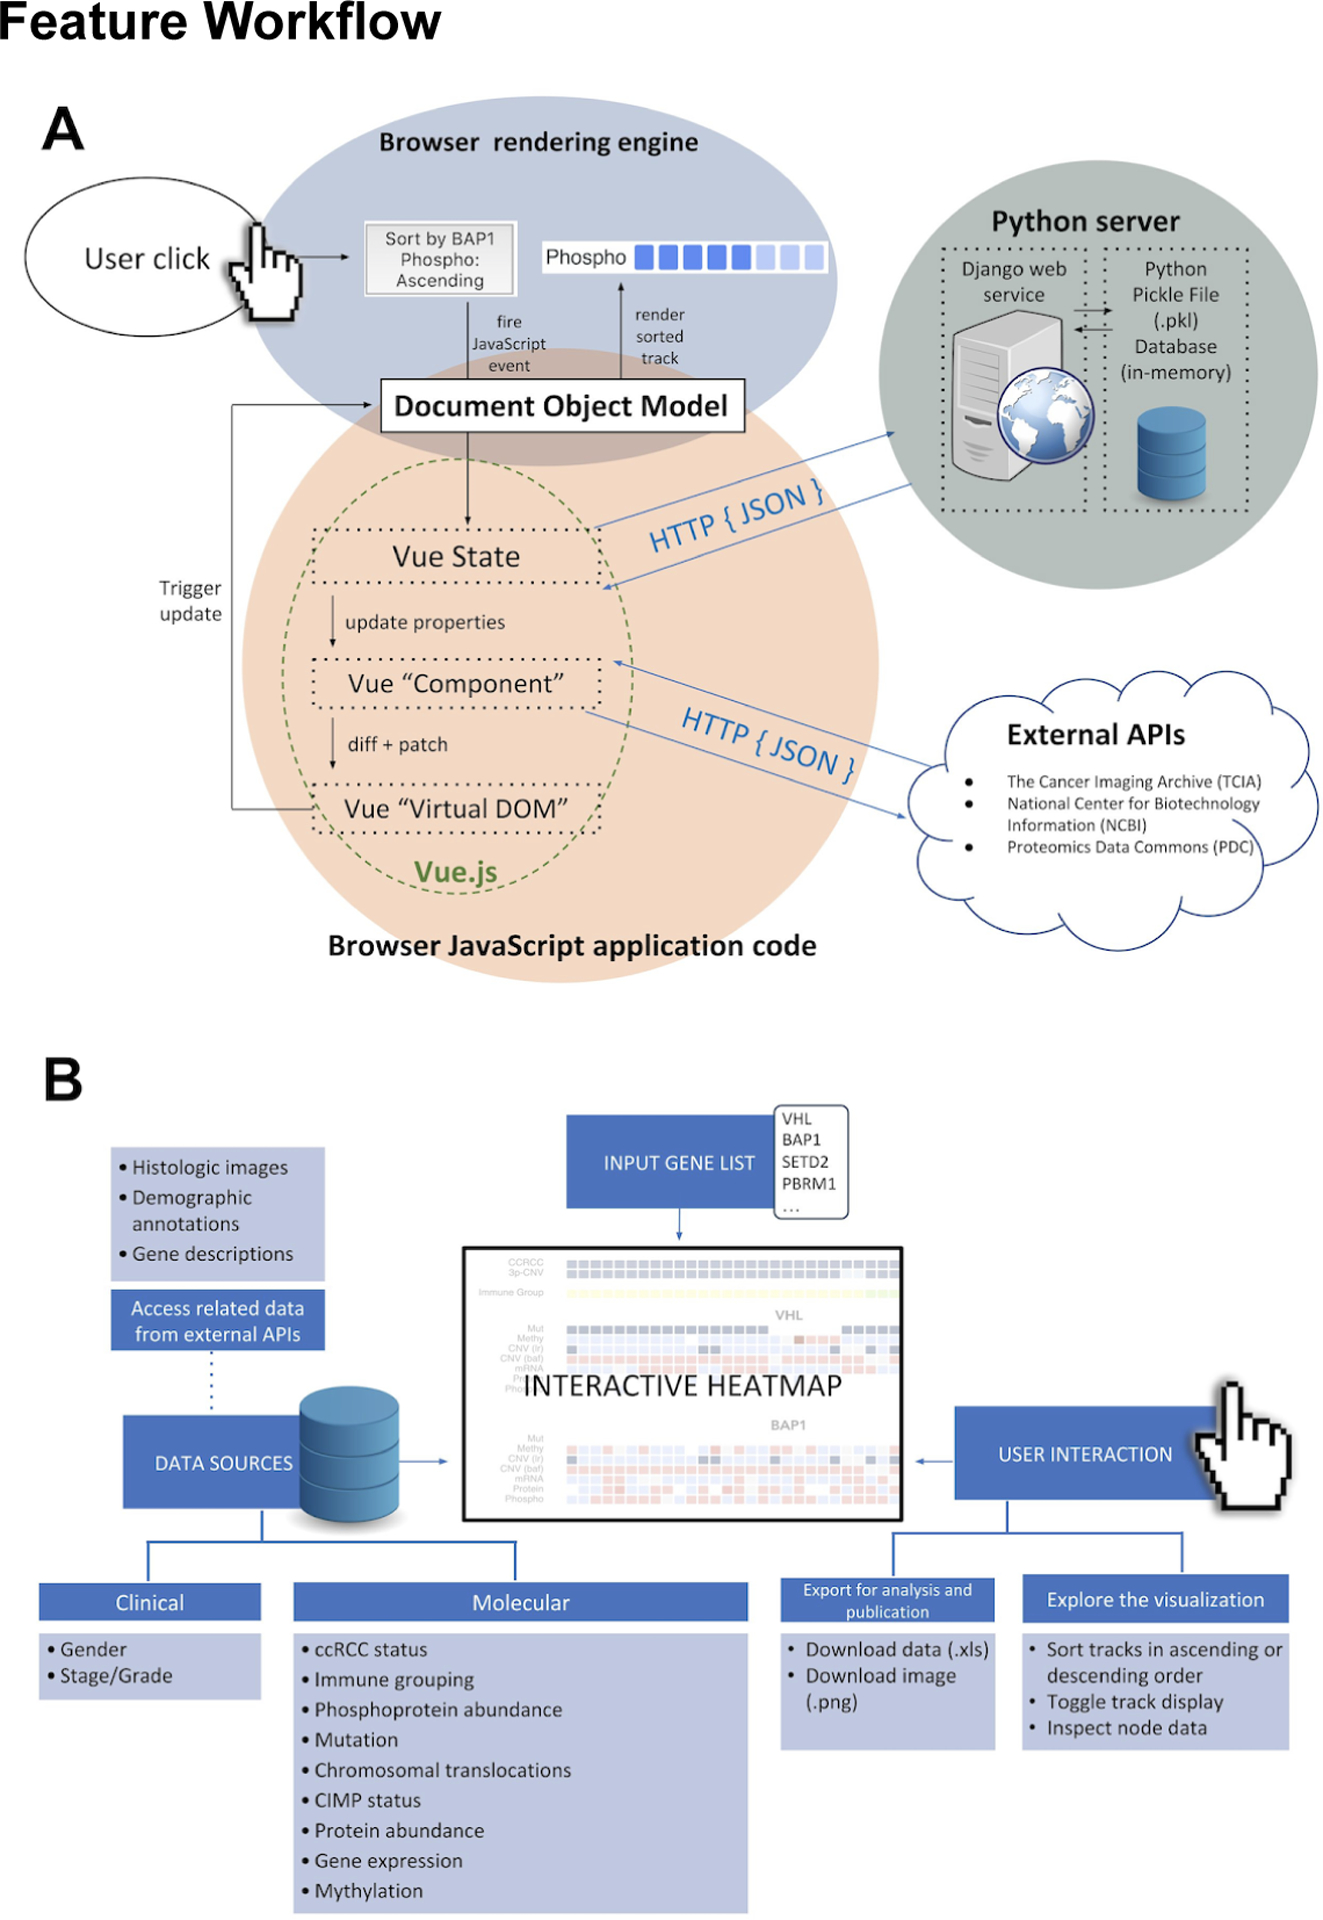
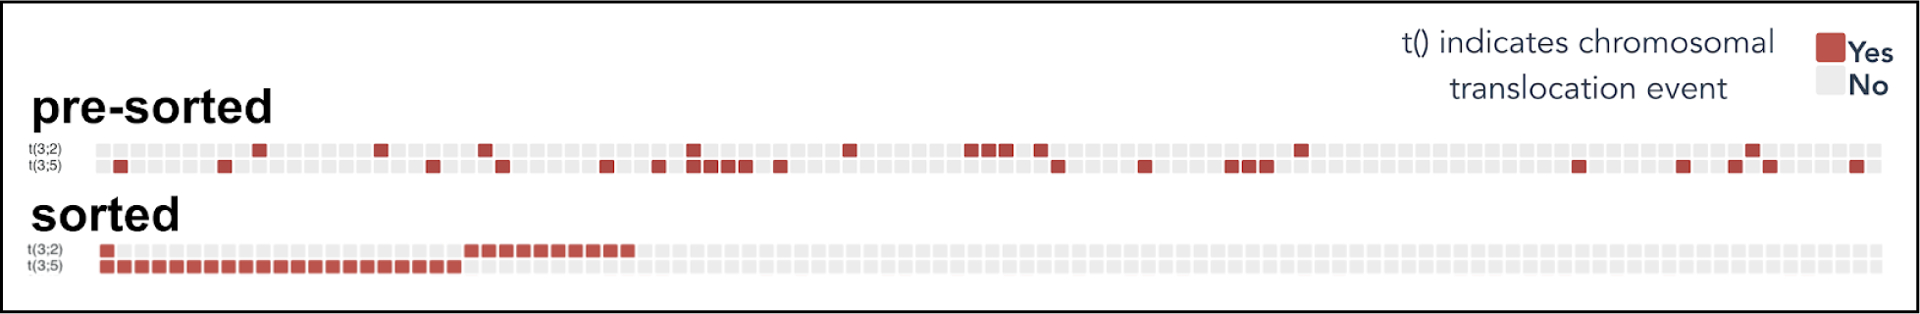
The Clinical Proteomic Tumor Analysis Consortium (CPTAC) initiative has generated extensive multi-omics data resources of deep proteogenomic profiles for multiple cancer types. To enable the broader community of biological and medical researchers to intuitively query, explore, and download data and analysis results from various CPTAC projects, a prototype user-friendly web application called "ProTrack" is built with the CPTAC clear cell renal cell carcinoma (ccRCC) data set (http://ccrcc.cptac-data-view.org). Here the salient features of this application which provides a dynamic, comprehensive, and granular visualization of the rich proteogenomic data is described.


Conflict of interest statement

Conflict of Interest Statement

The authors have no conflict of interest to declare.

Figures

Fig. 1
Fig. 1. Screenshot of ProTrack with additional views.
a) Samples are sorted based on the four immune clusters identified in ccRCC: CD8+ Inflamed Group (red), CD8− Inflamed Group (lightblue), Metabolic Immune Desert (green) and VEGF Immune Desert (yellow). Multi omic data such as mutation profiles, gene expression and protein expression for CD8A, PD-1 (PDCD1), PD-L1 (CD274), VEGFA and BAP1 are shown along with CNV events and clinical information such as grade and stage. b) The same genes are shown with phosphoprotein abundance Z-scores in a phospho view c) The same genes are shown with mutation variants in mutation view. Mutation and phosphoprotein abundance data was not available for all of the genes.
Fig 2
Fig 2
A) A simplified schema of the data flow for a single user action and its flow through the application. In this example, a user clicks a button intending to render a sorted heatmap track. User actions trigger JavaScript functions, as built within the Vue framework. Data transformations occur within the application, while necessary changes to the visual template are calculated by Vue in the “Virtual DOM” layer. This virtual DOM selectively manipulates visual elements on the page, and renders them accordingly. Moreover, the Vue data layer fetches data, when required, from the Python backend with an in-memory static data store. Additional CPTAC data is dynamically fetched from external data sources. B) A summary of the data and interactive features available in ProTrack.
Figure 3
Figure 3
The t(3;2) and t(3;5) translocation events shown here are nearly mutually exclusive, which is not readily shown by the unsorted heatmap. Sorting the heatmap in descending order by t(3;2) followed by descending order by t(3;5) readily demonstrates this mutual exclusivity.

Comment in

References

    1. Clark D, Wang P, Zhang H. Integrated proteogenomic characterization of clear cell renal cell carcinoma. Cell 2019;179:964–983. doi: 10.1016/j.cell.2019.10.007 - DOI - PMC - PubMed
    1. Broom BM B, Akbani R, Weinstein J. A galaxy implementation of next-generation clustered heatmaps for interactive exploration of molecular profiling data. Cancer Res 2017;77:e23–e26. doi: 10.1158/0008-5472.CAN-17-0318. - DOI - PMC - PubMed
    1. Deng M, Saraiva-Agostinho N, Perner S. Firebrowse R: an R client to the Broad Institute’s Firehose pipeline. Database 2017;2017:baw160. doi: 10.1093/database/baw160. - DOI - PMC - PubMed
    1. Hernández-de-Diegol R, Pappas G Jr, Conesa A. PaintOmics 3: a web resource for the pathway analysis and visualization of multi-omics data. Nucleic Acids Research 2018;46:W503–W509. doi: 10.1093/nar/gky466. - DOI - PMC - PubMed
    1. Fernandez N, Hornbeck P, Ma’ayan A. Clustergrammer, a web-based heatmap visualization and analysis tool for high-dimensional biological data. Sci Data. 2017;4:170151. doi: 10.1038/sdata.2017.151. - DOI - PMC - PubMed

Publication types