

Direct binding of polymeric GBP1 to LPS disrupts bacterial cell envelope functions
- PMID: 32510692
- PMCID: PMC7327485
- DOI: 10.15252/embj.2020104926
Direct binding of polymeric GBP1 to LPS disrupts bacterial cell envelope functions
Abstract
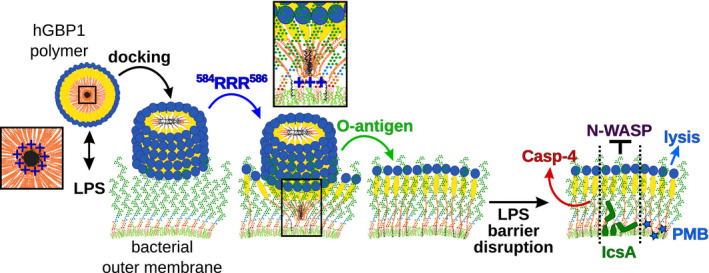
In the outer membrane of gram-negative bacteria, O-antigen segments of lipopolysaccharide (LPS) form a chemomechanical barrier, whereas lipid A moieties anchor LPS molecules. Upon infection, human guanylate binding protein-1 (hGBP1) colocalizes with intracellular gram-negative bacterial pathogens, facilitates bacterial killing, promotes activation of the lipid A sensor caspase-4, and blocks actin-driven dissemination of the enteric pathogen Shigella. The underlying molecular mechanism for hGBP1's diverse antimicrobial functions is unknown. Here, we demonstrate that hGBP1 binds directly to LPS and induces "detergent-like" LPS clustering through protein polymerization. Binding of polymerizing hGBP1 to the bacterial surface disrupts the O-antigen barrier, thereby unmasking lipid A, eliciting caspase-4 recruitment, enhancing antibacterial activity of polymyxin B, and blocking the function of the Shigella outer membrane actin motility factor IcsA. These findings characterize hGBP1 as an LPS-binding surfactant that destabilizes the rigidity of the outer membrane to exert pleiotropic effects on the functionality of gram-negative bacterial cell envelopes.
Keywords: O-antigen; actin-based motility; gram-negative; guanylate binding proteins; lipopolysaccharide.
© 2020 The Authors. Published under the terms of the CC BY NC ND 4.0 license.
Conflict of interest statement
The authors declare that they have no conflict of interest.
Figures
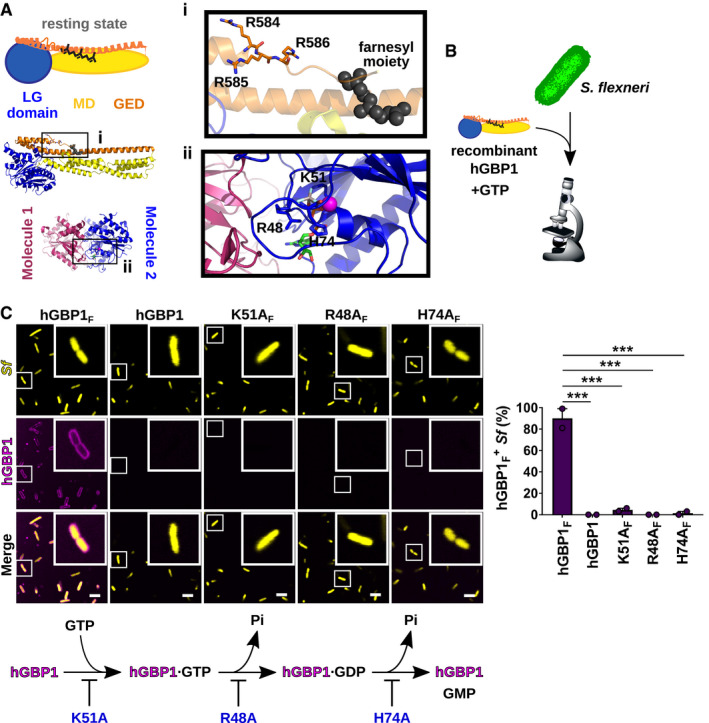
- A
Structure of full‐length, nucleotide‐free, farnesylated hGBP1 (PDB entry 6k1z) and GDP·AlFX‐bound LG‐domain dimer (PDB entry 2B92). Insert (i) shows the farnesyl moiety and the triple arginine stretch (3R = R584–586). Insert (ii) highlights residues required for nucleotide binding and hydrolysis.
- B
Experimental design: fluorescently labeled recombinant hGBP1 variants and nucleotides were mixed with broth‐cultured live or fixed bacteria; bacterial binding was monitored by confocal microscopy.
- C
Confocal images of formaldehyde‐fixed GFP+ S. flexneri following 20 min of incubation with 2 mM GTP and 10 μM Alexa‐Fluor647‐labeled protein. Bacteria associated with hGBP1 mutants after 20 min were quantified. Mean frequencies ± SEM of combined data from two independent experiments are shown. Significance was determined by one‐way ANOVA with Tukey's multiple comparison test. ***P ≤ 0.001. Scale bars equal 5 μm. Flow diagram depicts effects of K51A, R48A, and H74A hGBP1 mutations on nucleotide binding and hydrolysis.
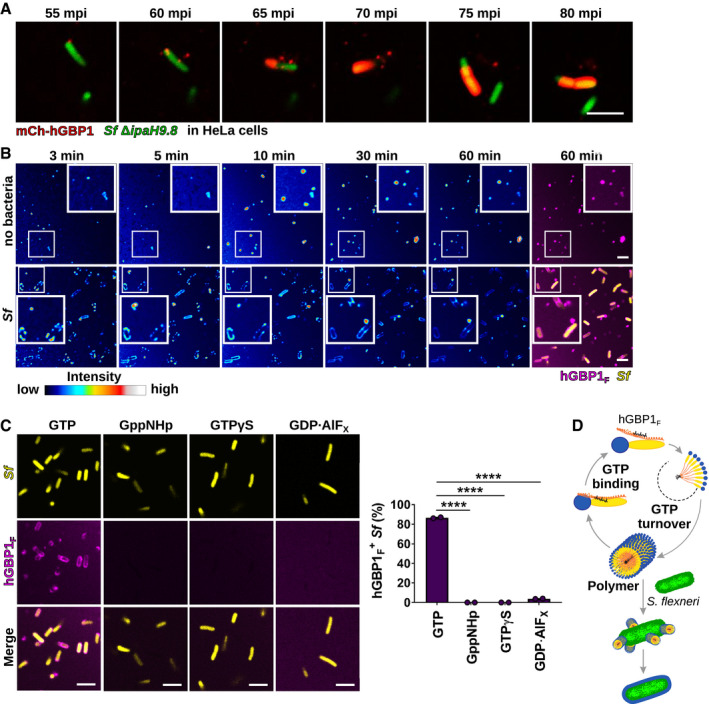
- A
Translocation of ectopically expressed mCherry‐hGBP1 to cytosolic GFP+ Shigella flexneri ΔipaH9.8 in HeLa hGBP1‐KO cells was monitored by time‐lapse microscopy. Individual time frames of Movie EV1 starting at 55 min post‐infection (mpi) are shown.
- B
Confocal time‐lapse microscopy was used to image 10 μM Alexa‐Fluor647‐hGBP1F supplemented with 2 mM GTP in the presence or absence of formaldehyde‐fixed GFP+ S. flexneri. Individual time frames of Movie EV2 depict hGBP1F fluorescence intensity. Merged images of hGBP1F and S. flexneri fluorescence are shown for the 60 min time points.
- C
Images were taken at 45 min after addition of 10 μM Alexa‐Fluor647‐hGBP1F to formaldehyde‐fixed GFP+ S. flexneri in the presence of indicated nucleotides (GTP, natural substrate; GppNHp, non‐hydrolysable GTP analog; GTPγS, slowly hydrolysable GTP analog; GDP·AlFX, GTP transition state analog). hGBP1‐associated bacteria after 45 min were quantified. Combined data from two independent experiments are shown as mean ± SEM. Significance was determined by one‐way ANOVA with Tukey's multiple comparison test. ****P ≤ 0.0001.
- D
Model: hGBP1 polymers bind to S. flexneri directly and transition into a bacterium‐encapsulating protein coat.
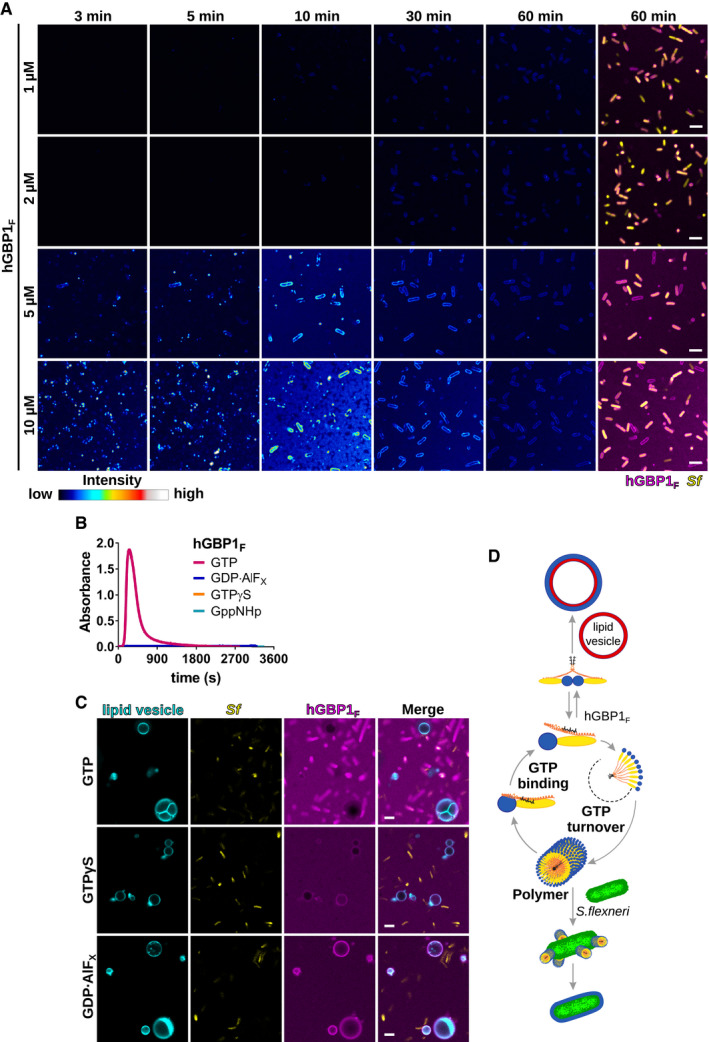
- A
Time‐lapse microscopy frames of formaldehyde‐fixed GFP+ S. flexneri following admixture of varying concentrations of Alexa‐Fluor647‐labeled hGBP1F and 2 mM GTP. Individual time frames depict hGBP1F fluorescence intensity. Merged images of hGBP1F and S. flexneri fluorescence are shown for the 60 min time points.
- B
Polymerization of 10 μM hGBP1F monitored over time by absorption spectroscopy at 350 nm after addition of 2 mM (GTP, GppNHp, GTPγS) or 250 μM (GDP·AlFX) nucleotide.
- C
Confocal images taken of formaldehyde‐fixed GFP+ S. flexneri and rhodamine‐labeled lipid vesicles 20 min after addition of 10 μM Alexa‐Fluor647‐hGBP1F and 2 mM GTP, 2 mM GTPγS, or 250 μM GDP·AlFX.
- D
Model: In its GTP‐bound conformation, the C‐terminal farnesyl tail is released from its hydrophobic pocket allowing hGBP1 to bind to lipid vesicles in vitro and to host membranes inside human cells. Direct binding to bacteria on the other hand requires hGBP1 to self‐assemble over several GTP turnover cycles into polymers. These hGBP1 polymers bind to S. flexneri directly and then transition into a bacteria‐encapsulating protein coat.
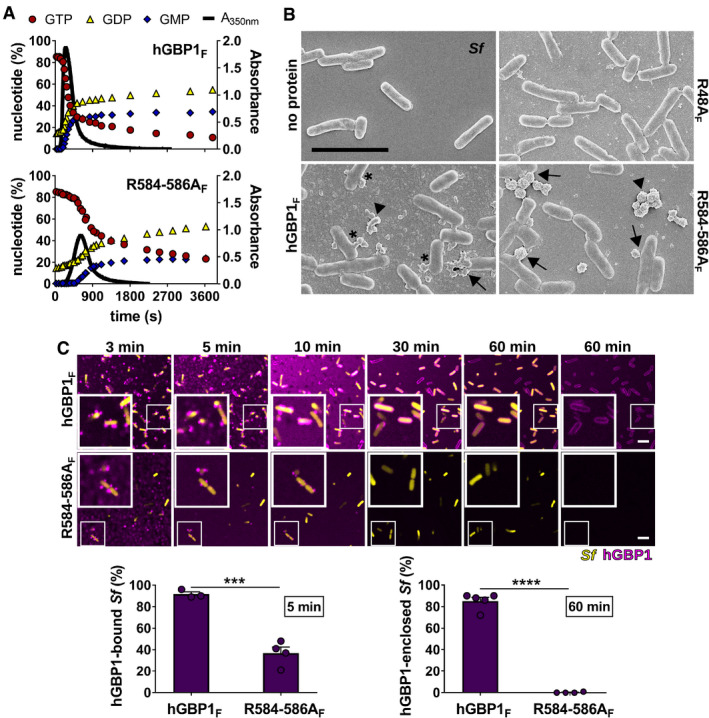
- A
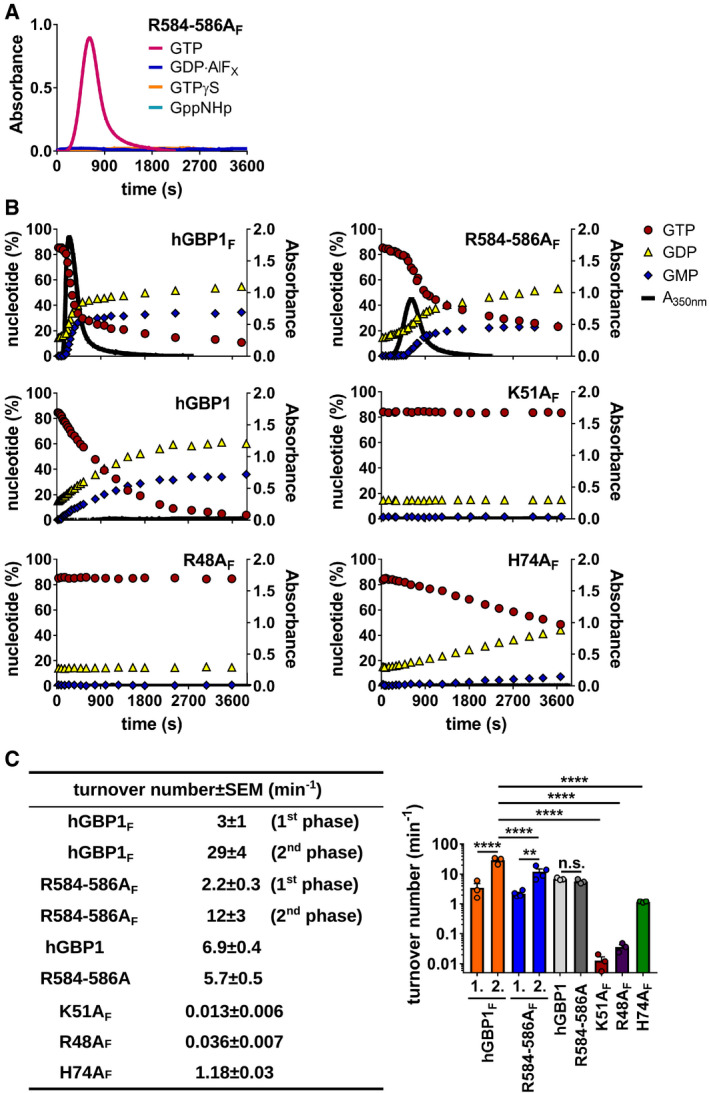
Polymerization of 10 μM hGBP1F and hGBP1F R584‐586A in the presence of 2 mM GTP was monitored over time by absorption spectroscopy at 350 nm. Absorbance signals were superimposed with nucleotide composition of the same solution analyzed at defined time points, revealing the characteristic first phase of slow polymer nucleation and the second phase of fast polymer growth and cooperative hydrolysis.
- B
Scanning electron micrographs of live S. flexneri incubated with no protein or with 5 μM of either hGBP1F, hGBP1F R584‐586A, or hGBP1F R48A (non‐polymerizing mutant) in the presence of 2 mM GTP for 4 min. Arrowheads point to unattached hGBP1 polymers, arrows point to hGBP1 polymers attached to bacteria, and asterisks mark polymeric structures that appear to fuse with bacterial surfaces.
- C
Confocal time‐lapse microscopy frames of formaldehyde‐fixed GFP+ S. flexneri following admixture of 10 μM Alexa‐Fluor647‐labeled hGBP1F or hGBP1F R584‐586A and 2 mM GTP. Binding of hGBP1F polymers to bacteria at 5 min and enclosure of bacteria with hGBP1F protein coats after 60 min were quantified. Mean frequencies ± SEM of combined data from at least three independent experiments are shown. Significance was determined by unpaired t‐tests, two‐tailed. ***P ≤ 0.001; ****P ≤ 0.0001.
- A
Polymerization of 10 μM hGBP1F R584‐586A was monitored over time by absorption spectroscopy at 350 nm after admixture of 2 mM (GTP, GppNHp, GTPγS) or 250 μM (GDP·AlFX) nucleotide.
- B
Polymerization of different hGBP1 variants (at 10 μM) induced by 2 mM GTP was monitored over time by absorption spectroscopy at 350 nm. Absorbance signals were superimposed with nucleotide composition analyzed at defined time points of the corresponding sample. Blots for hGBP1F and hGBP1F R584‐586A are the same as shown in Fig 3A.
- C
GTP turnover numbers were determined for different hGBP1 variants. Turnover numbers for both the slow and the fast phases of GTP hydrolysis (1st phase [1.], 2nd phase [2.]) were quantified during hGBP1F and hGBP1F R584‐586A polymerization. Combined data from three independent experiments are shown as mean turnover numbers ± SEM. Significance was determined by two‐way ANOVA with Tukey's multiple comparison test. n.s., not significant; **P ≤ 0.01; ****P ≤ 0.0001.
- A
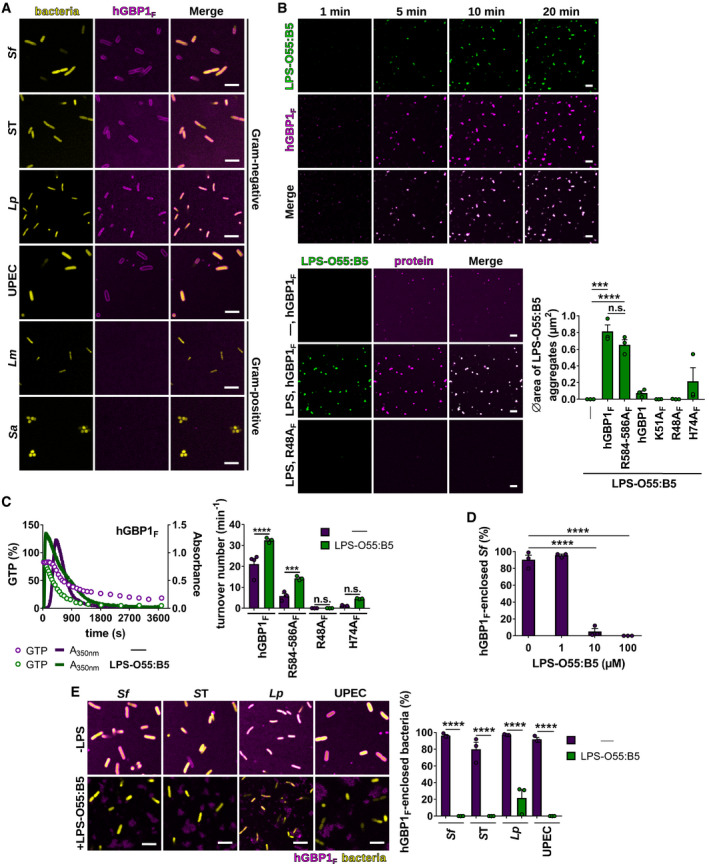
Representative confocal images taken at 60 min after admixture of 2 mM GTP and 10 μM Alexa‐Fluor647‐ or Alexa‐Fluor488‐hGBP1F to formaldehyde‐fixed gram‐negative and gram‐positive bacteria expressing GFP (Salmonella enterica Typhimurium [ST], L. monocytogenes [Lm]), or RFP (Shigella flexneri [Sf], uropathogenic E. coli [UPEC]), or dsRed (L. pneumophila [Lp], S. aureus [Sa]).
- B
(Upper panel) Confocal time‐lapse microscopy frames of 5 μM Alexa‐Fluor488‐LPS‐O55:B5 after addition of 5 μM Alexa‐Fluor647‐hGBP1F supplemented with 2 mM GTP. (Lower panel) Confocal images taken of 5 μM Alexa‐Fluor488‐LPS‐O55:B5 20 min after addition of 5 μM Alexa‐Fluor647‐hGBP1F or Alexa‐Fluor647‐hGBP1F R48A supplemented with 2 mM GTP. Graphs depict average aggregate area of Alexa‐Fluor488‐LPS‐O55:B5 supplemented with 2 mM GTP and 5 μM of the indicated hGBP1 variant. Mean area ± SEM of combined data from three independent experiments. Significance was determined by one‐way ANOVA with Tukey's multiple comparison test. n.s., not significant; ***P ≤ 0.001; ****P ≤ 0.0001.
- C
Polymerization of 5 μM hGBP1F induced by addition of 2 mM GTP in the presence and absence of 5 μM LPS‐O55:B5 was monitored by absorption spectroscopy at 350 nm. The absorbance signal was superimposed with nucleotide composition of the same solution analyzed at defined time points. Maximal hydrolysis rates (turnover numbers) were determined for hGBP1F variants in the presence and absence of 5 μM LPS‐O55:B5. Graphs show mean turnover numbers ± SEM of combined data from at least three independent experiments. Significance was determined by two‐way ANOVA with Tukey's multiple comparison test. n.s., not significant; ***P ≤ 0.001; ****P ≤ 0.0001.
- D
Formaldehyde‐fixed GFP+ S. flexneri supplemented with varying LPS‐O55:B5 concentrations were mixed with 5 μM hGBP1F and 2 mM GTP. After 60 min, hGBP1F‐enclosed S. flexneri were quantified. Combined data from three independent experiments are shown as mean ± SEM. Significance was determined by one‐way ANOVA with Tukey's multiple comparison test. ****P ≤ 0.0001.
- E
Confocal images of formaldehyde‐fixed GFP‐, RFP‐, or dsRed‐expressing gram‐negative bacteria 60 min after addition of 5 μM Alexa‐Fluor647‐ or Alexa‐Fluor488‐hGBP1F and 2 mM GTP in the presence and absence of 100 μM LPS‐O55:B5. After 60 min, hGBP1F‐enclosed gram‐negative bacteria were quantified. Combined data from three independent experiments are shown as mean ± SEM. Significance was determined by two‐way ANOVA with Tukey's multiple comparison test. ****P ≤ 0.0001.
- A
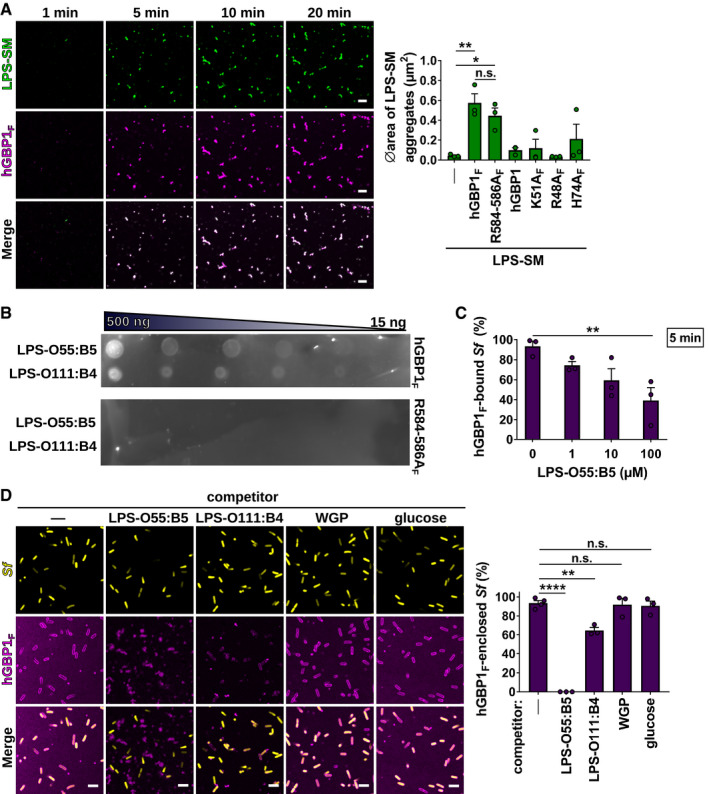
Confocal time‐lapse microscopy frames of 5 μM Alexa‐Fluor488‐LPS derived from Salmonella minnesota (LPS‐SM) mixed with 5 μM Alexa‐Fluor647‐hGBP1F in the presence of 2 mM GTP. Graph depicts average aggregate area of Alexa‐Fluor488‐LPS‐SM supplemented with 2 mM GTP and 5 μM of the indicated hGBP1 variant. Mean area ± SEM of combined data from three independent experiments. Significance was determined by one‐way ANOVA with Tukey's multiple comparison test. n.s., not significant; *P ≤ 0.05; **P ≤ 0.01.
- B
Nitrocellulose membrane dotted with 15–500 ng LPS‐O55:B5 and LPS‐O111:B4 spots was incubated with 2 μM Alexa‐Fluor647‐hGBP1F or Alexa‐Fluor647‐hGBP1F R584‐586A for 10 min in the presence of 1 mM GTP before measuring fluorescent signals.
- C
Percentage of hGBP1F‐bound formaldehyde‐fixed GFP+ S. flexneri after 5 min of incubation with 5 μM hGBP1F and 2 mM GTP in the presence of the indicated concentrations of LPS‐O55:B5. Mean percentages ± SEM of combined data from three independent experiments are shown. Significance was determined by one‐way ANOVA with Tukey's multiple comparison test. **P ≤ 0.01.
- D
Confocal images of formaldehyde‐fixed GFP+ S. flexneri supplemented with different carbohydrate species (LPS‐O55:B5, LPS‐O111:B4, glucose—100 μM; whole glucan particles (WGP) 1 mg/ml) taken 60 min after addition of 5 μM Alexa‐Fluor647‐hGBP1F and 2 mM GTP. After 60 min of incubation time, hGBP1F‐enclosed bacteria were quantified. Mean frequencies ± SEM of combined data from three independent experiments are shown. Significance was determined by one‐way ANOVA with Tukey's multiple comparison test. n.s., not significant; **P ≤ 0.01; ****P ≤ 0.0001.
- A
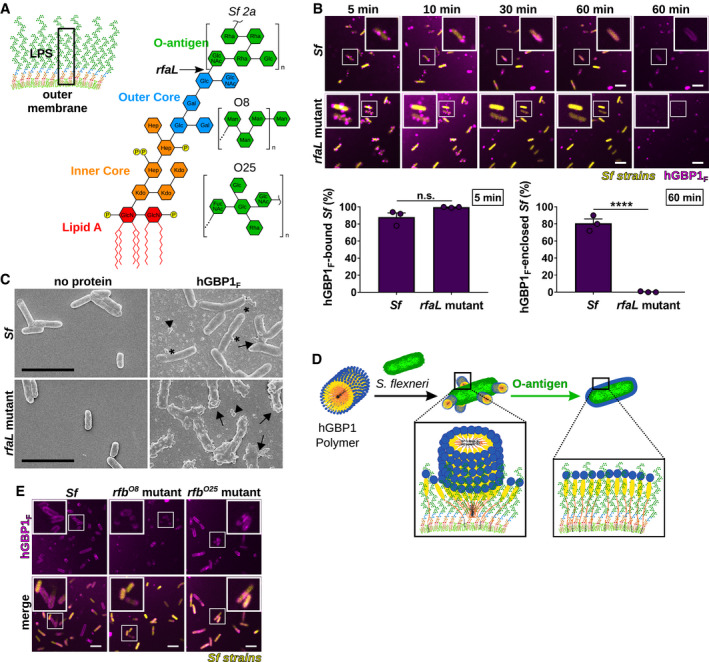
Graphic depiction of the bacterial outer membrane composition and LPS structure of Shigella flexneri. Arrow indicates the LPS truncation site in the O‐antigen‐deficient rfaL mutant. O‐antigen oligosaccharide subunit composition of S. flexneri serotype 2a and E. coli serotypes O8 and O25 are shown.
- B
Time‐lapse microscopy of fixed GFP+ co‐isogenic S. flexneri wild type and rfaL mutant after adding 10 μM Alexa‐Fluor647‐hGBP1F and 2 mM GTP. Bacteria bound by hGBP1F at 5 min and hGBP1F‐enclosed bacteria after 60 min were quantified. Combined data from three independent experiments are shown as mean ± SEM. Significance was determined by unpaired t‐tests, two‐tailed. n.s., not significant; ****P ≤ 0.0001.
- C
Scanning electron micrographs of live wild type and rfaL mutant strains incubated with no protein or with 5 μM of hGBP1F in the presence of 2 mM GTP for 4 min. Arrowheads point to unattached hGBP1 polymers, arrows point to hGBP1 polymers attached to bacteria, and asterisks mark polymeric structures that appear to fuse with bacterial surfaces.
- D
Model: O‐antigen drives the transition of surface‐docked hGBP1F polymers into bacteria‐enveloping hGBP1F protein sheets.
- E
Confocal images of formaldehyde‐fixed, co‐isogenic GFP+ wild type and mutant S. flexneri strains harboring rfb regions of E. coli serotypes O8 and O25 after 60 min of incubation time in the presence of 10 μM Alexa‐Fluor647‐hGBP1F and 2 mM GTP.
- A
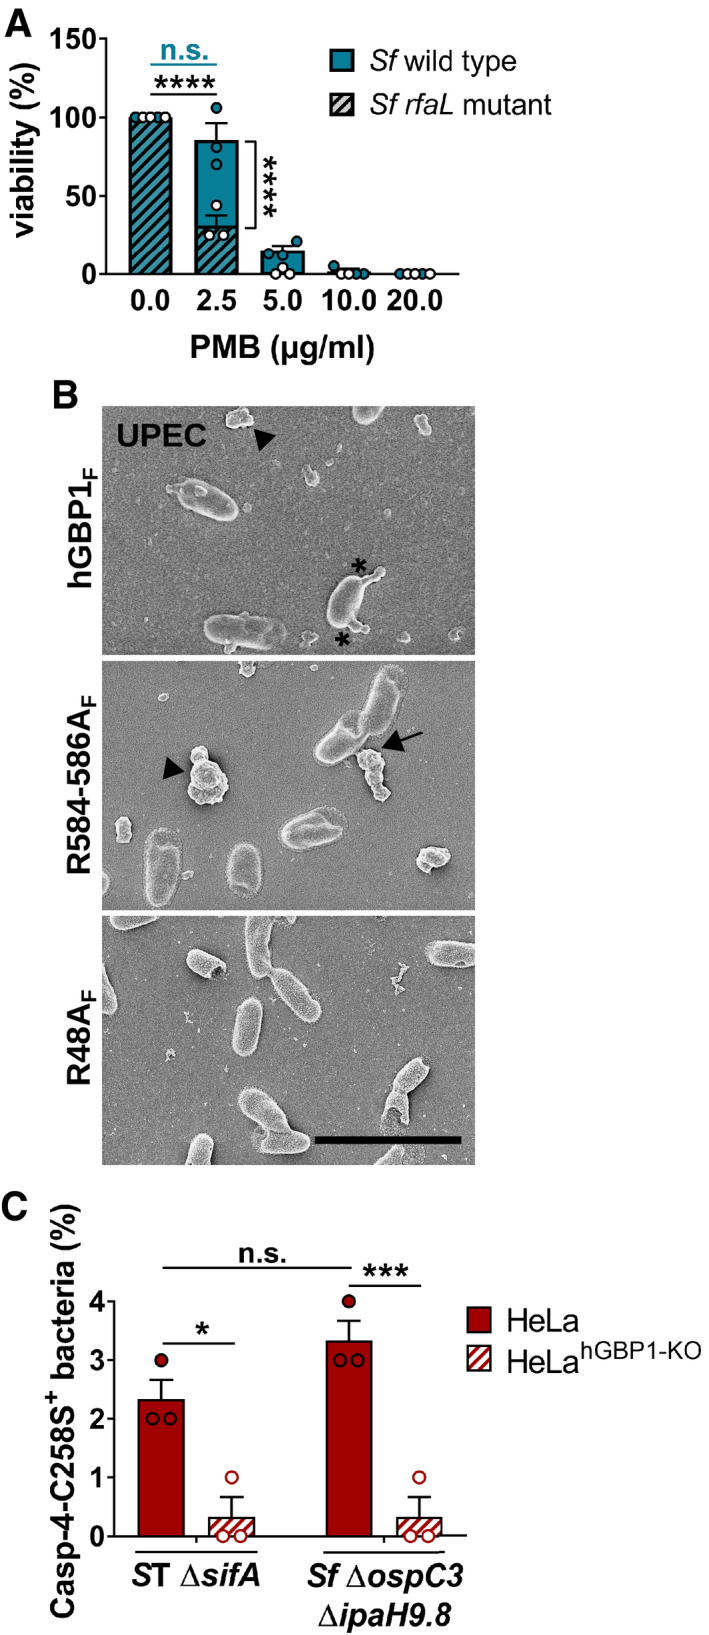
Following incubation for 45 min with buffer, live S. flexneri wild type and rfaL mutant were treated for 30 min with varying concentrations of polymyxin B (PMB). The number of viable bacteria was subsequently determined by CFU counts. Graphs show mean CFUs ± SEM of combined data from three independent experiments. Significance was determined by two‐way ANOVA with Tukey's multiple comparison test. n.s., not significant; ****P ≤ 0.0001.
- B
Scanning electron micrographs of live UPEC incubated for 4 min with 5 μM hGBP1F or equivalent concentration of either hGBP1F R584‐586A or hGBP1F R48A in the presence of 2 mM GTP. Scale bar equals 5 μm. Arrowheads point to unattached hGBP1 polymers, arrows point to hGBP1 polymers attached to bacteria, and asterisks mark polymeric structures that appear to fuse with bacterial surfaces.
- C
IFNγ‐primed wild type and hGBP1‐KO HeLa cells stably expressing YFP‐Caspase‐4C258S were infected with either Salmonella enterica Typhimurium mutant ΔsifA (MOI = 25) or with S. flexneri ΔospC3ΔipaH9.8 (MOI = 6). Cells were fixed at 4 hpi (ST ΔsifA) or at 2 hpi (Sf ΔospC3ΔipaH9.8). Percentage of YFP‐Caspase‐4C258S‐associated bacteria were quantified, and mean ± SEM of combined data from three independent experiments are shown. Significance was determined by two‐way ANOVA with Tukey's multiple comparison test. n.s., not significant; *P ≤ 0.05; ***P ≤ 0.001.
- A
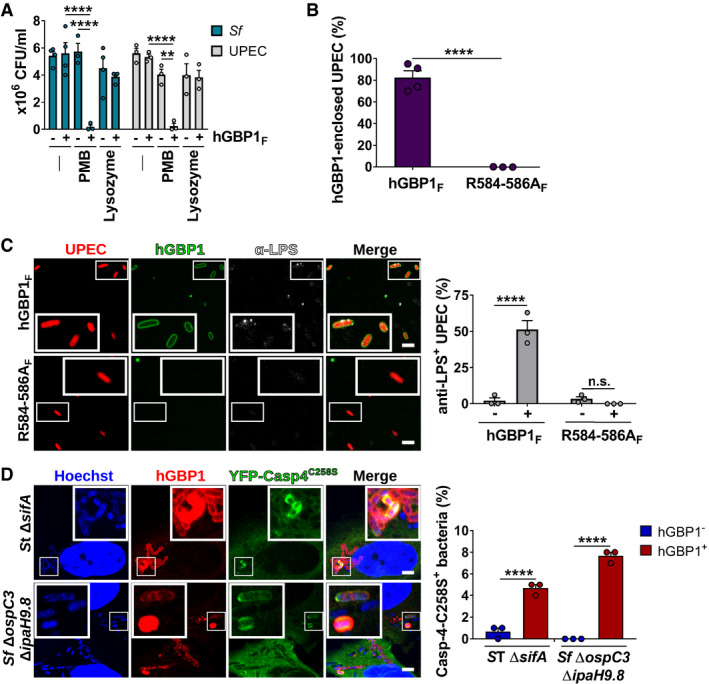
Following incubation for 1.5 h with buffer in the absence or presence of 10 μM hGBP1F and 5 mM GTP, live bacteria were treated with antibiotics (2.5 μg/ml PMB or 5 mg/ml lysozyme) for 30 min or left untreated. The number of viable bacteria was subsequently determined by colony‐forming unit (CFU) counts. Graphs show mean CFUs ± SEM of combined data from at least three independent experiments. Significance was determined by two‐way ANOVA with Tukey's multiple comparison test. n.s., not significant; ****P ≤ 0.0001.
- B
Formaldehyde‐fixed RFP+ UPEC were mixed with 10 μM Alexa‐Fluor488‐hGBP1F or ‐hGBP1F R584‐586A supplemented with 2 mM GTP. Following 60 min of incubation, hGBP1F‐enclosed UPEC were quantified. Graphs depict mean ± SEM of combined data from three independent experiments. Significance was determined by unpaired t‐test, two‐tailed. ****P ≤ 0.0001.
- C
Formaldehyde‐fixed RFP+ UPEC were mixed with 10 μM Alexa‐Fluor488‐hGBP1F or ‐hGBP1F R584‐586A and 2 mM GTP. Samples were fixed after 60 min of incubation and stained with an antibody against the inner core/lipid A fragment of E. coli LPS (anti‐LPS). The frequency of anti‐LPS stained UPEC was quantified. Graphs show mean ± SEM of combined data from three independent experiments. Significance was determined by two‐way ANOVA with Tukey's multiple comparison test. n.s., not significant; ****P ≤ 0.0001.
- D
IFNγ‐primed wild type and hGBP1‐KO HeLa cells stably expressing inactive mutant YFP‐Caspase‐4C258S were infected with either cytosol‐entering Salmonella enterica Typhimurium mutant ΔsifA (MOI = 25) or with Shigella flexneri ΔospC3ΔipaH9.8 (MOI = 6), a mutant strain lacking Caspase‐4 antagonist OspC3 as well as hGBP1 antagonist IpaH9.8. Cells were fixed at 4 hpi (ST ΔsifA) or at 2 hpi (Sf ΔospC3ΔipaH9.8) and stained for endogenous hGBP1. YFP‐Caspase‐4C258S associated bacteria were quantified, and mean ± SEM of combined data from three independent experiments are shown. Significance was determined by two‐way ANOVA with Tukey's multiple comparison test. ****P ≤ 0.0001.
- A
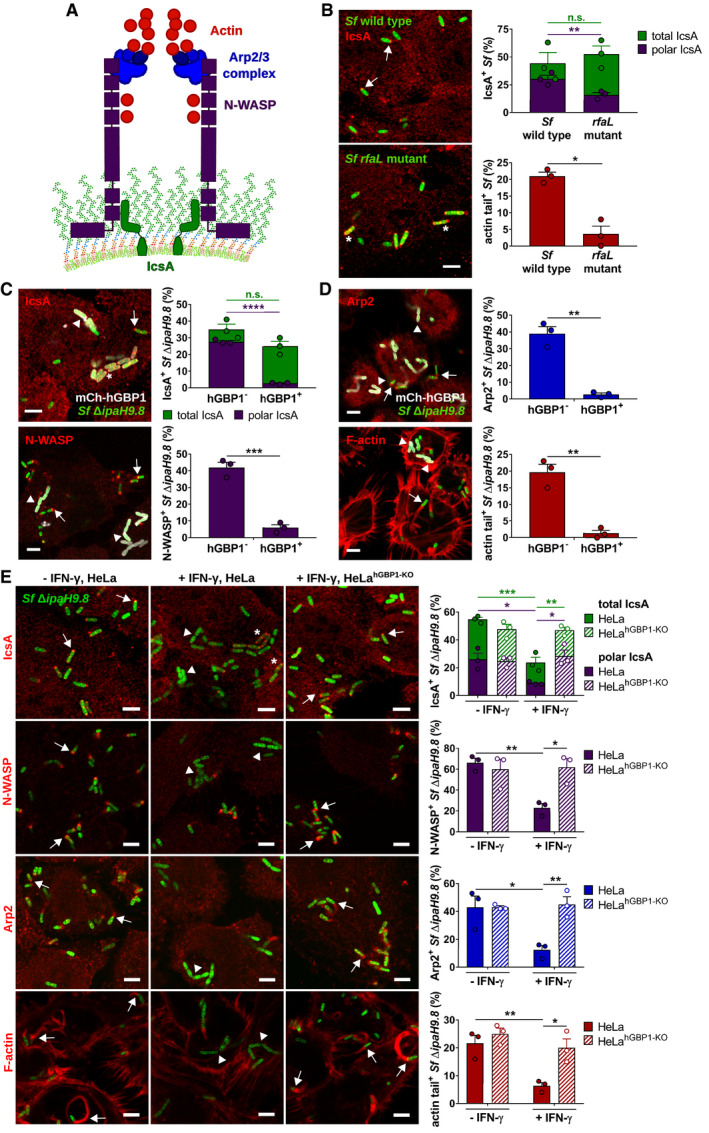
Schematic depicts the molecular mechanism by which Shigella flexneri co‐opts the host actin polymerization machinery: The bacterial autotransporter IcsA localizes to one bacterial pole where it recruits and activates host actin nucleation‐promoting factor N‐WASP. N‐WASP then recruits and activates the host actin nucleator Arp2/3 complex to initiate actin polymerization.
- B–E
Cells were infected with poly‐
d ‐lysine treated GFP+ Shigella flexneri strains at an MOI of 6. Cells were stained for indicated proteins, and Z‐stacks were recorded using confocal fluorescence microscopy. Actin tails were classified as tails when ≥ 2.5 μm. All graphs show mean values ± SEM of combined data from three independent experiments. All scale bars are 5 μm. Arrows point to bacteria associated with indicated proteins, arrowheads point to bacteria lacking indicated proteins, and asterisks mark bacteria lacking unipolar IcsA localization. (B) Unprimed HeLa cells were infected with wild type or rfaL S. flexneri. Total and unipolar localization of IcsA as well as the actin tail formation were quantified at 1 hpi. Significance was determined by unpaired two‐tailed t‐tests. n.s., not significant; *P ≤ 0.05; **P ≤ 0.01. (C, D) mCherry‐hGBP1 was expressed in HeLa hGBP1‐KO cells infected with S. flexneri ΔipaH9.8 and stained for IcsA, N‐WASP, Arp2, and F‐actin at 2.5 hpi. Colocalization of hGBP1 and indicated proteins on bacteria was quantified. Significance was determined by unpaired t‐tests, two‐tailed. n.s., not significant; **P ≤ 0.01; ***P ≤ 0.001; ****P ≤ 0.0001. (E) IFNγ‐primed and unprimed wild type and hGBP1‐KO HeLa cells were infected with S. flexneri ΔipaH9.8, and subcellular localization of IcsA, N‐WASP, Arp2, and F‐actin was assessed and quantified at 2.5 hpi. Significance was determined by two‐way ANOVA with Tukey's multiple comparison test. *P ≤ 0.05; **P ≤ 0.01; ***P ≤ 0.001.
References
-
- Bergstrand A, Svanberg C, Langton M, Nyden M (2006) Aggregation behavior and size of lipopolysaccharide from Escherichia coli O55:B5. Colloids Surf B Biointerfaces 53: 9–14 - PubMed
Publication types
MeSH terms
Substances
Grants and funding
LinkOut - more resources
Full Text Sources
Other Literature Sources
Molecular Biology Databases
Research Materials
