[Preprint]. 2020 May 8:2020.04.15.043364.
doi: 10.1101/2020.04.15.043364.

Analysis of SARS-CoV-2 Antibodies in COVID-19 Convalescent Blood using a Coronavirus Antigen Microarray

Affiliations

Analysis of SARS-CoV-2 Antibodies in COVID-19 Convalescent Blood using a Coronavirus Antigen Microarray

Rafael R de Assis et al. bioRxiv. .

Update in

Abstract

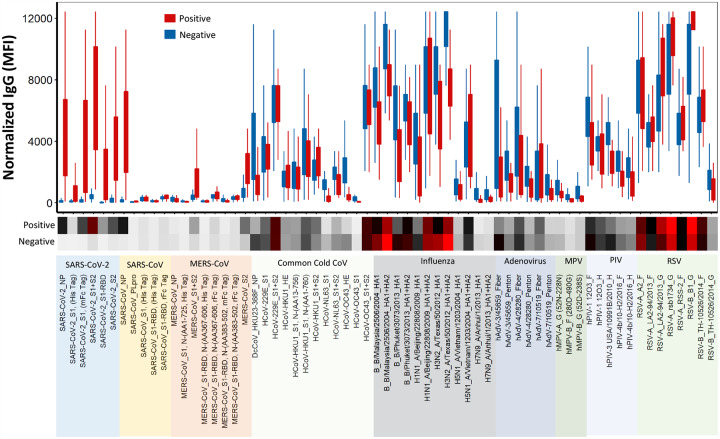
The current practice for diagnosis of COVID-19, based on SARS-CoV-2 PCR testing of pharyngeal or respiratory specimens in a symptomatic patient at high epidemiologic risk, likely underestimates the true prevalence of infection. Serologic methods can more accurately estimate the disease burden by detecting infections missed by the limited testing performed to date. Here, we describe the validation of a coronavirus antigen microarray containing immunologically significant antigens from SARS-CoV-2, in addition to SARS-CoV, MERS-CoV, common human coronavirus strains, and other common respiratory viruses. A comparison of antibody profiles detected on the array from control sera collected prior to the SARS-CoV-2 pandemic versus convalescent blood specimens from virologically confirmed COVID-19 cases demonstrates near complete discrimination of these two groups, with improved performance from use of antigen combinations that include both spike protein and nucleoprotein. This array can be used as a diagnostic tool, as an epidemiologic tool to more accurately estimate the disease burden of COVID-19, and as a research tool to correlate antibody responses with clinical outcomes.


Conflict of interest statement

Competing Interests The coronavirus antigen microarray is intellectual property of the Regents of the University of California that is licensed for commercialization to Nanommune Inc. (Irvine, CA), a private company for which P. Felgner is the largest shareholder and several coauthors (R. de Assis, A. Jain, R. Nakajima, A. Jasinskas, J. Obiero, H. Davies, and S. Khan) also own shares. Nanommune Inc. has a business partnership with Sino Biological Inc. (Beijing, China) which expressed and purified the antigens used in this study. The convalescent plasma used in this study was collected for clinical use by independent blood centers using licensed plasma or platelet processing systems manufactured by Cerus Corporation, for which multiple authors (L. Corash, A. Bagri) are shareholders and employees. Convalescent sera were also provided by Ortho Clinical Diagnostics, which is using these specimens to validate a clinical diagnostic test, and P. Hosimer, C. Noesen, and P. Contestable are shareholders and employees of this company. M. Battegay, A. Buser and A. Holbro are employees of the University of Basel and have no conflicts of interest.

Figures

Figure 1.
Figure 1.
Heatmap for coronavirus antigen microarray. The heatmap shows IgG (A) and IgA (B) reactivity measured as mean fluorescence intensity across four replicates, against each antigen organized into rows color coded by virus, for sera organized into columns classified as positive (convalescent from PCR-positive individuals) or negative (prior to pandemic from naïve individuals). Reactivity is represented by color (white = low, black = mid, red = high).
Figure 2.
Figure 2.
Normalized IgG reactivity of positive and negative sera on coronavirus antigen microarray. The plot shows IgG reactivity against each antigen measured as mean fluorescence intensity (MFI) with full range (bars) and interquartile range (boxes) for convalescent sera from PCR-positive individuals (positive, red) and sera from naïve individuals prior to pandemic (negative, blue). Below the plot, the heatmap shows average reactivity for each group (white = low, black = mid, red = high). The antigen labels are color coded for respiratory virus group.
Figure 3.
Figure 3.
Normalized IgA reactivity of positive and negative sera on coronavirus antigen microarray. The plot shows IgG reactivity against each antigen measured as mean fluorescence intensity (MFI) with full range (bars) and interquartile range (boxes) for convalescent sera from PCR-positive individuals (positive, red) and sera from naïve individuals prior to pandemic (negative, blue). Below the plot, the heatmap shows average reactivity for each group (white = low, black = mid, red = high). The antigen labels are color coded for respiratory virus group.
Figure 4.
Figure 4.
ROC curves for high-performing antigens. ROC curves showing sensitivity versus specificity for discrimination of positive and negative sera were derived for each individual high performing antigen (ROC AUC ≥ 0.95) for both IgG and IgA (solid blue line) and compared to no discrimination (ROC AUC = 0.5, dashed black line).
Figure 5.
Figure 5.
Normalized antibody reactivity of positive and negative sera for high-performing antigens. IgG and IgA reactivity against each high-performing antigens (ROC AUC ≥ 0.95) measured as mean fluorescence intensity (MFI) for convalescent sera from PCR-positive individuals (positive, red) and sera from naïve individuals prior to pandemic (negative, blue) are shown as box plots, including full range (bars), interquartile range (boxes), median (black line), and individual sera (dots) with p-values for each antigen calculated by Wilcoxon Rank Sum test.
Figure 6.
Figure 6.
ROC curves for high-performing combination of antigens. ROC curves showing sensitivity versus specificity for discrimination of positive and negative sera were derived for each combination of the high performing antigens for both IgG and IgA (solid blue line) and compared to no discrimination (ROC AUC = 0.5, grey line).

References

    1. Cao Y., Liu X., Xiong L. & Cai K. Imaging and Clinical Features of Patients With 2019 Novel Coronavirus SARS-CoV-2: A systematic review and meta-analysis. J Med Virol, doi:10.1002/jmv.25822 (2020). - DOI - PMC - PubMed
    1. Tang Y. W., Schmitz J. E., Persing D. H. & Stratton C. W. The Laboratory Diagnosis of COVID-19 Infection: Current Issues and Challenges. J Clin Microbiol, doi:10.1128/JCM.00512-20 (2020). - DOI - PMC - PubMed
    1. Zhao J. et al. Antibody responses to SARS-CoV-2 in patients of novel coronavirus disease 2019. Clin Infect Dis, doi:10.1093/cid/ciaa344 (2020). - DOI - PMC - PubMed
    1. To K. K. et al. Temporal profiles of viral load in posterior oropharyngeal saliva samples and serum antibody responses during infection by SARS-CoV-2: an observational cohort study. Lancet Infect Dis, doi:10.1016/S1473-3099(20)30196-1 (2020). - DOI - PMC - PubMed
    1. Liu W. et al. Evaluation of Nucleocapsid and Spike Protein-based ELISAs for detecting antibodies against SARS-CoV-2. J Clin Microbiol, doi:10.1128/JCM.00461-20 (2020). - DOI - PMC - PubMed

Publication types