[Preprint]. 2020 May 11:2020.03.16.994236.
doi: 10.1101/2020.03.16.994236.

The sequence of human ACE2 is suboptimal for binding the S spike protein of SARS coronavirus 2

Affiliations

The sequence of human ACE2 is suboptimal for binding the S spike protein of SARS coronavirus 2

Erik Procko. bioRxiv. .

Update in

Abstract

The rapid and escalating spread of SARS coronavirus 2 (SARS-CoV-2) poses an immediate public health emergency. The viral spike protein S binds ACE2 on host cells to initiate molecular events that release the viral genome intracellularly. Soluble ACE2 inhibits entry of both SARS and SARS-2 coronaviruses by acting as a decoy for S binding sites, and is a candidate for therapeutic, prophylactic and diagnostic development. Using deep mutagenesis, variants of ACE2 are identified with increased binding to the receptor binding domain of S. Mutations are found across the interface, in the N90-glycosylation motif, and at buried sites where they are predicted to enhance local folding and presentation of the interaction epitope. When single substitutions are combined, large increases in binding can be achieved. The mutational landscape offers a blueprint for engineering high affinity proteins and peptides that block receptor binding sites on S to meet this unprecedented challenge.


Conflict of interest statement

CONFLICT OF INTEREST STATEMENT. E.P. is the inventor on a provisional patent filing by the University of Illinois claiming mutations in ACE2 described here that enhance binding to S. E.P. is a cofounder of Orthogonal Biologics Inc, which has a license from the University of Illinois.

Figures

Figure 1.
Figure 1.. A selection strategy for ACE2 variants with high binding to the RBD of SARS-CoV-2 S.
(A) Media from Expi293F cells secreting the SARS-CoV-2 RBD fused to sfGFP was collected and incubated at different dilutions with Expi293F cells expressing myc-tagged ACE2. Bound RBD-sfGFP was measured by flow cytometry. The dilutions of RBD-sfGFP-containing medium used for FACS selections are indicated by arrows. (B-C) Expi293F cells were transfected with wild type ACE2 plasmid diluted with a large excess of carrier DNA. It has been previously shown that under these conditions, cells typically acquire no more than one coding plasmid and most cells are negative. Cells were incubated with RBD-sfGFP-containing medium and co-stained with fluorescent anti-myc to detect surface ACE2 by flow cytometry. During analysis, the top 67% (magenta gate) were chosen from the ACE2-positive population (purple gate) (B). Bound RBD was subsequently measured relative to surface ACE2 expression (C). (D) Expi293F cells were transfected with an ACE2 single site-saturation mutagenesis library and analyzed as in B. During FACS, the top 15% of cells with bound RBD relative to ACE2 expression were collected (nCoV-S-High sort, green gate) and the bottom 20% were collected separately (nCoV-S-Low sort, blue gate).
Figure 2.
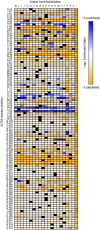
Figure 2.. A mutational landscape of ACE2 for high binding signal to the RBD of SARS-CoV-2 S.
Log2 enrichment ratios from the nCoV-S-High sorts are plotted from ≤ −3 (i.e. depleted/deleterious, orange) to neutral (white) to ≥ +3 (i.e. enriched, dark blue). ACE2 primary structure is on the vertical axis, amino acid substitutions are on the horizontal axis. *, stop codon.
Figure 3.
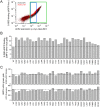
Figure 3.. Data from independent replicates show close agreement.
(A-B) Log2 enrichment ratios for ACE2 mutations in the nCoV-S-High (A) and nCoV-S-Low (B) sorts closely agree between two independent FACS experiments. Nonsynonymous mutations are black, nonsense mutations are red. Replicate 1 used a 1/40 dilution and replicate 2 used a 1/20 dilution of RBD-sfGFP-containing medium. R2 values are for nonsynonymous mutations. (C) Average log2 enrichment ratios tend to be anticorrelated between the nCoV-S-High and nCoV-S-Low sorts. Nonsense mutations (red) and a small number of nonsynonymous mutations (black) are not expressed at the plasma membrane and are depleted from both sort populations (i.e. fall below the diagonal). (D-F) Correlation plots of residue conservation scores from replicate nCoV-S-High (D) and nCoV-S-Low (E) sorts, and from the averaged data from both nCoV-S-High sorts compared to both nCoV-S-Low sorts (F). Conservation scores are calculated from the mean of the log2 enrichment ratios for all amino acid substitutions at each residue position.
Figure 4.
Figure 4.. Sequence preferences of ACE2 residues for high binding to the RBD of SARSCoV-2 S.
(A) Conservation scores from the nCoV-S-High sorts are mapped to the cryo-EM structure (PDB 6M17) of RBD (pale green ribbon) bound ACE2 (surface). The view at left is looking down the substrate-binding cavity, and only a single protease domain is shown for clarity. Residues conserved for high RBD binding are orange; mutationally tolerant residues are pale colors; residues that are hot spots for enriched mutations are blue; and residues maintained as wild type in the ACE2 library are grey. Glycans are dark red sticks. (B) Average hydrophobicity-weighted enrichment ratios are mapped to the RBD-bound ACE2 structure, with residues tolerant of polar substitutions in blue, while residues that prefer hydrophobic amino acids are yellow. (C) A magnified view of part of the ACE2 (colored by conservation score as in A) / RBD (pale green) interface. Accompanying heatmap plots log2 enrichment ratios from the nCoV-S-High sort for substitutions of ACE2-T27, D30 and K31 from ≤ −3 (depleted) in orange to ≥ +3 (enriched) in dark blue.
Figure 5.
Figure 5.. Single amino acid substitutions in ACE2 predicted from the deep mutational scan to increase RBD binding have small effects.
(A) Expi293F cells expressing full length ACE2 were stained with RBD-sfGFP-containing medium and analyzed by flow cytometry. Data are compared between wild type ACE2 (black) and a single mutant (L79T, red). Increased RBD binding is most discernable in cells expressing low levels of ACE2 (blue gate). In this experiment, ACE2 has an extracellular N-terminal myc tag upstream of residue S19 that is used to detect surface expression. (B) RBD-sfGFP binding was measured for 30 single amino acid substitutions in ACE2. Data are GFP mean fluorescence in the low expression gate (blue gate in panel A) with background fluorescence subtracted. (C) RBD-sfGFP binding measured for the total ACE2-positive population (green gate in panel A) is shown in the upper graph, while the lower graph plots ACE2 expression measured by detection of the extracellular myc tag. Total RBD-sfGFP binding correlates with total ACE2 expression, and differences in binding between the mutants are therefore most apparent only after controlling for expression levels as in panel A.
Figure 6.
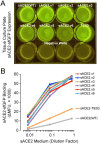
Figure 6.. Engineered sACE2 with enhanced binding to S.
(A) Expression of sACE2-sfGFP mutants was qualitatively evaluated by fluorescence of the transfected cell cultures. (B) Cells expressing full length S were stained with dilutions of sACE2-sfGFP-containing media and binding was analyzed by flow cytometry.
Figure 7.
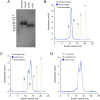
Figure 7.. Analytical SEC of purified sACE2 proteins.
(A) Purified sACE2 proteins (10 μg) were separated on a 4–20% SDS-polyacrylamide gel and stained with coomassie. (B) Analytical SEC of IgG1-fused wild type sACE2 (grey) and sACE2.v2 (blue). Molecular weights (MW) of standards (green) are indicated in kD above the peaks. Absorbance of the MW standards is scaled for clarity. (C) Analytical SEC of 8his-tagged proteins. The major peak corresponds to the expected MW of a monomer. A dimer peak is also observed, although its abundance differs between independent protein preparations (compare to Figure 10D). (D) Soluble ACE2–8h proteins were incubated at 37 °C for 40 h and analyzed by SEC.
Figure 8.
Figure 8.. A variant of sACE2 with high affinity for S.
(A) Expi293F cells expressing full length S were incubated with purified wild type sACE2 (grey) or sACE2.v2 (blue) fused to 8his (solid lines) or IgG1-Fc (broken lines). After washing and staining with secondary antibodies, bound protein was detected by flow cytometry. Data are mean fluorescence units (MFU) of the total cell population after subtraction of background autofluorescence. n = 2, error bars represent range. (B) Binding of 100 nM wild type sACE2-IgG1 (broken lines) was competed with wild type sACE2–8h (solid grey line) or sACE2.v2–8h (solid blue line). The competing proteins were added simultaneously to cells expressing full length S, and bound proteins were detected by flow cytometry. (C) BLI kinetics of wild type sACE2–8h association (t = 0 to 120 s) and dissociation (t > 120 s) with immobilized RBD-IgG1. Compare to an independent protein preparation in Figure 10F. (D) Kinetics of sACE2.v2–8h binding to immobilized RBD-IgG1 measured by BLI.
Figure 9.
Figure 9.. Flow cytometry measurements of sACE2 binding to myc-tagged S expressed at the plasma membrane.
(A) Expi293F cells expressing full length S, either untagged (Figure 8A) or with an extracellular myc epitope tag (this Figure), were gated by forward-side scattering properties for the main cell population (purple gate). (B) Histograms showing representative raw data from flow cytometry analysis of myc-S-expressing cells incubated with 200 nM wild type sACE2–8h (grey) or sACE2.v2 (blue). After washing, bound protein was detected with a fluorescent anti-HIS-FITC secondary. Fluorescence of myc-S-expressing cells treated without sACE2 is black. (C) Binding of purified wild type sACE2 (grey) or sACE2.v2 (blue) fused to 8his (solid lines) or IgG1-Fc (broken lines) to cells expressing myc-S.
Figure 10.
Figure 10.. Optimization of a high affinity sACE2 variant for improved yield.
(A) Dilutions of sACE2-sfGFP-containing media were incubated with Expi293F cells expressing full length S. After washing, bound sACE2-sfGFP was analyzed by flow cytometry. (B) Coomassie-stained SDS-polyacrylamide gel compares the yield of sACE2-IgG1 variants purified from expression medium by protein A resin. (C) Coomassie-stained gel of purified sACE2–8h variants (10 μg per lane). (D) By analytical SEC, sACE2.v2.2–8h (red) and sACE2.v2.4–8h (purple) are indistinguishable from wild type sACE2–8h (grey). The absorbance of MW standards (green) is scaled for clarity, with MW indicated above the elution peaks in kD. (E) Analytical SEC after storage of the proteins at 37 °C for 60 h. (F) Wild type sACE2–8h association (t = 0 to 120 s) and dissociation (t > 120 s) with immobilized RBD-IgG1 measured by BLI. Data are comparable to a second independent preparation of sACE2–8h shown in Figure 8C. (G) BLI kinetics of sACE2.v2.4–8h with immobilized RBD-IgG1.

References

    1. Zhu N. et al., A Novel Coronavirus from Patients with Pneumonia in China, 2019. N. Engl. J. Med. 382, 727–733 (2020). - PMC - PubMed
    1. Zhou P. et al., A pneumonia outbreak associated with a new coronavirus of probable bat origin. Nature. 579, 270–273 (2020). - PMC - PubMed
    1. Peiris J. S. M. et al., Coronavirus as a possible cause of severe acute respiratory syndrome. Lancet. 361, 1319–1325 (2003). - PMC - PubMed
    1. Coronaviridae Study Group of the International Committee on Taxonomy of Viruses, The species Severe acute respiratory syndrome-related coronavirus: classifying 2019-nCoV and naming it SARS-CoV-2. Nat Microbiol. 4, 3 (2020). - PMC - PubMed
    1. Patel A., Jernigan D. B., 2019-nCoV CDC Response Team, Initial Public Health Response and Interim Clinical Guidance for the 2019 Novel Coronavirus Outbreak - United States, December 31, 2019-February 4, 2020. MMWR Morb. Mortal. Wkly. Rep. 69, 140–146 (2020). - PMC - PubMed

Publication types