[Preprint]. 2020 Apr 10:2020.04.09.034454.
doi: 10.1101/2020.04.09.034454.

Type 2 and interferon inflammation strongly regulate SARS-CoV-2 related gene expression in the airway epithelium

Affiliations

Type 2 and interferon inflammation strongly regulate SARS-CoV-2 related gene expression in the airway epithelium

Satria P Sajuthi et al. bioRxiv. .

Update in

  • Type 2 and interferon inflammation regulate SARS-CoV-2 entry factor expression in the airway epithelium.
    Sajuthi SP, DeFord P, Li Y, Jackson ND, Montgomery MT, Everman JL, Rios CL, Pruesse E, Nolin JD, Plender EG, Wechsler ME, Mak ACY, Eng C, Salazar S, Medina V, Wohlford EM, Huntsman S, Nickerson DA, Germer S, Zody MC, Abecasis G, Kang HM, Rice KM, Kumar R, Oh S, Rodriguez-Santana J, Burchard EG, Seibold MA. Sajuthi SP, et al. Nat Commun. 2020 Oct 12;11(1):5139. doi: 10.1038/s41467-020-18781-2. Nat Commun. 2020. PMID: 33046696 Free PMC article.

Abstract

Coronavirus disease 2019 (COVID-19) outcomes vary from asymptomatic infection to death. This disparity may reflect different airway levels of the SARS-CoV-2 receptor, ACE2, and the spike protein activator, TMPRSS2. Here we explore the role of genetics and co-expression networks in regulating these genes in the airway, through the analysis of nasal airway transcriptome data from 695 children. We identify expression quantitative trait loci (eQTL) for both ACE2 and TMPRSS2, that vary in frequency across world populations. Importantly, we find TMPRSS2 is part of a mucus secretory network, highly upregulated by T2 inflammation through the action of interleukin-13, and that interferon response to respiratory viruses highly upregulates ACE2 expression. Finally, we define airway responses to coronavirus infections in children, finding that these infections upregulate IL6 while also stimulating a more pronounced cytotoxic immune response relative to other respiratory viruses. Our results reveal mechanisms likely influencing SARS-CoV-2 infectivity and COVID-19 clinical outcomes.


Figures
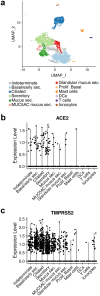
Figure 1.
Figure 1.. ACE2 and TMPRSS2 are expressed by multiple nasal airway epithelial cell types
(a) UMAP visualization of cells derived from a human nasal airway epithelial brushing depicts multiple epithelial and immune cell types identified through unsupervised clustering. (b) Normalized expression of ACE2 in epithelial and immune cell types. (c) Normalized expression of TMPRSS2 in epithelial and immune cell types.
Figure 2.
Figure 2.. TMPRSS2 is a mucus secretory network gene regulated by T2 inflammation
(a) WGCNA identified networks of co-regulated genes related to mucus secretory function (black), T2 inflammation-induced mucus secretory function (pink), and canonical T2 inflammation biomarkers (saddle brown). TMPRSS2 was within the pink network. Select pathway and cell type enrichments for network genes are shown. (b) Scatterplot revealing a strong positive correlation between TMPRSS2 expression and summary (eigengene) expression of the T2 inflammatory, mucus secretory network. (c) Scatterplot revealing a strong positive correlation between TMPRSS2 expression and summary (eigengene) expression of the canonical T2 inflammation biomarker network. (d) Box plots revealing strong upregulation of TMPRSS2 expression among T2-high compared to T2-low subjects. (e) Scatterplot revealing a strong negative correlation between ACE2 expression and summary (eigengene) expression of the T2 inflammation mucus secretory network. (f) Scatterplot revealing a strong negative correlation between ACE2 expression and summary (eigengene) expression of the canonical T2 inflammation biomarker network. (g) Box plots revealing strong downregulation of ACE2 expression among T2-high compared to T2-low subjects.
Figure 3.
Figure 3.. ACE2 and TMPRSS2 expression are both regulated by IL-13 in the mucociliary airway epithelium
Experimental schematic detailing the timeline for differentiation of basal airway epithelial cells into a mucociliary airway epithelium and treatment with chronic (10 days) or acute (72 hours) IL-13 (10ng/ml). (b) Box plots of count-normalized expression between paired nasal airway cultures (control/IL-13) revealing strong downregulation of bulk ACE2 expression with IL-13 treatment. Differential expression results are from DESeq2. (c) Box plots of count-normalized expression between paired nasal airway cultures (control/IL-13) revealing strong upregulation of bulk TMPRSS2 expression with IL-13 treatment. Differential expression results are from DESeq2. (d) UMAP visualization of cells derived from control and IL-13 stimulated tracheal airway ALI cultures depict multiple epithelial cell types identified through unsupervised clustering. (e) Violin plots of normalized ACE2 expression across epithelial cell types from tracheal airway ALI cultures, stratified by treatment (gray = control, red = IL-13). Differential expression using a Wilcoxon test was performed between control and IL-13-stimulated cells with significant differences in expression for a cell type indicated by a * (p < 0.05). (f) Violin plots of normalized TMPRSS2 expression across epithelial cell types from tracheal airway ALI cultures, stratified by treatment (gray = control, red = IL-13). Differential expression using a Wilcoxon test was performed between control and IL-13-stimulated cells with significant differences in expression for a cell type indicated by a * (p < 0.05).
Figure 4.
Figure 4.. ACE2 is an interferon response network gene regulated by respiratory virus infections
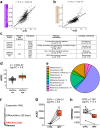
(a) Scatter plot revealing a strong positive correlation between ACE2 expression and summary (eigengene) expression of the cytotoxic immune response network (purple). (b) Scatterplot revealing a strong positive correlation between ACE2 expression and summary (eigengene) expression of the interferon response network (tan). (c) WGCNA analysis identified networks of co-regulated genes related to cytotoxic immune response (purple) and interferon response (tan). ACE2 was within the purple network. Select pathway and cell type enrichments for network genes are shown. (d) Box plots of count-normalized expression from GALA II nasal epithelial samples reveal strong upregulation of ACE2 expression among interferon-high compared to interferon-low subjects. Differential expression results are from DESeq2. (e) Pie graph depicting the percentage of each type of respiratory virus infection found among GALA II subjects in whom viral reads were found. (f) Experimental schematic detailing timeline for differentiation of basal airway epithelial cells into a mucociliary airway epithelium and experimental infection with HRV-A16. (g) Box plots of count-normalized expression between paired nasal airway cultures (control/HRV-A16 infected) revealing strong upregulation of ACE2 expression with HRV-A16 infection. Differential expression results are from DESeq2. (h) Box plots of count-normalized expression between paired nasal airway cultures (control/HRV-A16-infected) revealing no effect of HRVA-16 on TMPRSS2 expression. Differential expression results are from DESeq2.
Figure 5.
Figure 5.. ACE2 and TMPRSS2 nasal airway expression are regulated by eQTL variants
(a) Locuszoom plot of ACE2 eQTL signals. The lead eQTL variant (rs18160331) is highlighted with a purple dot. The strength of Linkage Disequilibrium (LD) between rs18160331 and other variants is discretely divided into five quantiles and mapped into five colors (dark blue, sky blue, green, orange, and red) sequentially from low LD to high LD. (b) Locuszoom plot of TMPRSS2 eQTL signals. The three independent eQTL variants (rs1475908, rs2838057, rs74659079) and their LD with other variants (r2) are represented by red, blue, and green color gradient respectively. (c) Box plots of normalized ACE2 expression among the three genotypes of the lead ACE2 eQTL variant (rs18160331). log2AFC = log2 of the allelic fold change associated with the variant. (d) Box plots of normalized TMPRSS2 expression among the three genotypes of the lead TMPRSS2 eQTL variant (rs1475908). log2AFC = log2 of the allelic fold change associated with the variant. (e) Bar plots depicting allele frequencies of the ACE2 eQTL variant rs18160331 and TMPRSS2 eQTL variants (rs1475908, rs2838057, rs74659079) across world populations. Allele frequency data were obtained from gnomAD v2.1.1.
Figure 6.
Figure 6.. Coronavirus infections elicit an enhanced cytotoxic immune response from the airway epithelium
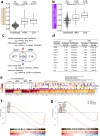
(a) Box plots revealing a strong and equivalent upregulation of summary (eigengene [Eg]) expression for the interferon response network among HRV and CoV-infected GALA II subjects, compared to uninfected subjects. (b) Box plots revealing upregulation in summary (eigengene) expression for the cytotoxic immune response network among HRV-infected GALA II subjects that is even stronger for the CoV infected group. (c) Venn Diagram describing the number of differentially expressed genes in HRV and CoV infected groups compared to the uninfected group, and the extent of their overlap. For genes differentially expressed in both groups, select enriched pathways and underlying genes that are highly differentially expressed are shown. (d) Top upstream regulators predicted by Ingenuity Pathway Analysis to be regulating the genes that were upregulated in CoV. Enrichment values for these CoV regulators, using the HRV upregulated genes are also shown. (e) Heatmap of the log2FC in gene expression for CoV and HRV groups when compared to the uninfected group. Top significantly upregulated genes are shown, along with ACE2, IL6, and genes identified as belonging to cytotoxic pathways, which were enriched within the virally upregulated CoV group DEGs based on IPA canonical pathway analysis. Color bars indicate which WGCNA network and or IPA canonical pathway each gene belongs to. (f) Gene set enrichment analysis plot for CD8+ T cells. The black (shared), yellow (CoV-enhanced), and red (HRV-enhanced) curves display the enrichment score for the indicated viral gene set as the analysis walks down the ranked distribution of genes ordered by fold change in expression between CD8+ T cells relative to all other immune cell types (red-blue color bar). Genes are represented by vertical bars in the same color as the curve of the viral gene group they represent. Denoted genes are a representative set from the leading edge (most responsible for the enrichment). (g) Gene set enrichment analysis plot for NK cells. The black (shared), yellow (CoV-enhanced), and red (HRV-enhanced) curves display the enrichment score for the indicated viral gene set as the analysis walks down the ranked distribution of genes ordered by fold change in expression between NK cells relative to all other immune cell types (red-blue color bar). Genes are represented by vertical bars in the same color as the curve of the viral gene group they represent. Denoted genes are from the leading edge (most responsible for the enrichment).

References

    1. Wang C., Horby P.W., Hayden F.G. & Gao G.F. A novel coronavirus outbreak of global health concern. Lancet 395, 470–473 (2020). - PMC - PubMed
    1. Zhu N. et al. A Novel Coronavirus from Patients with Pneumonia in China, 2019. N Engl J Med 382, 727–733 (2020). - PMC - PubMed
    1. Baud D. et al. Real estimates of mortality following COVID-19 infection. Lancet Infect Dis (2020). - PMC - PubMed
    1. Du Y. et al. Clinical Features of 85 Fatal Cases of COVID-19 from Wuhan: A Retrospective Observational Study. Am J Respir Crit Care Med (2020). - PMC - PubMed
    1. Zhou F. et al. Clinical course and risk factors for mortality of adult inpatients with COVID-19 in Wuhan, China: a retrospective cohort study. Lancet 395, 1054–1062 (2020). - PMC - PubMed

Publication types