[Preprint]. 2020 May 1:2020.04.20.048066.
doi: 10.1101/2020.04.20.048066.

Shotgun Transcriptome and Isothermal Profiling of SARS-CoV-2 Infection Reveals Unique Host Responses, Viral Diversification, and Drug Interactions

Affiliations

Shotgun Transcriptome and Isothermal Profiling of SARS-CoV-2 Infection Reveals Unique Host Responses, Viral Diversification, and Drug Interactions

Daniel J Butler et al. bioRxiv. .

Update in

  • Shotgun transcriptome, spatial omics, and isothermal profiling of SARS-CoV-2 infection reveals unique host responses, viral diversification, and drug interactions.
    Butler D, Mozsary C, Meydan C, Foox J, Rosiene J, Shaiber A, Danko D, Afshinnekoo E, MacKay M, Sedlazeck FJ, Ivanov NA, Sierra M, Pohle D, Zietz M, Gisladottir U, Ramlall V, Sholle ET, Schenck EJ, Westover CD, Hassan C, Ryon K, Young B, Bhattacharya C, Ng DL, Granados AC, Santos YA, Servellita V, Federman S, Ruggiero P, Fungtammasan A, Chin CS, Pearson NM, Langhorst BW, Tanner NA, Kim Y, Reeves JW, Hether TD, Warren SE, Bailey M, Gawrys J, Meleshko D, Xu D, Couto-Rodriguez M, Nagy-Szakal D, Barrows J, Wells H, O'Hara NB, Rosenfeld JA, Chen Y, Steel PAD, Shemesh AJ, Xiang J, Thierry-Mieg J, Thierry-Mieg D, Iftner A, Bezdan D, Sanchez E, Campion TR Jr, Sipley J, Cong L, Craney A, Velu P, Melnick AM, Shapira S, Hajirasouliha I, Borczuk A, Iftner T, Salvatore M, Loda M, Westblade LF, Cushing M, Wu S, Levy S, Chiu C, Schwartz RE, Tatonetti N, Rennert H, Imielinski M, Mason CE. Butler D, et al. Nat Commun. 2021 Mar 12;12(1):1660. doi: 10.1038/s41467-021-21361-7. Nat Commun. 2021. PMID: 33712587 Free PMC article.

Abstract

The Severe Acute Respiratory Syndrome Coronavirus 2 (SARS-CoV-2) has caused thousands of deaths worldwide, including >18,000 in New York City (NYC) alone. The sudden emergence of this pandemic has highlighted a pressing clinical need for rapid, scalable diagnostics that can detect infection, interrogate strain evolution, and identify novel patient biomarkers. To address these challenges, we designed a fast (30-minute) colorimetric test (LAMP) for SARS-CoV-2 infection from naso/oropharyngeal swabs, plus a large-scale shotgun metatranscriptomics platform (total-RNA-seq) for host, bacterial, and viral profiling. We applied both technologies across 857 SARS-CoV-2 clinical specimens and 86 NYC subway samples, providing a broad molecular portrait of the COVID-19 NYC outbreak. Our results define new features of SARS-CoV-2 evolution, nominate a novel, NYC-enriched viral subclade, reveal specific host responses in interferon, ACE, hematological, and olfaction pathways, and examine risks associated with use of ACE inhibitors and angiotensin receptor blockers. Together, these findings have immediate applications to SARS-CoV-2 diagnostics, public health, and new therapeutic targets.

Keywords: RNA-seq; coronavirus disease 2019 (COVID-19); global health; loop-mediated isothermal amplification (LAMP); next-generation sequencing (NGS); quantitative reverse transcription polymerase chain reaction (qRT-PCR); severe acute respiratory syndrome coronavirus 2 (SARS-CoV-2).


Conflict of interest statement

Conflicts of Interest Nathan Tanner and Bradley W. Langhorst are employees at New England Biolabs.

Figures

Figure 1.
Figure 1.. Sample Processing, the Loop-Mediated Isothermal (LAMP) Reaction and Synthetic RNA Validation.
(a) Clinical and environmental samples collected with nasopharyngeal (NP) and isohelix swabs respectively, were tested with RNA-sequencing, qRT-PCR, and LAMP. (b) The test samples were prepared using an optimized LAMP protocol from NEB, with a reaction time of 30 minutes. (c) Reaction progress was measured for the Twist SARS-CoV-2 synthetic RNA (MT007544.1) from 1 million molecules of virus (106), then titrated down by log10 dilutions. The colorimetric findings of the LAMP assay are based on a yellow to pink gradient with higher copies of SARS-CoV-2 RNA corresponding to a yellow color. The limit of detection (LoD) range is shown with a gradient after 30 minutes between 10 and 100 viral copies (lower right). (d) Replicates of the titrated viral copies using LAMP, as measured by QuantiFluor fluorescence. (e) The sensitivity and specificity of the LAMP assay from 201 patients (132 negative and 69 positive for SARS-CoV-2, as measured by qRT-PCR). Thresholds are DNA quantified by the QuantiFluor.
Figure 2.
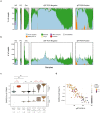
Figure 2.. Full transcriptome profiles of SARS-CoV-2 Patients with NGS, qRT-PCR, and LAMP.
(a,b) Read mapping to archaea (red), bacteria (green), fungi (yellow), human (blue), and SARS-CoV-2 (orange), and other viruses (grey), across the clinical controls (CN, CP), environmental samples, qRT-PCR negative, and qRT-PCR positive samples. (c) Clinical samples tested by qRT-PCR (Positive, n=255, or Negative, n=564) were sequenced and run through the LAMP assay. These results were compared to the buffer blanks (Negative Control, CN, n=33), Vero E6 cell extracts with SARS-CoV-2 infection (Positive Controls, CP, n=17), and Subway Samples (Environmental, Env, n=86). Read proportions are shown on the y-axis. (d) SARS-CoV-2 abundance, as measured with NGS and percentage of reads (y-axis) is compared to the Ct Threshold for qRT-PCR (x-axis), with lower Ct values representing higher viral abundance, and the LAMP reaction output (Fluorimeter values, black to yellow scale).
Figure 3.
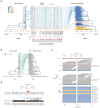
Figure 3.. Viral genome assemblies and variants
(a) Clinical samples tested by qRT-PCR (Negative, N) were compared to RNA-seq coverage (Read per Kilobase per Million Reads, RPKM, y-axis) for the set of fully-assembled positive samples (n=146, 9) vs. those with partial or no assemblies (left, n=537, 97). (b) Variant allele frequencies (VAF, x-axis) for alternative alleles (y-axis) were calculated for all variants across viral strains, with heterogenous (het, 5%0.95. (c) Proportion of het variants (y-axis) is shown for those tested by qRT-PCR and shown as negative or positive (x-axis). (d) The frequency of variants present in the GISAID global database of virus sequences (y-axis) is shown for variant types (x-axis). (e) The distribution and density of the VAF for three exemplar samples are shown relative to their variant type (top) (f) The assembled contigs (grey) the consensus variants (red dots) relative to the reference, and coverage (RPKM) are shown for a set of clinical samples, relative to the reference SARS-CoV-2 genome annotation (bottom), gene segments (colored bars), and histogram of variants from qRT-PCR positive and negative samples (variants y-axis).
Figure 4 –
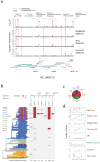
Figure 4 –. The mutational landscape SARS-CoV-2.
(a) The phylogenetic placement of these SARS-CoV-2 samples is shown on the tree (left) and the global map of known SARS-CoV-2 genomes (right). Genetic variants called from the RNA-seq data (middle) show a range of variants that are distinct from the Wuhan reference strain, and the samples from this study, highlighted in blue, show enrichment for European and Asian alleles. The annotation track on the bottom shows variants called in these samples alongside all other GISAID samples. Samples that diverge from GISAID by more than 5% in either direction are annotated, including their coordinate and substitution event. (b) Proportion of the L (green) and S strain (yellow) are shown for the NYC viruses. Phylogeny of samples from this study on the left and total GISAID samples on the right, with a map of variants in this study’s samples in the middle, colored by event type and sized by number of nucleotides impacted. Annotation track on the bottom shows frequency of alternate alleles in this study and in the GISAID database. (c) The 9-bp deletion in ORF1b (NSP1 protein) that was detected in samples from three NYPH-WCMC patients was confirmed in the GISAID database (bottom tracks). Read-level support is shown in the top tracks for two of the variants, with aligned contigs visualized below. Assembly alignments for 17 additional cases harboring this deletion, including 1 additional case from this study are shown in the bottom track. (d) Alignment of SARS-CoV-2 to SARS-CoV NSP1 protein sequence is shown, with an enlarged view showing a sequence similarity track (normalized protein alignment score in 5 amino acid sliding window) and the 9-bp deletion region delineated.
Figure 5.
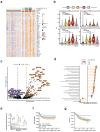
Figure 5.. Variant and Subclade Analysis
. (a) Six variant alleles were found to be significantly enriched by population allelic fraction within this set of 93 WCM/NYP cases as compared with non-NYC strains of Nextstrain clade A2 (1059:C>T P = 2.13 × 10−47, 11916:C>T P = 6.26 × 10⁻¹⁵, 18998:C>T P= 1.53 × 10⁻¹⁵, 20755:A>C P = 6.6 ×10⁻⁴, 25563:G>T P = 7.92 × 10−50, 29540:G>A P = 2.68 × 10⁻¹⁵). These variants demonstrated similar PAF enrichment within all other NYC strains as compared to non-NYC clade A2 (1059:C>T P = 3.36 × 10−146, 11916:C>T P = 3.53 × 10−74, 18998:C>T P= 3.94× 10−73, 20755:A>C P = 7.71 × 10⁻³, 25563:G>T P = 1.45 × 10−154, 29540:G>A P = 2.07 × 10−72). (b) (left) Phylogenetic tree produced by the Nextstrain analysis with clade affiliations and nodes corresponding to WCM/NYP in red and other NYC cases in green. (right) occurrence of the six NYC-enriched alleles and the 9 nucleotide deletion across genomes. (c) Raw counts of cases present within this A2–25563 subclade demonstrated a predominance of European and North American cases, with Western Europe and New York together comprising the majority of strains. (d) Fraction of A2–25563 cases from each region of the world.
Figure 6:
Figure 6:. Host transcriptome responses and risk to SARS-CoV-2.
(top row) Samples were quantified by a range of viral load, including RNA-seq (log10 SARS-CoV-2 % of reads), and qRT-PCR (Ct values) to create a three-tier range of viral load for the positive samples (right) compared to the clinically-annotated negative samples (class, red or grey) and those samples with other viral infections that were SARS-CoV-2 negative by qRT-PCR. (b) The differentially expressed genes of qRT-PCR positive patients compared to qRT-PCR patients showed up-regulated (orange) genes as well as down-regulated (purple) genes. (b) Up-regulated genes, with boxplots across all samples, include IFI6, ACE2, SHFL, HERC6, IFI27, and IFIT1, based on data from (c), which is the total set of DEGs. The full set is shown in an intersecting heat map, with a core set of up-regulated genes (orange) distinct form the set of down-regulated genes (purple), compared to genes that are not significantly differently expressed (grey) in any comparison (DESeq2, q-value <0.01, |logFC| >0.58). (d) GSEA enrichment of significant pathways, with color indicating statistical significance and circle size the number of genes on the leading edge (e) Regression coefficients for variables indicating exposure/history of exposure to ACEI/ARBs inhibitors for each of the three cohort comparisons: (left) test outcome in a cohort of patients suspected of SARS-CoV-2 infection, (middle) requirement of mechanical respiration in patients who tested positive, (right) mortality in patients who tested positive. Univariate analyses are shown as red circles. The green triangles coefficients are when correcting for age, sex, and baseline IL-6 levels take upon admission. The blue squares are from a model that includes age, sex, and IL-6 as well as comorbidities including CAD/CHD, diabetes, being overweight, or obesity, and self-reported race and ethnicity. Additionally, open markers indicate the same analyses but restricted to only patients with clinically diagnosed hypertension. (f) Curves for patients requiring mechanical respiration (identified by intubation procedure notes) as a function of drug class (g) and survival, conditioned on hypertension status and ACEI/ARB exposure status.

References

    1. Agata J, Ura N, Yoshida H, Shinshi Y, Sasaki H, Hyakkoku M, Taniguchi S, Shimamoto K. Olmesartan Is an Angiotensin II Receptor Blocker with an Inhibitory Effect on Angiotensin-Converting Enzyme. Hypertension Research 29, 865–874 (2006). - PubMed
    1. Ajioka RS, Phillips JD, Kushner JP. Biosynthesis of heme in mammals. Biochim Biophys Acta. 2006. July;1763(7):723–36 - PubMed
    1. Amanat F, Nguyen T, Chromikova V, Strohmeier S, Stadlbauer D, Javier A, Jiang K, Asthagiri-Arunkumar G, Polanco J, Bermudez-Gonzalez M, Caplivski D, Cheng A, Kedzierska K, Vapalahti O, Hepojoki J, Simon V, Krammer F. A serological assay to detect SARS-CoV-2 seroconversion in humans. MedRxiv. 2020. March 18 https://www.medrxiv.org/content/10.1101/2020.03.17.20037713v1 - DOI - PMC - PubMed
    1. Andrews S. FASTQC A Quality Control tool for High Throughput Sequence Data. Babraham Inst. (2015).
    1. Benjamini Y, Hochberg Y. Controlling the False Discovery Rate: A Practical and Powerful Approach to Multiple Testing. J. R. Stat. Soc. Ser. B (1995)

Publication types

LinkOut - more resources