[Preprint]. 2020 May 15:2020.05.12.091082.
doi: 10.1101/2020.05.12.091082.

Androgen Regulates SARS-CoV-2 Receptor Levels and Is Associated with Severe COVID-19 Symptoms in Men

Affiliations

Androgen Regulates SARS-CoV-2 Receptor Levels and Is Associated with Severe COVID-19 Symptoms in Men

Zaniar Ghazizadeh et al. bioRxiv. .

Update in

Abstract

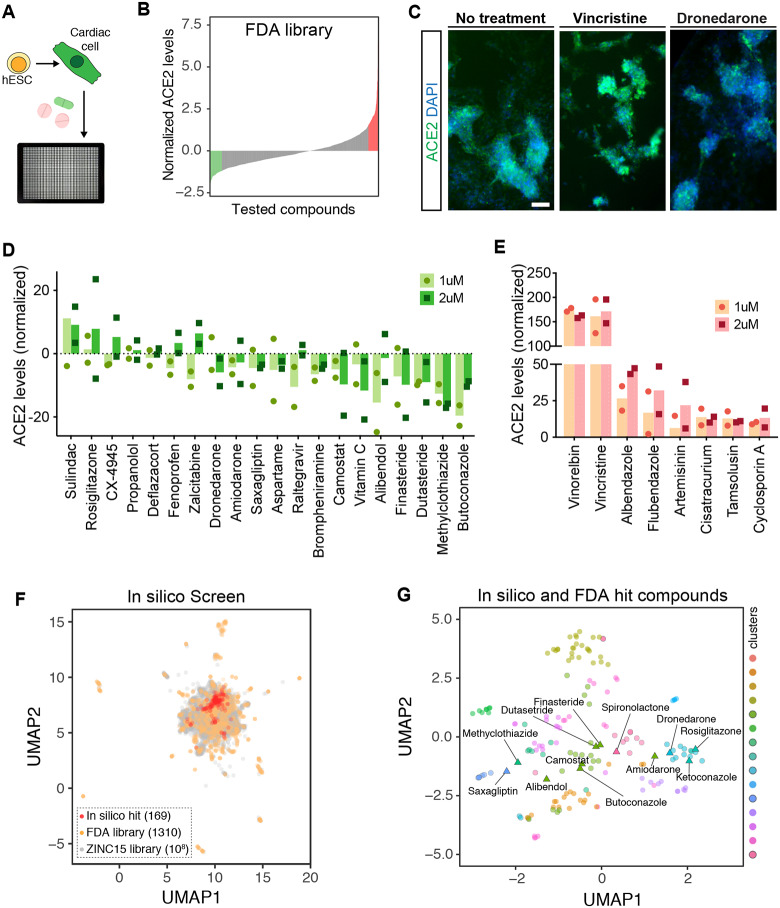
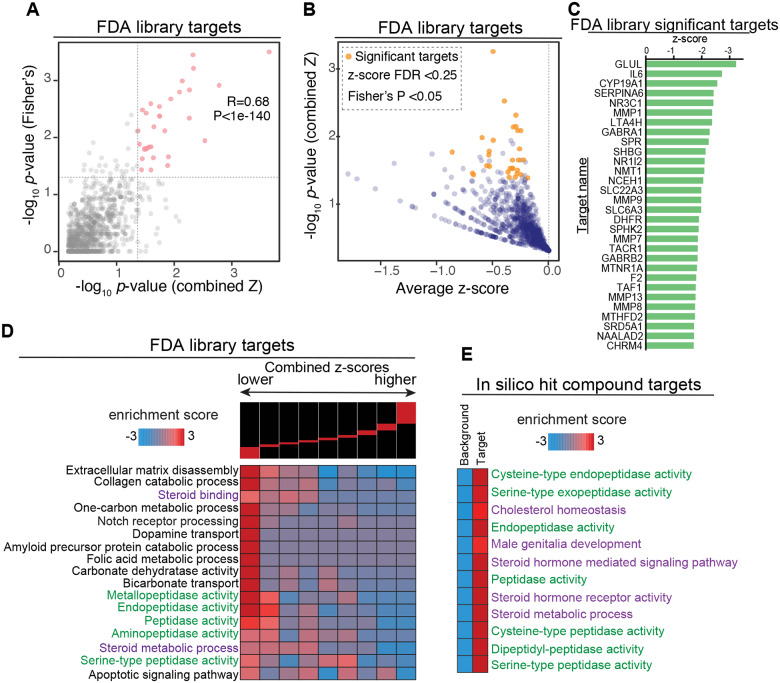
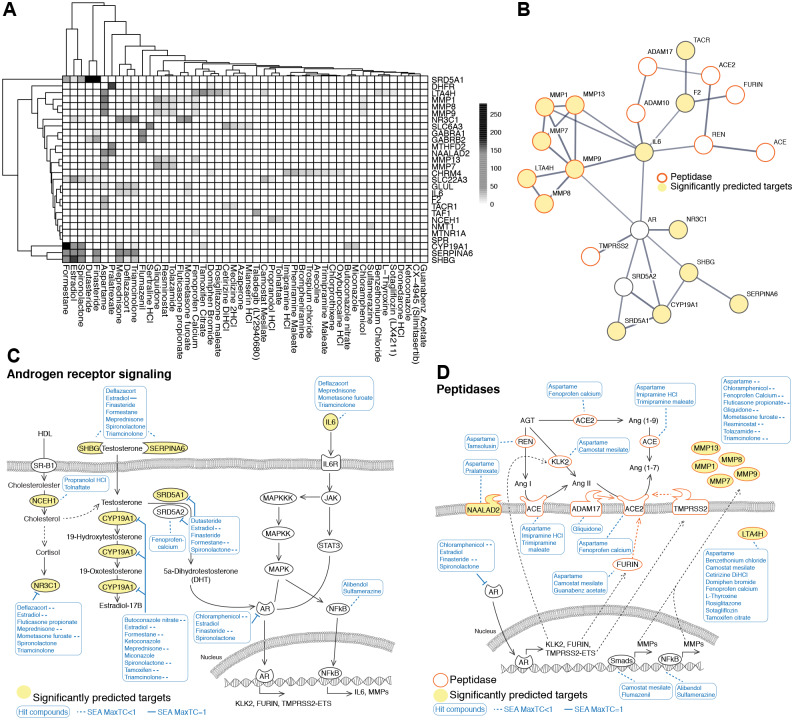
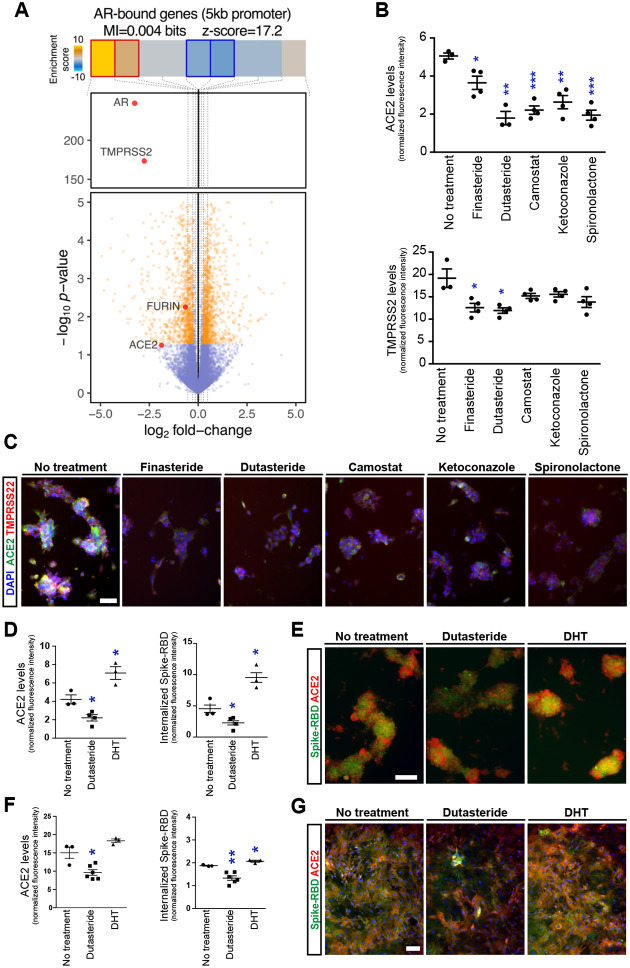
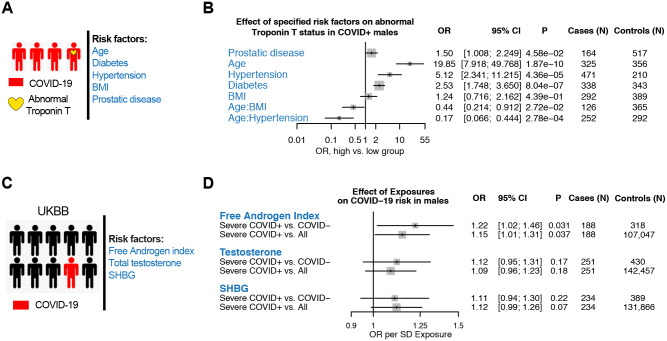
Severe acute respiratory syndrome coronavirus 2 (SARS-CoV-2) infection has led to a global health crisis, and yet our understanding of the disease pathophysiology and potential treatment options remains limited. SARS-CoV-2 infection occurs through binding and internalization of the viral spike protein to angiotensin converting enzyme 2 (ACE2) on the host cell membrane. Lethal complications are caused by damage and failure of vital organs that express high levels of ACE2, including the lungs, the heart and the kidneys. Here, we established a high-throughput drug screening strategy to identify therapeutic candidates that reduce ACE2 levels in human embryonic stem cell (hESC) derived cardiac cells. Drug target analysis of validated hit compounds, including 5 alpha reductase inhibitors, revealed androgen signaling as a key modulator of ACE2 levels. Treatment with the 5 alpha reductase inhibitor dutasteride reduced ACE2 levels and internalization of recombinant spike receptor binding domain (Spike-RBD) in hESC-derived cardiac cells and human alveolar epithelial cells. Finally, clinical data on coronavirus disease 2019 (COVID-19) patients demonstrated that abnormal androgen states are significantly associated with severe disease complications and cardiac injury as measured by blood troponin T levels. These findings provide important insights on the mechanism of increased disease susceptibility in male COVID-19 patients and identify androgen receptor inhibition as a potential therapeutic strategy.


Conflict of interest statement

Competing interests P.N. receives grants from Apple, Amgen, and Boston Scientific, and personal fees from Apple and Blackstone Life Sciences, all outside the submitted work. F.F. receives grants from Takeda Pharmaceuticals on work outside of the submitted work.

Figures

Figure 1.
Figure 1.. High-throughput in-vitro and in silico screenings identify drugs that modulate ACE2 expression in hESC-derived cardiomyocytes.
A-B) High-throughput screening of Selleckchem FDA-approved drug library identifies drugs that increase and decrease ACE2 expression in hESC-derived cardiomyocytes. C) Representative immunofluorescent images of cells treated with vehicle, vincristine and dronedarone at 1μM. Scale bar:100 μm. Dose response of hits that D) decreased, and E) increased ACE2 expression in hESC-derived cardiomyocytes culture. F) two dimensional visualization of molecular features (Morgan fingerprints) for the in vitro and in silico tested compounds using UMAP. For the ZINC15 library, the points are sub-sampled by a factor of 103. G) UMAP visualization of the in vitro (labeled) and in silico (unlabeled) hit compounds. Also shown are the K-means cluster memberships based on their Morgan fingerprints.
Figure 2.
Figure 2.. Target prediction analysis identified shared pathways among ACE2 regulators.
A) We employed two independent tests for identifying the genes that are most likely targeted by the effective treatments: (i) a combined z-score approach, where normalized z-scores from all the treatments associated with a gene are integrated, and (ii) a Fisher’s exact test to assess the enrichment of a gene among those that are targets of treatments with negative z-scores. Here we have shown the correlation between the p--values reported by these two independent approaches. B) A one-sided volcano plot showing the average z-score vs. -log of p-value for all genes with negative z-scores. The genes that pass our statistical thresholds are marked in gold (combined z-score FDR<0.25 and Fisher’s p-value <0.05). C) The identified target genes along with their combined z-score, associated p-value and FDRs. Also included are the total number of compounds each gene is likely targeted by, and the number of those that result in lower ACE2 expression (z-score<0). D) Gene-set enrichment analysis using iPAGE for the target genes identified from FDA-approved library with negative z-score. Genes were ordered based on their combined z-score from left to right and divided into nine equally populated bins. The enrichment and depletion pattern of various gene-sets is then assessed across this spectrum using mutual information. Red boxes show enrichment and blue boxes show depletion. E) Gene-set enrichment analysis for the in silico hits. Similar to (D), genes were grouped into those that are likely targeted by the identified compounds and those that are not (i.e. background). We then assessed the enrichment of each pre-compiled gene-set among the targets using iPAGE.
Figure 3.
Figure 3.. Androgen signaling regulates peptidase expression.
A) The drug-gene interaction matrix for the 30 significantly enriched drug target genes from Figu 2C that are deemed functional in their respective analyses. Shading represents the significance of the predicted interaction. B) STRING protein-protein interaction network was used to identify interactions between our list of significantly enriched genes from Figure 2C (depicted as significantly predicted targets and yellow circles), androgen signaling pathway components (AR and SRD5A2), and proteins implicated in ACE2 regulation (ACE, ADAM10, ADAM17, FURIN, REN, TMPRSS2). Minimum required interaction score was set to 0.7 corresponding to high confidence and edge thickness indicating the degree of data support. C) SEA predicted drug-protein target interactions (blue lines and boxes) in the androgen signaling pathway. Yellow ovals represent significantly enriched genes from Figure 2C. Dashed lines represent MacTC <1. D) The expression of ACE2 related peptidases is regulated by AR and other transcription factors that are targets of our candidate drugs. MaxTC, maximum tanimoto similarity between compounds from ref_target to compounds from query_target in [0,1] with 1 being identical upto the resolution of the fingerprint.
Figure 4.
Figure 4.. Androgen receptor signaling modulates ACE2 and TMPRSS2 levels and Spike-RBD internalization
A) Volcano plot visualizing gene expression changes in response to AR knockdown in LNCaP cells. Genes of interest are labeled and shown in red. Also shown are the enrichment and depletion pattern of AR target genes (i.e. genes with promoter AR binding) as a heatmap along with the mutual information value and its associated z-score. The log-fold change values were divided into equally populated bins and the enrichment of AR-bound genes in each bin was assessed using hypergeometric p-values and colored accordingly (gold for enrichment and blue for depletion; red and blue borders mark bins that are statistically significant. B-C) Effect of candidate androgen signaling inhibitors on ACE2 and TMPRSS2 levels on the surface of cardiac cells with their corresponding Immunofluorescence images. D-G) Differential effect of Dutasteride (potent inhibitor of Testosterone to DHT conversion) and DHT on the membrane ACE2 levels and spike-RBD protein entry to cardiomyocytes (D-E) and Pulmonary epithelial cells (F-G) with their corresponding immunofluorescence images. Scale bar= 50 μm in C and 100 μm in E &G.*p-value<0.05 **p-value<0.01 ***p-value<0.001
Figure 5.
Figure 5.. Effects of Androgen signaling on outcomes associated with COVID-19
A. Schematic representation of outcomes and risk factors studied in patients with Covid-19 at Yale New Haven Hospital. B. The effects of age, BMI, prostatic disease, hypertension and diabetes on the odds of having abnormal troponin T in male patients with Covid-19 in Yale patients. Age, troponin T and BMI were dichotomized during data collection. Age: 40–65y vs 65+, BMI: <30 vs >=30, troponin T: normal (<0.01 ng/ml) vs abnormal (>=0.01 ng/ml). For the primary outcome, the odds ratio were calculated for the pre-specified subgroups. C. Schematic representation of the outcomes and risk factors studied in the UK Biobank (UKBB) cohort. D. Association of androgen indices on Covid-19 susceptibility and severity in males among the UKBB. Association of normalized free androgen index, testosterone, and SHBG indices with two COVID-19 case/control models: for individuals tested with COVID comparing Severe COVID+ cases vs. COVID− controls, and for all white British individuals from the UK Biobank English recruitment centers with available COVID-test reporting, comparing Severe COVID+ cases vs. All controls. Severe COVID+ is defined as hospitalized with at least one COVID-19+ test. Analyses were adjusted for age, normalized Townsend deprivation index, normalized body mass index, and the first ten principal components of genetic ancestry. SHBG= sex-hormone binding globulin, Severe COVID+ = Tested positive for coronavirus disease 2019 and hospitalized, COVID− = Tested negative for coronavirus disease 2019, All = all individuals with reported COVID-19 testing from the UK Biobank English recruitment centers, OR = odds ratio, SD = standard deviation, CI= confidence interval.

Similar articles

References

    1. Guan W.-J. et al. Clinical Characteristics of Coronavirus Disease 2019 in China. N. Engl. J. Med. 382, 1708–1720 (2020). - PMC - PubMed
    1. Shi S. et al. Association of Cardiac Injury With Mortality in Hospitalized Patients With COVID-19 in Wuhan, China. JAMA Cardiol (2020) doi:10.1001/jamacardio.2020.0950 - DOI - PMC - PubMed
    1. Guo T. et al. Cardiovascular Implications of Fatal Outcomes of Patients With Coronavirus Disease 2019 (COVID-19). JAMA Cardiol (2020) doi:10.1001/jamacardio.2020.1017 - DOI - PMC - PubMed
    1. Hamming I. et al. Tissue distribution of ACE2 protein, the functional receptor for SARS coronavirus. A first step in understanding SARS pathogenesis. J. Pathol. 203, 631–637 (2004). - PMC - PubMed
    1. Vabret N. et al. Immunology of COVID-19: current state of the science. Immunity (2020) doi:10.1016/j.immuni.2020.05.002 - DOI - PMC - PubMed

Publication types