[Preprint]. 2020 Jul 13:2020.05.06.081695.
doi: 10.1101/2020.05.06.081695.

Single-cell longitudinal analysis of SARS-CoV-2 infection in human airway epithelium

Affiliations

Single-cell longitudinal analysis of SARS-CoV-2 infection in human airway epithelium

Neal G Ravindra et al. bioRxiv. .

Update in

Abstract

SARS-CoV-2, the causative agent of COVID-19, has tragically burdened individuals and institutions around the world. There are currently no approved drugs or vaccines for the treatment or prevention of COVID-19. Enhanced understanding of SARS-CoV-2 infection and pathogenesis is critical for the development of therapeutics. To reveal insight into viral replication, cell tropism, and host-viral interactions of SARS-CoV-2 we performed single-cell RNA sequencing of experimentally infected human bronchial epithelial cells (HBECs) in air-liquid interface cultures over a time-course. This revealed novel polyadenylated viral transcripts and highlighted ciliated cells as a major target of infection, which we confirmed by electron microscopy. Over the course of infection, cell tropism of SARS-CoV-2 expands to other epithelial cell types including basal and club cells. Infection induces cell-intrinsic expression of type I and type III IFNs and IL6 but not IL1. This results in expression of interferon-stimulated genes in both infected and bystander cells. We observe similar gene expression changes from a COVID-19 patient ex vivo. In addition, we developed a new computational method termed CONditional DENSity Embedding (CONDENSE) to characterize and compare temporal gene dynamics in response to infection, which revealed genes relating to endothelin, angio-genesis, interferon, and inflammation-causing signaling pathways. In this study, we conducted an in-depth analysis of SARS-CoV-2 infection in HBECs and a COVID-19 patient and revealed genes, cell types, and cell state changes associated with infection.


Conflict of interest statement

Declaration of interests: The authors declare no competing interests.

Figures
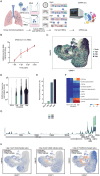
Figure 1:
Figure 1:
scRNA-seq reveals SARS-CoV-2 infection of HBECs. A. Schematic of the experiment. Human bronchial epithelial cells (HBECs) were cultured and infected or not (mock) with SARS-CoV-2. Infected cultures were collected for scRNA-seq at 1, 2 and 3 days post infection (dpi). B. RT-qPCR in cultured HBEC to detect viral transcripts at 1 hour post-infection (hpi), 1, 2, and 3 days post-infection (dpi) (copies/well). C. UMAP visualization of the scRNA-seq gene counts after batch correction. Each point represents a cell, colored by sample. D. Normalized counts of viral counts in each condition. For each cell, viral counts were determined by aligning reads to a single, genome-wide reference. E. Percent of cells infected by SARS-CoV-2, based on a viral genes count threshold (see Materials and Methods) F. Normalized heatmap of the viral Open Reading Frame (ORF) counts in each condition. Reads were aligned to each 10 SARS-CoV-2 ORFs. G. Coverage plot of viral reads aligned to SARS-CoV-2 genome. The sequencing depth was computed for each genomic position for each condition. As infection progresses, coverage becomes more dispersed on the genome. H. UMAP visualizations of infected and bystander cells in each condition after batch correction. Bystander cells are defined as cells that remained uninfected in HBEC samples challenged with SARS-CoV-2.
Figure 2:
Figure 2:
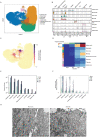
SARS-CoV-2 cell tropism. A. UMAP visualization of the cell clusters manually annotated. Cells were first clustered with the Louvain algorithm, then annotated according to a panel of marker genes. B. Violin plot of annotation marker genes and SARS-CoV-2 putative relevant genes based on the recent literature. C. Uniform Manifold Approximation and Projection (UMAP) visualization of the normalized counts of SARS-CoV-2 reads. Reads were determined here as in Figure 1D. D. Proportion of infected cells across conditions and cell types. E. Histogram of the number of infected cells per cell type across conditions. F. Infection score inferred from Manifold Enhancement of Latent Dimensions (MELD) showing extent of infection per cell stratified by cell time. G. Transmission electron microscopy image of mock (left) and SARS-CoV-2 human bronchial epithelial cell (HBEC) reveal infected ciliated cells at 2 days post infection (dpi) (right). Scale (bottom) corresponds to 500 nm. Red arrows denoted virus particles and black arrows cilia.
Figure 3:
Figure 3:
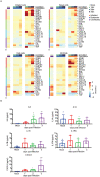
Expression of known entry determinants across bronchial epithelial cell types. A. UMAP visualizations, colored by expression of four receptors and proteases expressed in human bronchial epithelial cells (HBECs): ACE2, TMPRSS2, TMPRSS4 and CTSL. B-E. Heatmaps of receptors and proteases in ciliated (B.), basal (C.), club (D.) and BC/Club cells (E.).
Figure 4:
Figure 4:
SARS-CoV-2 infection induces robust innate immune response. A-D. Heatmaps of expression of key innate immune and inflammatory genes in ciliated (A.), basal (B.), club (C.) and BC/club cells (D.) This reveals infected cells up-regulate type I and III interferons, IL-6, and chemokines in a cell-intrinsic manner while interferon-stimulated genes are induced in both infected and bystander cells. Infection also stimulates IL-6 protein secretion. Minimal changes in IL-1A, IL-1B, and IL1RN expression and protein secretion are observed.
Figure 5:
Figure 5:
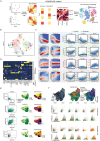
Expression of differentially expressed genes. (A) Schematic of the differential expression analysis. Two main cell populations are observed: bystander cells that were not infected by the virus at 3 days post infection (dpi) and infected cells that contain active viral replication and transcription at 3 dpi. (B) Volcano plots highlighting the most differentially expressed genes between infected and bystander cells in ciliated cells at 3 dpi as measured by earth mover’s distance (EMD). (C) Heatmap of the most differentially expressed genes between uninfected, infected and bystander cells in ciliated cells in all conditions. (D) Volcano plot of differentially expressed genes in ciliated cells (infected vs. bystander). Age-associated genes in human lung are color-coded (blue, increase in expression with age; orange, decrease in expression with age. (E) Venn diagram highlighting the intersection between lung age-associated genes and SARS-CoV-2 regulated genes in ciliated cells. Statistical significance of the overlap was assessed by hypergeometric test. (F) Characteristics of age-associated genes that are affected by SARS-CoV-2 infection in ciliated cells. Statistical significance of the interaction between the directionality of SARS-CoV-2 regulation (induced or repressed) and the directionality of age-association (increase or decrease with age) was assessed by two-tailed Fischer’s exact test. (G) DAVID gene ontology and pathway analysis of genes repressed by SARS-CoV-2 infection in ciliated cells that also decrease in expression with aging.
Figure 6:
Figure 6:
Transcriptomic dynamics across time in infected and bystander cells. (A) Overview of the CONditional DENSity Embedding (CONDENSE) method to characterize transcriptional dynamics over time (B) Clustering genes by their dynamical, joint density, stratified by infected and bystander cells, using archetypal analysis. (C) Images show conditional density estimates for archetypes identified in genes embedded into UMAP space. Scatter plots show LOESS fit for gene expression versus inferred times for various genes in archetypal clusters that exhibit differential dynamics across time. (D) Loading of viral and immune genes of interest onto the archetypes. (E) RNA velocity of genes of interest colored by infection status for individual cells. (F) RNA velocities fit separately with infected and bystander cells, highlighting genes of interest and latent time representations learned from RNA velocity.
Figure 7:
Figure 7:
SARS-CoV-2 transcriptional dynamics in COVID-19 pediatric airway. (A) Single cells from endotracheal aspirate fluid from a healthy control and a pediatric patient with COVID-19 at the time of intubation and extubation. (B) Cell types identified in endotracheal samples. (C) Abundance of various cell types in each clinical sample. (D) Percentage of cells per cell type with at least one read aligned to the viral genome. (E) Expression of immune system genes of interest in epithelial cells from pediatric BALFs. (F) Expression of top 25 differentially expressed genes between intubated and extubated samples amongst epithelial cells from pediatric samples. (G) Differential gene expression for distributional distance versus corrected p-value for epithelial cells in pediatric endotracheal aspirate.

References

    1. Wang C., Horby P. W., Hayden F. G., and Gao G. F., “A novel coronavirus outbreak of global health concern,” The Lancet, vol. 395, no. 10223, pp. 470–473, 2020. - PMC - PubMed
    1. Zhou P., Yang X.-L., Wang X.-G., Hu B., Zhang L., Zhang W., Si H.-R., Zhu Y., Li B., Huang C.-L., et al., “A pneumonia outbreak associated with a new coronavirus of probable bat origin,” Nature, vol. 579, no. 7798, pp. 270–273, 2020. - PMC - PubMed
    1. Cui J., Li F., and Shi Z.-L., “Origin and evolution of pathogenic coronaviruses,” Nature reviews Microbiology, vol. 17, no. 3, pp. 181–192, 2019. - PMC - PubMed
    1. Tang Q., Song Y., Shi M., Cheng Y., Zhang W., and Xia X.-Q., “Inferring the hosts of coronavirus using dual statistical models based on nucleotide composition,” Scientific reports, vol. 5, p. 17155, 2015. - PMC - PubMed
    1. W. H. Organization, Novel Coronavirus(2019-nCoV), Situation Report 22, 2020.

Publication types