[Preprint]. 2020 May 22:2020.05.13.092619.
doi: 10.1101/2020.05.13.092619.

Convergent Antibody Responses to SARS-CoV-2 Infection in Convalescent Individuals

Affiliations

Convergent Antibody Responses to SARS-CoV-2 Infection in Convalescent Individuals

Davide F Robbiani et al. bioRxiv. .

Update in

  • Convergent antibody responses to SARS-CoV-2 in convalescent individuals.
    Robbiani DF, Gaebler C, Muecksch F, Lorenzi JCC, Wang Z, Cho A, Agudelo M, Barnes CO, Gazumyan A, Finkin S, Hägglöf T, Oliveira TY, Viant C, Hurley A, Hoffmann HH, Millard KG, Kost RG, Cipolla M, Gordon K, Bianchini F, Chen ST, Ramos V, Patel R, Dizon J, Shimeliovich I, Mendoza P, Hartweger H, Nogueira L, Pack M, Horowitz J, Schmidt F, Weisblum Y, Michailidis E, Ashbrook AW, Waltari E, Pak JE, Huey-Tubman KE, Koranda N, Hoffman PR, West AP Jr, Rice CM, Hatziioannou T, Bjorkman PJ, Bieniasz PD, Caskey M, Nussenzweig MC. Robbiani DF, et al. Nature. 2020 Aug;584(7821):437-442. doi: 10.1038/s41586-020-2456-9. Epub 2020 Jun 18. Nature. 2020. PMID: 32555388 Free PMC article.

Abstract

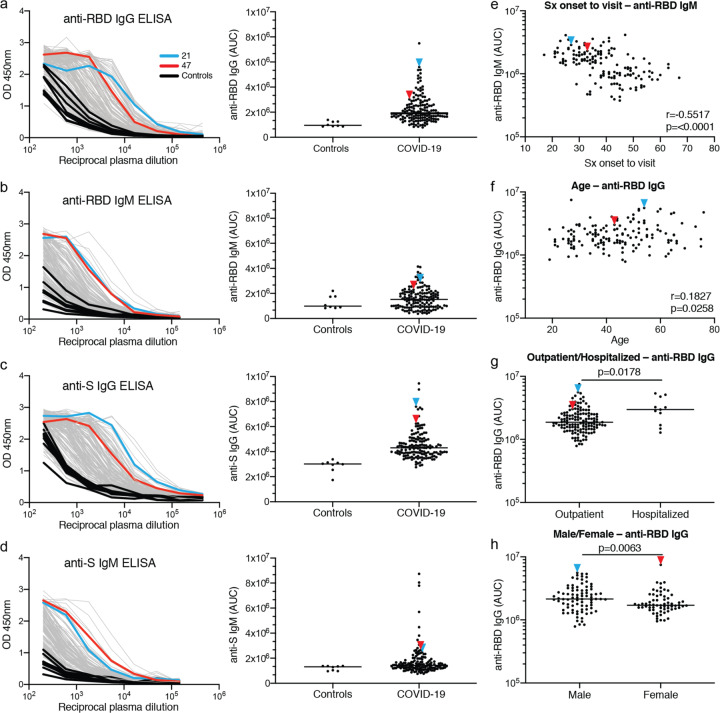
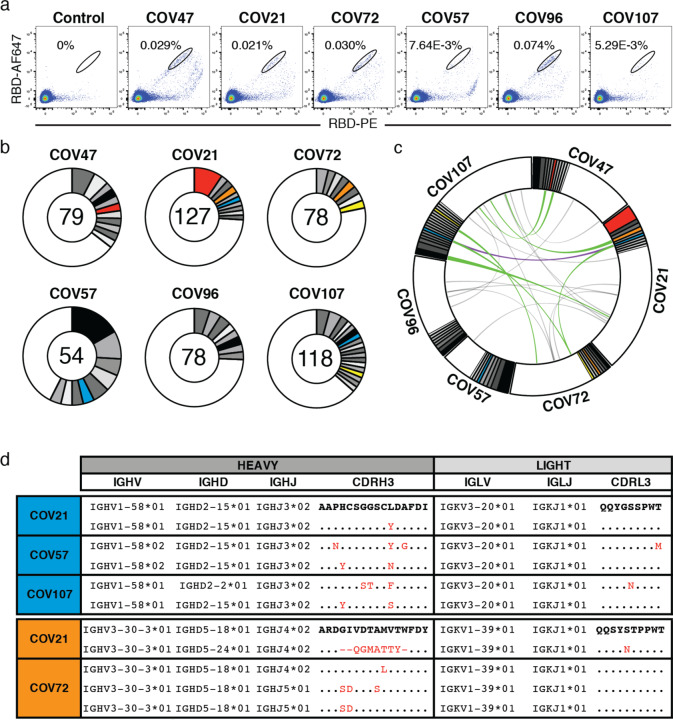
During the COVID-19 pandemic, SARS-CoV-2 infected millions of people and claimed hundreds of thousands of lives. Virus entry into cells depends on the receptor binding domain (RBD) of the SARS-CoV-2 spike protein (S). Although there is no vaccine, it is likely that antibodies will be essential for protection. However, little is known about the human antibody response to SARS-CoV-21-5. Here we report on 149 COVID-19 convalescent individuals. Plasmas collected an average of 39 days after the onset of symptoms had variable half-maximal neutralizing titers ranging from undetectable in 33% to below 1:1000 in 79%, while only 1% showed titers >1:5000. Antibody cloning revealed expanded clones of RBD-specific memory B cells expressing closely related antibodies in different individuals. Despite low plasma titers, antibodies to three distinct epitopes on RBD neutralized at half-maximal inhibitory concentrations (IC50s) as low as single digit ng/mL. Thus, most convalescent plasmas obtained from individuals who recover from COVID-19 do not contain high levels of neutralizing activity. Nevertheless, rare but recurring RBD-specific antibodies with potent antiviral activity were found in all individuals tested, suggesting that a vaccine designed to elicit such antibodies could be broadly effective.


Conflict of interest statement

Declaration of conflict: In connection with this work The Rockefeller University has filed a provisional patent application on which D.F.R. and M.C.N. are inventors.

Figures

Extended Data Figure 1.
Extended Data Figure 1.. Clinical correlates.
a, Age distribution (Y axis) for all males and females in the cohort p=0.2074. b, Duration of symptoms in days (Y axis) for all males and females in the cohort p=0.8704. c, Time between symptom onset and plasma collection (Y axis) for all males and females in the cohort p=0.5514. d, Subjective symptom severity on a scale of 0–10 (Y axis) for all males and females in the cohort p=0.1888. e, Age distribution (Y axis) for all cases and contacts in the cohort p=0.0305. f, Duration of symptoms in days (Y axis) for all cases and contacts in the cohort p=0.1241. g, Time between symptom onset and plasma collection in days (Y axis) for all cases and contacts in the cohort p=0.1589. h, Symptom severity (Y axis) for all cases and contacts in the cohort p=0.0550. i, Age distribution (Y axis) for all outpatient and hospitalized participants p=0.0024. j, Duration of symptoms in days (Y axis) for all outpatient and hospitalized participants in the cohort p=<0.0001. k, Time between symptom onset and plasma collection in days (Y axis) for all outpatient and hospitalized participants in the cohort p=0.0001. l, Symptom severity (Y axis) for all outpatient and hospitalized participants in the cohort p=<0.0001. Horizontal bars indicate median values. Statistical significance was determined using two-tailed Mann-Whitney U test.
Extended Data Figure 2.
Extended Data Figure 2.. Clinical correlates of plasma antibody titers.
a, AUC for IgG anti-RBD (Y axis) for all cases and contacts in the cohort p=0.0107. b, AUC for IgM anti-RBD (Y axis) for all cases and contacts in the cohort p=0.5371. c, AUC for IgG anti-S (Y axis) for all cases and contacts in the cohort p=0.0135. d, AUC for IgM anti-S (Y axis) for all cases and contacts in the cohort p=0.7838. e, AUC for IgM anti-RBD (Y axis) for all males and females in the cohort p=0.9597. f, AUC for IgG anti-S (Y axis) for all males and females in the cohort p=0.0275. g, AUC for IgM anti-S (Y axis) for all males and females in the cohort p=0.5363. h, AUC for IgM anti-RBD (Y axis) for all outpatient and hospitalized participants in the cohort p=0.0059. i, AUC for IgG anti-S (Y axis) for all outpatient and hospitalized participants in the cohort p=0.0623. j, AUC for IgM anti-S (Y axis) for all outpatient and hospitalized participants in the cohort p=0.2976. Horizontal bars indicate median values. Statistical significance was determined using two-tailed Mann-Whitney U test.
Extended Data Figure 3.
Extended Data Figure 3.. Additional clinical correlates of plasma antibody titers.
a, Time between symptom onset and plasma collection in days (X axis) plotted against AUC for IgG anti-RBD (Y axis) r=−0.0261 p=0.7533. b, Time between symptom onset and plasma collection in days (X axis) plotted against AUC for IgG anti-S (Y axis) r=−0.1495 p=0.0697. c, Time between symptom onset and plasma collection in days (X axis) plotted against AUC for IgM anti-S (Y axis) r=0.1496 p=0.0695. d, Age (X axis) plotted against AUC for IgM anti-RBD (Y axis) r=0.0172 p=0.8355. e, Age (X axis) plotted against AUC for IgG anti-S (Y axis) r=0.1523 p=0.0638. f, Age (X axis) plotted against AUC for IgM anti-S (Y axis) r=0.0565 p=0.4934. g, Duration of symptoms in days (X axis) plotted against AUC for IgG anti-RBD (Y axis) r=0.1525, p=0.0633. h, Duration of symptoms in days (X axis) plotted against AUC for IgM anti-RBD (Y axis) r=−0.3187, p=<0.0001. i, Duration of symptoms in days (X axis) plotted against AUC for IgG anti-S (Y axis) r=0.0329, p=0.6904. j, Duration of symptoms in days (X axis) plotted against AUC for IgM anti-S (Y axis) r=0.0824, p=0.3177. k, Severity of symptoms (X axis) plotted against AUC for IgG anti-RBD (Y axis) r=0.2679 p=0.0010. l, Severity of symptoms (X axis) plotted against AUC for IgM anti-RBD (Y axis) r=−0.1943 p=0.0176. m, Severity of symptoms (X axis) plotted against AUC for IgG anti-S (Y axis) r=0.1187 p=0.1492. n, Severity of symptoms (X axis) plotted against AUC for IgM anti-S (Y axis) r=0.1597 p=0.0517. All correlations were analyzed by two-tailed Spearman’s.
Extended Data Figure 4.
Extended Data Figure 4.. Diagrammatic representation of the SARS-CoV2 pseudovirus luciferase assay.
a, Co-transfection of pNL4–3ΔEnv-nanoluc and pSARS-CoV-2 spike vectors into 293T cells leads to production of SARS-CoV-2 Spike-pseudotyped HIV-1 particles (SARS-CoV-2 pseudovirus) carrying the Nanoluc gene. b, SARS-CoV-2 pseudovirus is incubated for 1 h at 37°C with plasma or monoclonal antibody dilutions. The virus-antibody mixture is used to infect ACE2-expressing 293T cells, which will express nanoluc Luciferase upon infection. c, Relative luminescence units (RLU) reads from lysates of ACE2-expressing 293T cells infected with increasing amounts of SARS-CoV-2 pseudovirus.
Extended Data Figure 5.
Extended Data Figure 5.. Clinical correlates of neutralization.
a, Anti-RBD IgM AUC (X axis) plotted against NT50 (Y axis) r=0.3119, p=0.0001. b, Anti-S IgM AUC (X axis) plotted against NT50 (Y axis) r=0.3211, p=<0.0001. c, Duration of symptoms in days (X axis) plotted against NT50 (Y axis) r=0.1997, p=0.0146. d, Time between symptom onset and plasma collection in days (X axis) plotted against NT50 (Y axis) r=−0.1344, p=0.1033. e, Symptom severity (X axis) plotted against NT50 (Y axis) r=0.2234, p=0.0062. f, Age (X axis) plotted against NT50 (Y axis) r=0.3005, p=0.0002. All correlations were analyzed by two-tailed Spearman’s. Dotted line (NT50=5) represents lower limit of detection (LLOD) of pseudovirus neutralization assay. Samples with undetectable neutralizing titers were plotted at LLOD.
Extended Data Figure 6.
Extended Data Figure 6.. Flow cytometry.
Gating strategy used for cell sorting. Gating was on singlets that were CD20+ and CD3CD8CD16Ova. Sorted cells were RBD-PE+ and RBD-AF647+.
Extended Data Figure 7.
Extended Data Figure 7.. Frequency distributions of human V genes.
The two-tailed t test with unequal variance was used to compare the frequency distributions of human V genes of anti-SARS-CoV-2 antibodies from this study to Sequence Read Archive SRP010970.
Extended Data Figure 8.
Extended Data Figure 8.. Analysis of antibody somatic hypermutation and CDR3 length.
a, For each individual, the number of somatic nucleotide mutations (Y axis) at the IGVH and IGVL are shown on the left panel, and the amino acid length of the CDR3s (Y axis) are shown on the right panel. The horizontal bar indicated the mean. b, same as in a but for all antibodies combined. c, Distribution of the hydrophobicity GRAVY scores at the IGH CDR3 in antibody sequences from this study compared to a public database (see Methods).
Extended Data Figure 9.
Extended Data Figure 9.. Binding of the monoclonal antibodies to the RBD of SARS-CoV-2 and SARS-CoV.
a, EC50 values for binding to the RBD of SARS-CoV-2. b and c, Binding curves and EC50 values for binding to the RBD of SARS-CoV.
Extended Data Figure 10.
Extended Data Figure 10.. Biolayer interferometry experiment.
showing binding of antibodies C144, C101, C002, C121, C009, C019 (see also main text Fig. 4). Graphs show secondary antibody binding to preformed C121 IgG-RBD complexes. The table displays the shift in nanometers after second antibody (Ab2) binding to the antigen in the presence of the first antibody (Ab1). Values are normalized by the subtraction of the autologous antibody control.
Figure 1.
Figure 1.. Plasma antibodies against SARS-CoV-2.
a-d, Graphs show results of ELISAs measuring plasma reactivity to RBD (a, b) and S protein (c, d). Left shows optical density units at 450 nm (OD, Y axis) and reciprocal plasma dilutions (X axis). Negative controls in black; individuals 21, and 47 in blue and red lines and arrowheads, respectively. Right shows normalized area under the curve (AUC) for controls and each of 149 individuals in the cohort. e, Symptom (Sx) onset to time of sample collection in days (X axis) plotted against normalized AUC for IgM binding to RBD (Y axis) r=0.5517 and p=<0.0001. f, Participant age in years (X axis) plotted against normalized AUC for IgG binding to RBD (Y axis) r=0.1827 and p=0.0258. The r and p values for the correlations in e and f were determined by two-tailed Spearman’s. g, IgG anti-RBD normalized AUC for outpatients and hospitalized individuals p=0.0178. h, IgG anti-RBD normalized AUC for males and females p=0.0063. For g and h horizontal bars indicate median values. Statistical significance was determined using two-tailed Mann-Whitney U test.
Figure 2.
Figure 2.. Neutralization of SARS-CoV-2 pseudovirus by plasma.
a, Graph shows normalized relative luminescence values (RLU, Y axis) in cell lysates of 293TACE2 cells 48 hours after infection with nanoluc-expressing SARS-CoV-2 pseudovirus in the presence of increasing concentrations of plasma (X axis) derived from 149 participants (grey, except individuals 47 and 21 in red, and blue lines, bars and arrowheads, respectively) and 3 negative controls (black lines). Standard deviations of duplicates of one representative experiment are shown. b, Ranked average half-maximal inhibitory plasma neutralizing titer (NT50) for the 59 of 149 individuals with NT50s >500 and individual 107. See also Extended Data Table 1. Asterisks indicate donors from which antibody sequences were derived. c, AUC for anti-RBD IgG ELISA (X axis) plotted against NT50 (Y axis) r=0.6432, p=<0.0001. d, AUC for anti-S IgG ELISA (X axis) plotted against NT50 (Y axis) r=0.6721, p=<0.0001. e, NT50 for outpatients and hospitalized individuals p=0.0495. f, NT50 for all males and females in the cohort p=0.0031. Dotted line in c to f (NT50=5) represents lower limit of detection (LLOD). Samples with undetectable neutralizing titers were plotted at LLOD. Correlations in c and d were determined by two-tailed Spearman’s. Statistical significance in e and f was determined using two-tailed Mann-Whitney U test. Horizontal bars indicate median values.
Figure 3.
Figure 3.. Anti-SARS-CoV-2 RBD antibodies.
a. Representative flow cytometry plots showing dual AF647- and PE-RBD binding B cells in control and 6 study individuals (for gating strategy see Extended Data Fig. 6). Percentages of antigen specific B cells are indicated. Control is a healthy control sample obtained pre-COVID-19. b, Pie charts depicting the distribution of antibody sequences from 6 individuals. The number in the inner circle indicates the number of sequences analyzed for the individual denoted above the circle. White indicates sequences isolated only once, and grey or colored pie slices are proportional to the number of clonally related sequences. Red, blue, orange and yellow pie slices indicate clones that share the same IGHV and IGLV genes. c, Circos plot shows sequences from all 6 individuals with clonal relationships depicted as in b. Interconnecting lines indicate the relationship between antibodies that share V and J gene segment sequences at both IGH and IGL. Purple, green and gray lines connect related clones, clones and singles, and singles to each other, respectively. d, Sample sequence alignment for antibodies originating from different individuals that display highly similar IGH V(D)J and IGL VJ sequences including CDR3s. Amino acid differences in CDR3s to the bolded reference sequence above are indicated in red and dots represent identities.
Figure 4.
Figure 4.. Anti-SARS-CoV-2 RBD antibody reactivity.
a, Graph show results of ELISA assays measuring monoclonal antibody reactivity to RBD. Optical density units at 450 nm (OD, Y axis) vs. antibody concentrations (X axis). C121, C135 C144 and isotype control in red, green, purple, and black respectively, in all panels. b, Graph shows normalized relative luminescence values (RLU, Y axis) in cell lysates of 293TACE2 cells 48 hours after infection with SARS-CoV-2 pseudovirus in the presence of increasing concentrations of monoclonal antibodies (X axis). c, RLU for SARS-CoV-2 pseudovirus assay (Y axis) vs. titration of monoclonal antibodies C121, C135 and C144 in one of two independent experiments (see Extended Data Table 6). d, SARS-CoV-2 real virus neutralization assay. Infected cells (Y axis) vs. titration of monoclonal antibodies C121, C135 and C144 in two independent experiments. For a and b panels, isotype control antibody in black. e, IC50s for antibodies assayed in b and d. f, Diagrammatic representation of biolayer interferometry experiment. g, Graph shows binding of C144, C101, C121, C009, C135, and CR3022, to RBD. h-m, Secondary antibody binding to preformed IgG-RBD complexes (Ab1). The table displays the shift in nanometers after second antibody (Ab2) binding to the antigen in the presence of the first antibody (Ab1). Values are normalized by the subtraction of the autologous antibody control. o-q, Representative 2D-class averages and 3D reconstructed volumes for SARS-CoV-S 2P trimers complexed with C002, C119, and C121 Fabs. 2D-class averages with observable Fab density are boxed. r, Overlay of S-Fab complexes with fully-occupied C002 (blue), C121 (magenta) and C119 (orange) Fabs aligned on the RBD “up” conformational state. The SARS-CoV-2 S model with 1 “up” RBD state (PDB 6VYB) was fit into the density and the SARS-CoV antibody S230 (PDB 6NB6) shown as reference (green ribbon).

References

    1. Graham R. L., Donaldson E. F. & Baric R. S. A decade after SARS: strategies for controlling emerging coronaviruses. Nat Rev Microbiol 11, 836–848, doi:10.1038/nrmicro3143 (2013). - DOI - PMC - PubMed
    1. Gralinski L. E. & Baric R. S. Molecular pathology of emerging coronavirus infections. J Pathol 235, 185–195, doi:10.1002/path.4454 (2015). - DOI - PMC - PubMed
    1. Hoffmann M. et al. SARS-CoV-2 Cell Entry Depends on ACE2 and TMPRSS2 and Is Blocked by a Clinically Proven Protease Inhibitor. Cell 181, 271–280 e278, doi:10.1016/j.cell.2020.02.052 (2020). - DOI - PMC - PubMed
    1. Walls A. C. et al. Structure, Function, and Antigenicity of the SARS-CoV-2 Spike Glycoprotein. Cell 181, 281–292 e286, doi:10.1016/j.cell.2020.02.058 (2020). - DOI - PMC - PubMed
    1. Jiang S., Hillyer C. & Du L. Neutralizing Antibodies against SARS-CoV-2 and Other Human Coronaviruses. Trends Immunol, doi:10.1016/j.it.2020.03.007 (2020). - DOI - PMC - PubMed

Publication types