This is a preprint.
The effect of travel restrictions on the spread of the 2019 novel coronavirus (2019-nCoV) outbreak
- PMID: 32511423
- PMCID: PMC7216908
- DOI: 10.1101/2020.02.09.20021261
The effect of travel restrictions on the spread of the 2019 novel coronavirus (2019-nCoV) outbreak
Update in
-
The effect of travel restrictions on the spread of the 2019 novel coronavirus (COVID-19) outbreak.Science. 2020 Apr 24;368(6489):395-400. doi: 10.1126/science.aba9757. Epub 2020 Mar 6. Science. 2020. PMID: 32144116 Free PMC article.
Abstract
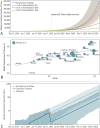
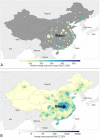
Motivated by the rapid spread of a novel coronavirus (2019-nCoV) in Mainland China, we use a global metapopulation disease transmission model to project the impact of both domestic and international travel limitations on the national and international spread of the epidemic. The model is calibrated on the evidence of internationally imported cases before the implementation of the travel quarantine of Wuhan. By assuming a generation time of 7.5 days, the reproduction number is estimated to be 2.4 [90% CI 2.2-2.6]. The median estimate for number of cases before the travel ban implementation on January 23, 2020 is 58,956 [90% CI 40,759 - 87,471] in Wuhan and 3,491 [90% CI 1,924 - 7,360] in other locations in Mainland China. The model shows that as of January 23, most Chinese cities had already received a considerable number of infected cases, and the travel quarantine delays the overall epidemic progression by only 3 to 5 days. The travel quarantine has a more marked effect at the international scale, where we estimate the number of case importations to be reduced by 80% until the end of February. Modeling results also indicate that sustained 90% travel restrictions to and from Mainland China only modestly affect the epidemic trajectory unless combined with a 50% or higher reduction of transmission in the community.
Figures


References
-
- World Health Organization, Novel Coronavirus – China, https://www.who.int/csr/don/12-january-2020-novel-coronavirus-china/en/ (2020). [Online; accessed 17-January-2020].
-
- The Center for Systems Science and Engineering, Wuhan coronavirus Global Cases, https://gisanddata.maps.arcgis.com/apps/opsdashboard/index.html#/bda7594... (2020). [Online; accessed 31-January-2020].
-
- World Health Organization, Novel Coronavirus – China, https://www.who.int/docs/default-source/coronaviruse/situation-reports/2... (2020). [Online; accessed 04-February-2020].
Publication types
Grants and funding
LinkOut - more resources
Full Text Sources
