

This is a preprint.
It has not yet been peer reviewed by a journal.
The National Library of Medicine is
running a pilot
to include preprints that result from research funded by NIH in PMC and PubMed.
[Preprint]. 2020 Mar 13:2020.03.09.20033217.
doi: 10.1101/2020.03.09.20033217.
Aerosol and surface stability of HCoV-19 (SARS-CoV-2) compared to SARS-CoV-1
Affiliations
- PMID: 32511427
- PMCID: PMC7217062
- DOI: 10.1101/2020.03.09.20033217
Item in Clipboard
Aerosol and surface stability of HCoV-19 (SARS-CoV-2) compared to SARS-CoV-1
medRxiv.
.
Update in
-
Aerosol and Surface Stability of SARS-CoV-2 as Compared with SARS-CoV-1.N Engl J Med. 2020 Apr 16;382(16):1564-1567. doi: 10.1056/NEJMc2004973. Epub 2020 Mar 17. N Engl J Med. 2020. PMID: 32182409 Free PMC article. No abstract available.
No abstract available
Figures
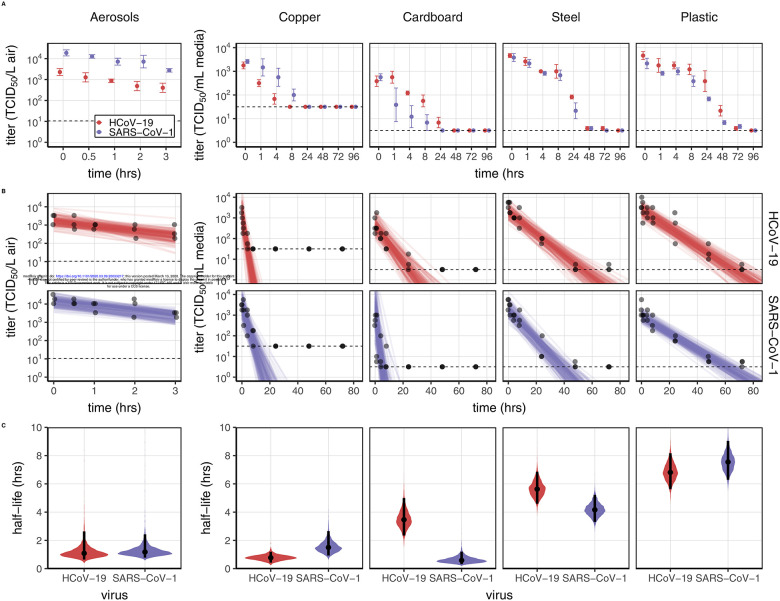
Viability of SARS-CoV-1 and HCoV-19 in aerosols and on different surfaces. A) SARS-CoV and HCoV-19 were aerosolized in a rotating drum maintained at 21–23°C and 65% RH over three hours. Viable virus titer is shown in TCID50/L air. For surfaces, viruses were applied on copper, cardboard, steel and plastic maintained at 21–23°C and 40% RH over seven days. Viable virus titer is shown in TCID50/mL collection medium. All samples were quantified by end-point titration on Vero E6 cells. Plots show the mean and standard error across three replicates. B) Regression plots showing predicted decay of virus titer over time; titer plotted on a logarithmic scale. Points show measured titers and are slightly jittered along the time axis to avoid overplotting. Lines are random draws from the joint posterior distribution of the exponential decay rate (negative of the slope) and intercept (initial virus titer), thus visualizing the range of possible decay patterns for each experimental condition. 150 lines per panel: 50 lines from each plotted replicate. C) Violin plots showing posterior distribution for half-life of viable virus based on the estimated exponential decay rates of virus titer. Dot shows the posterior median estimate and black line shows a 95% credible interval. Experimental conditions are ordered by posterior median half-life for HCoV-19. Dotted line shows Limit of Detection (LOD), 3.33 × 100.5 TCID50/L air for aerosols, 100.5 TCID50/mL media for plastic, steel and cardboard and 101.5 TCID50/mL media for copper.
References
-
- Coronavirus disease (COVID-2019) situation reports. 2020. (Accessed 26th of February 2020, at https://www.who.int/emergencies/diseases/novel-coronavirus-2019/situatio....)
Publication types
LinkOut - more resources
Full Text Sources
Other Literature Sources
Miscellaneous