

This is a preprint.
Age profile of susceptibility, mixing, and social distancing shape the dynamics of the novel coronavirus disease 2019 outbreak in China
- PMID: 32511428
- PMCID: PMC7217069
- DOI: 10.1101/2020.03.19.20039107
Age profile of susceptibility, mixing, and social distancing shape the dynamics of the novel coronavirus disease 2019 outbreak in China
Abstract
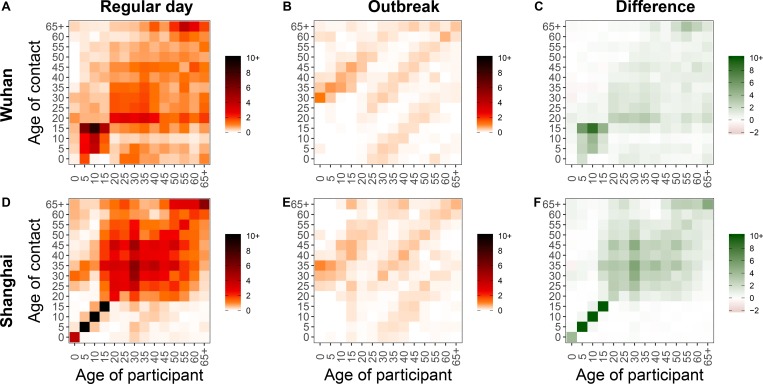
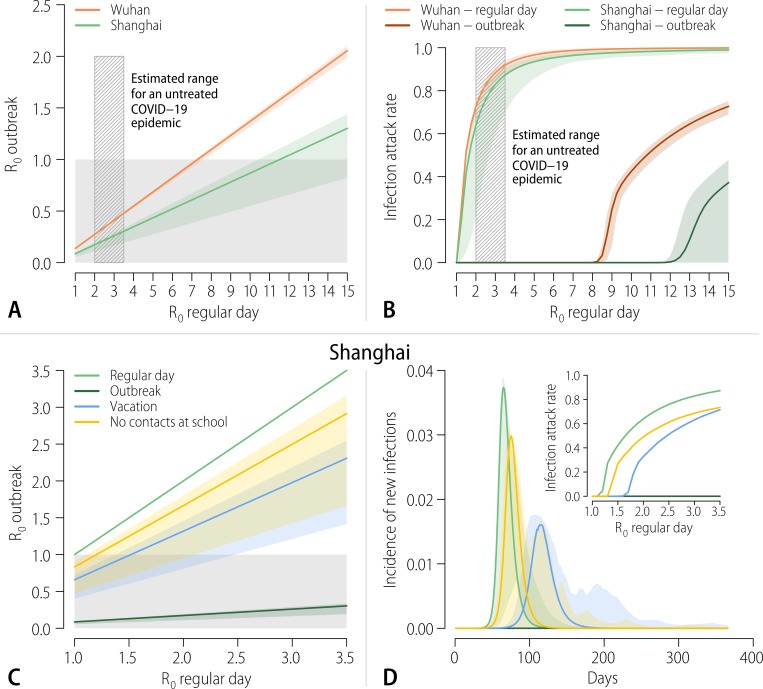
Strict interventions were successful to control the novel coronavirus (COVID-19) outbreak in China. As transmission intensifies in other countries, the interplay between age, contact patterns, social distancing, susceptibility to infection and disease, and COVID-19 dynamics remains unclear. To answer these questions, we analyze contact surveys data for Wuhan and Shanghai before and during the outbreak and contact tracing information from Hunan Province. Daily contacts were reduced 7-9 fold during the COVID-19 social distancing period, with most interactions restricted to the household. Children 0-14 years were 59% (95% CI 7-82%) less susceptible than individuals 65 years and over. A transmission model calibrated against these data indicates that social distancing alone, as implemented in China during the outbreak, is sufficient to control COVID-19. While proactive school closures cannot interrupt transmission on their own, they reduce peak incidence by half and delay the epidemic. These findings can help guide global intervention policies.
Figures
Similar articles
-
Changes in contact patterns shape the dynamics of the COVID-19 outbreak in China.Science. 2020 Jun 26;368(6498):1481-1486. doi: 10.1126/science.abb8001. Epub 2020 Apr 29. Science. 2020. PMID: 32350060 Free PMC article.
-
Effect of Non-lockdown Social Distancing and Testing-Contact Tracing During a COVID-19 Outbreak in Daegu, South Korea, February to April 2020: A Modeling Study.Int J Infect Dis. 2021 Sep;110:213-221. doi: 10.1016/j.ijid.2021.07.058. Epub 2021 Jul 29. Int J Infect Dis. 2021. PMID: 34333119 Free PMC article.
-
What are the underlying transmission patterns of COVID-19 outbreak? An age-specific social contact characterization.EClinicalMedicine. 2020 Apr 18;22:100354. doi: 10.1016/j.eclinm.2020.100354. eCollection 2020 May. EClinicalMedicine. 2020. PMID: 32313879 Free PMC article.
-
Quarantine alone or in combination with other public health measures to control COVID-19: a rapid review.Cochrane Database Syst Rev. 2020 Sep 15;9(9):CD013574. doi: 10.1002/14651858.CD013574.pub2. Cochrane Database Syst Rev. 2020. PMID: 33959956 Free PMC article.
-
Social distancing policies in 22 African countries during the COVID-19 pandemic: a desk review.Pan Afr Med J. 2020 Dec 14;37(Suppl 1):46. doi: 10.11604/pamj.supp.2020.37.46.27026. eCollection 2020. Pan Afr Med J. 2020. PMID: 33552374 Free PMC article. Review.
Cited by
-
Risk assessment and evaluation of China's policy to prevent COVID-19 cases imported by plane.PLoS Negl Trop Dis. 2020 Dec 7;14(12):e0008908. doi: 10.1371/journal.pntd.0008908. eCollection 2020 Dec. PLoS Negl Trop Dis. 2020. PMID: 33284804 Free PMC article.
-
Risk and Protective Factors in the COVID-19 Pandemic: A Rapid Evidence Map.Front Public Health. 2020 Nov 24;8:582205. doi: 10.3389/fpubh.2020.582205. eCollection 2020. Front Public Health. 2020. PMID: 33330323 Free PMC article.
References
-
- World Health Organization, Coronavirus disease 2019 (COVID-19) Situation, https://www.who.int/docs/default-source/coronaviruse/situation-reports/2... (18 March 2020).
-
- Zhang J. et al., medRxiv: 2020.02.21.20026328 (2020).
Publication types
LinkOut - more resources
Full Text Sources
Research Materials