[Preprint]. 2020 Apr 18:2020.04.13.20063784.
doi: 10.1101/2020.04.13.20063784.

Comparative dynamic aerosol efficiencies of three emergent coronaviruses and the unusual persistence of SARS-CoV-2 in aerosol suspensions

Affiliations

Comparative dynamic aerosol efficiencies of three emergent coronaviruses and the unusual persistence of SARS-CoV-2 in aerosol suspensions

A C Fears et al. medRxiv. .

Update in

  • Persistence of Severe Acute Respiratory Syndrome Coronavirus 2 in Aerosol Suspensions.
    Fears AC, Klimstra WB, Duprex P, Hartman A, Weaver SC, Plante KS, Mirchandani D, Plante JA, Aguilar PV, Fernández D, Nalca A, Totura A, Dyer D, Kearney B, Lackemeyer M, Bohannon JK, Johnson R, Garry RF, Reed DS, Roy CJ. Fears AC, et al. Emerg Infect Dis. 2020 Sep;26(9):2168-71. doi: 10.3201/eid2609.201806. Epub 2020 Jun 22. Emerg Infect Dis. 2020. PMID: 32568661 Free PMC article.
No abstract available


Figures

Figure 1.
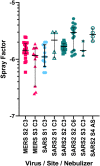
Figure 1.. Aerosol efficiency of MERS-CoV, SARS-CoV and SARS-CoV-2 at different sites.
Graph shows the spray factor (Fs; the ratio of the nebulizer concentration to the aerosol concentration) for MERS-CoV (red symbols), SARS-CoV (blue symbols), and SARS-CoV-2 (green symbols). Aerosols were performed at four different sites (S1 = Tulane; S2 = NIH-IRF; S3 = USAMRIID S4 = Pittsburgh) and with different nebulizers (C3 = Collison 3-jet; C6 = Collison 6-jet; AS = Aerogen Solo).
Figure 2.
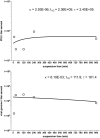
Figure 2.. Decay curves of SARS-CoV-2 in aerosol suspension.
A. Aerosol concentration of infectious SARS-CoV-2 as measured by plaque assay found in impinger samples collected at five differing timepoints of increased aging in aerosol suspension, B. Corresponding aerosol concentration of SARS-CoV-2 in time-matched impinger samples as a function of viral genome copies as measured by qPCR. Both timepoint virus estimates were graphed and nonlinear least-squares regression analysis single-order decay with no outlier detection was performed, resulting in a poor curve fit by either method of viral quantitation resulting from number and lack of iterative samples in this analysis.
Figure 3.
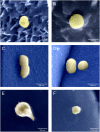
Figure 3.. Electron microscopy images of SARS-CoV-2 in aerosol suspension at various timepoints.
A, B: from viral stock prior to aerosolization; C, D: from 10 minute aerosol suspension; E, F: from 16 hour aerosol suspension.

References

    1. Zheng J. SARS-CoV-2: an Emerging Coronavirus that Causes a Global Threat. Int J Biol Sci 2020;16:1678–85. - PMC - PubMed
    1. Harcourt J, Tamin A, Lu X, et al. Severe Acute Respiratory Syndrome Coronavirus 2 from Patient with 2019 Novel Coronavirus Disease, United States. Emerg Infect Dis 2020;26. - PMC - PubMed
    1. Roy CJ, Reed DS. Infectious disease aerobiology: miasma incarnate. Front Cell Infect Microbiol 2012;2:163. - PMC - PubMed
    1. O’Malley KJ, Bowling JD, Barry EM, Hazlett KRO, Reed DS. Development, Characterization, and Standardization of a Nose-Only Inhalation Exposure System for Exposure of Rabbits to Small-Particle Aerosols Containing Francisella tularensis. Infect Immun 2019;87. - PMC - PubMed
    1. Goldberg LJ, Watkins HM, Boerke EE, Chatigny MA. The use of a rotating drum for the study of aerosols over extended periods of time. Am J Hyg 1958;68:85–93. - PubMed

Publication types

LinkOut - more resources