[Preprint]. 2020 Apr 17:2020.04.14.20065771.
doi: 10.1101/2020.04.14.20065771.

A systematic review of antibody mediated immunity to coronaviruses: antibody kinetics, correlates of protection, and association of antibody responses with severity of disease

Affiliations

A systematic review of antibody mediated immunity to coronaviruses: antibody kinetics, correlates of protection, and association of antibody responses with severity of disease

Angkana T Huang et al. medRxiv. .

Update in

Abstract

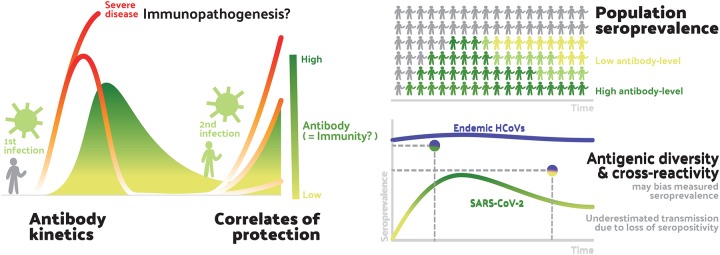
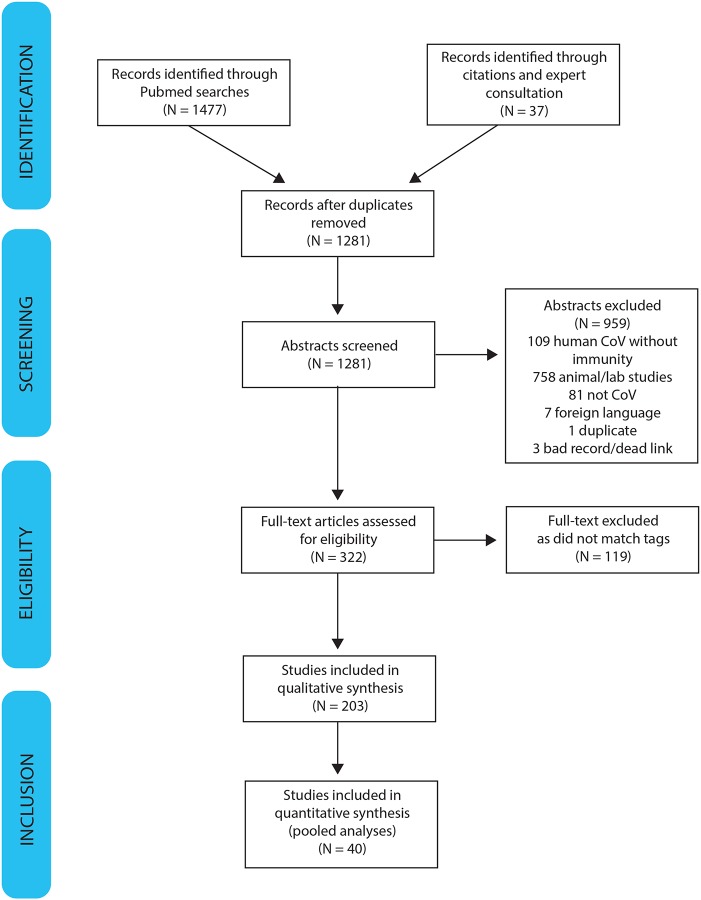
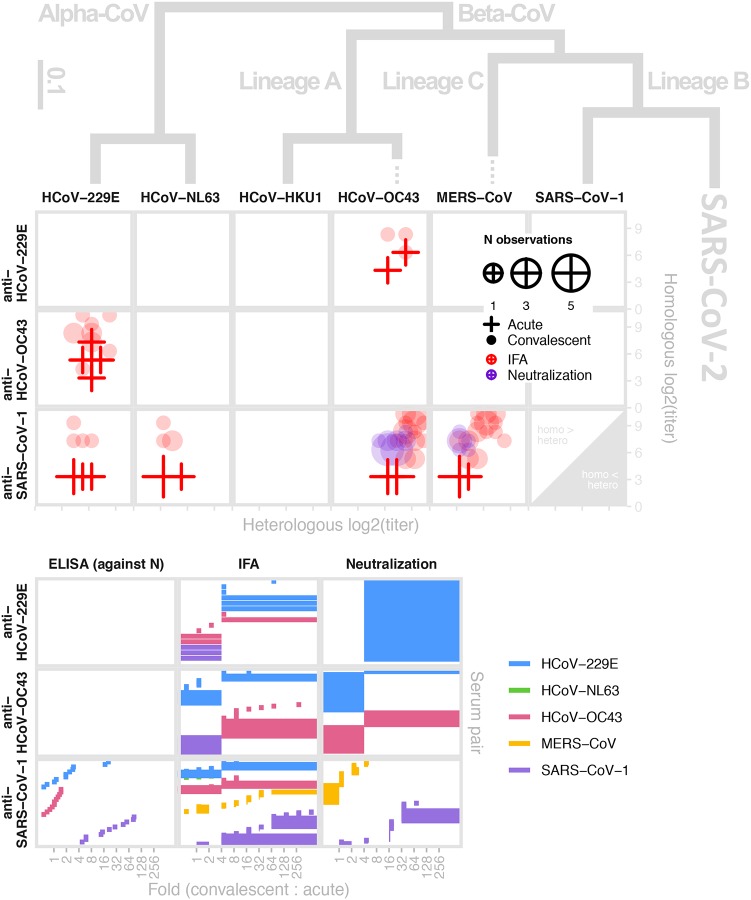
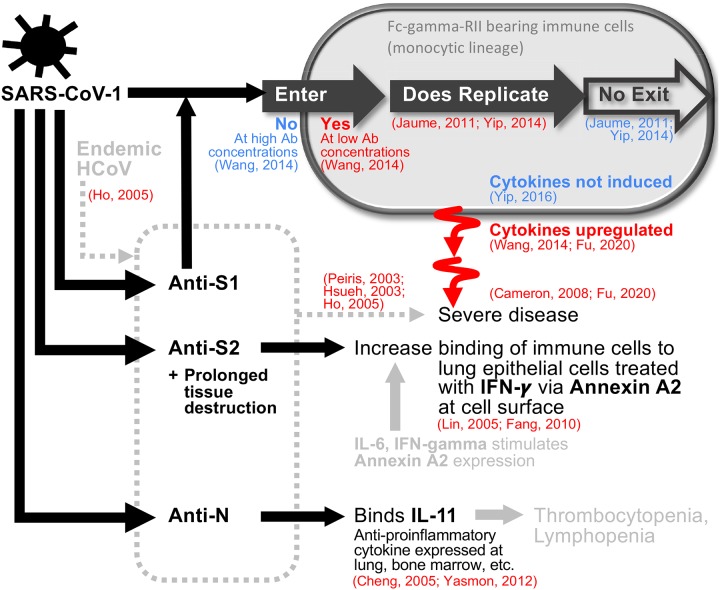
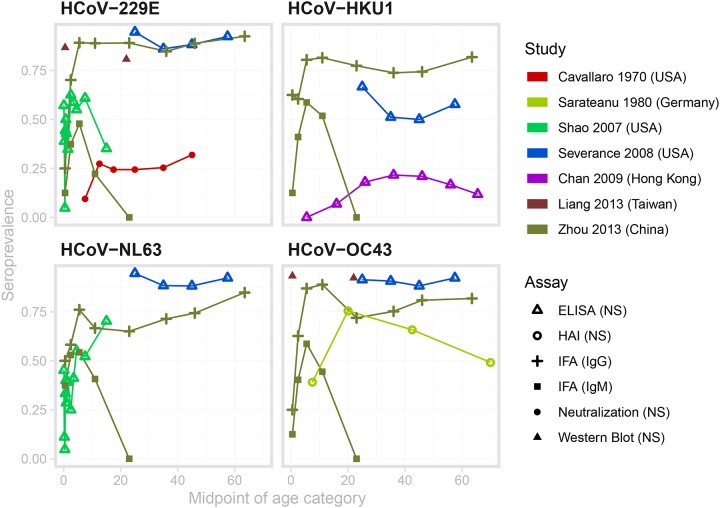
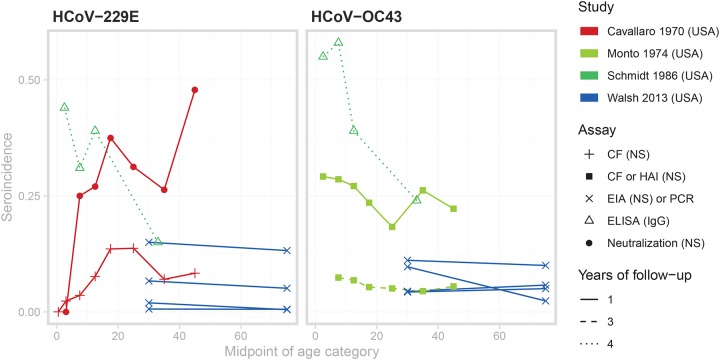
The duration and nature of immunity generated in response to SARS-CoV-2 infection is unknown. Many public health responses and modeled scenarios for COVID-19 outbreaks caused by SARSCoV-2 assume that infection results in an immune response that protects individuals from future infections or illness for some amount of time. The timescale of protection is a critical determinant of the future impact of the pathogen. The presence or absence of protective immunity due to infection or vaccination (when available) will affect future transmission and illness severity. The dynamics of immunity and nature of protection are relevant to discussions surrounding therapeutic use of convalescent sera as well as efforts to identify individuals with protective immunity. Here, we review the scientific literature on antibody immunity to coronaviruses, including SARS-CoV-2 as well as the related SARS-CoV-1, MERS-CoV and human endemic coronaviruses (HCoVs). We reviewed 1281 abstracts and identified 322 manuscripts relevant to 5 areas of focus: 1) antibody kinetics, 2) correlates of protection, 3) immunopathogenesis, 4) antigenic diversity and cross-reactivity, and 5) population seroprevalence. While studies of SARS-CoV-2 are necessary to determine immune responses to it, evidence from other coronaviruses can provide clues and guide future research.


Figures

Figure 1:
Figure 1:. Aspects of antibody response included in this review.
This figure shows the areas of focus of our review within our conceptualisation of the stages of exposure and infection at which we believe antibody mediated immunity may play a role in the dynamics of SARS-CoV-2. At the individual level (left), antibody response following the first infection/exposure increases and then declines (Antibody kinetics). Sometime later individuals may be exposed to SARS-CoV-2 again. They may be protected from infection by their acquired immunity (Correlates of protection). Their acquired immunity may also moderate the severity of infection with some possibility that pre-existing immunity may lead to immunopathogenesis (relevant to both first and second exposure). These individual-level dynamics aggregate to form the population-level seroprevalence (right-top). Measures of seroprevalence may imperfectly measure past exposure to infection due to antigenic diversity of future SARS-CoV-2 viruses and cross-reactivity of endemic human coronaviruses (HCoVs) with SARS-CoV-2. Measures of seroprevalence may also be inconsistent across times as antibodies-levels within individuals wane. Aspects of antibody response included in this review.
Figure 2:
Figure 2:
PRISMA diagram of systematic review process PRISMA Diagram of Systematic Review.
Figure 3:
Figure 3:. Distributions of times from symptom onset to detection of antibodies against MERS, SARS-CoV-1 and SARS-CoV-2.
Times between symptom onset and the detection of IgG (top row), IgM (middle row) and neutralizing antibodies (bottom row). Black vertical lines indicate the median values across all severity ratings, while dashed coloured lines are the median values for mild (blue), severe (orange) illnesses as well as illnesses of unreported severity (grey). Data were digitized from 12 studies,,,,,,,,–. Distributions of times from symptom onset to detection of antibodies against MERS, SARS-CoV-1 and SARS-CoV-2.
Figure 4:
Figure 4:. MERS-CoV antibody kinetics.
The left panel shows data for studies reporting IgG concentration in units of optical density, while the right panel shows data for studies reporting neutralizing antibodies in units of titers. The plotting symbols indicate whether a measurement was above the cutoff for the assay being used, if reported in the study. Some studies reported titers that were lower than or greater than some threshold value; those are here plotted at those values (e.g., for ≥ 320, the value is assumed to be 320). Some studies may report kinetics of different antibodies or using different assays (and different units) for the same patient. Note that while these are plotted on the same axes, values may not necessarily be comparable across studies within each panel, as each lab may have different assay conditions resulting in different scales. See Figures S2 and S3 for (more limited) data on SARS-CoV-1 and IgA. MERS-CoV antibody kinetics.
Figure 5:
Figure 5:. Antigenic and phylogenetic relationships among human coronaviruses.
(Top) Reactivity of antiserum (x-axis) taken from individuals with confirmed infections of each human coronavirus against a panel of human coronaviruses (columns) shown in relation to their phylogeny as measured by IFA (red) and neutralization (purple); convalescent (circles) and acute sera (crosses); size of plot characters denotes the number of observations. The y-axis provides titers to the homologous strain the sera (rows) for comparison. (Bottom) Bracket of reported convalescent-to-acute titer fold-rise upon infection. Data extracted from 7 studies,,,,,,. Phylogeny modified from. Antigenic and phylogenetic relationships among HCoVs.
Figure 6:
Figure 6:. A diagrammatic summary of evidence supporting (red) and contradicting (blue) the contributions of antibodies to the pathogenesis of SARS-CoV-1.
Anti-S1 antibodies triggered upon infection may facilitate entry into immune cells at later stages of the infection if concentration is low. Replication happens but no virus is released. Consequential induction of cytokines are inconclusive, but if they occur, they are associated with severe disease. Roles of anti-S2 and anti-N antibodies are supported by binding observations. Items shown in grey are weaker evidence given as speculations in the literature. A diagrammatic summary of evidence supporting (red) and contradicting (blue) the contributions of antibodies to pathogenesis.
Figure 7:
Figure 7:. Age-seroprevalence curves for the studies with appropriate, digitizable data on endemic HCoV.
The color denotes the study, and the point type denotes the assay and antibody measured. Data from Sarateanu et al is averaged over two serosurveys conducted in 1975 and 1976. Data from Liang et al. were measured in cord blood samples and adults aged 18–25, and do not represent the change in seroprevalence across childhood. Therefore we have not connected these two points with a line. Age-seroprevalence curves for the studies with appropriate, digitizable data on endemic HCoV.
Figure 8:
Figure 8:. Age-incidence curves for studies with appropriate, digitizable data on endemic HCoV.
The color denotes the study, the point type denotes the assay and antibody measured, and the line type represents the number of years between successive serosample Age-incidence curves for studies with appropriate, digitizable data on endemic HCoV.
Figure 9:
Figure 9:. Seroprevalence (shaded area, scale indicated by right y-axis) and seroincidence (lines, scale indicated by left y-axis) curves by age for a single strain for four hypothetical models of coronavirus immunity:
complete homologous immunity (Model 1), complete homologous immunity for 5 years, then reversion to full susceptibility (Model 2), partial homologous immunity for life after the first infection (Model 3), and 4 genotypes within a strain, conferring lifelong genotypespecific immunity but no within-strain cross-immunity (Model 4). Seroprevalence (shaded area, scale indicated by right y-axis) and seroincidence (lines, scale indicated by left y-axis) curves by age for a single strain for four hypothetical models of coronavirus immunity.

References

    1. Chinazzi M. et al. The effect of travel restrictions on the spread of the 2019 novel coronavirus (COVID-19) outbreak. Science (2020) doi:10.1126/science.aba9757 - DOI - PMC - PubMed
    1. Read J. M., Bridgen J. R. E., Cummings D. A. T., Ho A. & Jewell C. P. Novel coronavirus 2019-nCoV: early estimation of epidemiological parameters and epidemic predictions. doi:10.1101/2020.01.23.20018549 - DOI - PMC - PubMed
    1. Kucharski A. J. et al. Early dynamics of transmission and control of COVID-19: a mathematical modelling study. Lancet Infect. Dis. (2020) doi:10.1016/S1473-3099(20)30144-4 - DOI - PMC - PubMed
    1. Casadevall A. & Pirofski L.-A. The convalescent sera option for containing COVID-19. J. Clin. Invest. 130, 1545–1548 (2020). - PMC - PubMed
    1. Godlee F. The burning building. BMJ m1101 (2020) doi:10.1136/bmj.m1101 - DOI

Publication types