

This is a preprint.
Comparative Impact of Individual Quarantine vs. Active Monitoring of Contacts for the Mitigation of COVID-19: a modelling study
- PMID: 32511440
- PMCID: PMC7239061
- DOI: 10.1101/2020.03.05.20031088
Comparative Impact of Individual Quarantine vs. Active Monitoring of Contacts for the Mitigation of COVID-19: a modelling study
Update in
-
Individual quarantine versus active monitoring of contacts for the mitigation of COVID-19: a modelling study.Lancet Infect Dis. 2020 Sep;20(9):1025-1033. doi: 10.1016/S1473-3099(20)30361-3. Epub 2020 May 20. Lancet Infect Dis. 2020. PMID: 32445710 Free PMC article.
Abstract
Background: Voluntary individual quarantine and voluntary active monitoring of contacts are core disease control strategies for emerging infectious diseases, such as COVID-19. Given the impact of quarantine on resources and individual liberty, it is vital to assess under what conditions individual quarantine can more effectively control COVID-19 than active monitoring. As an epidemic grows, it is also important to consider when these interventions are no longer feasible, and broader mitigation measures must be implemented.
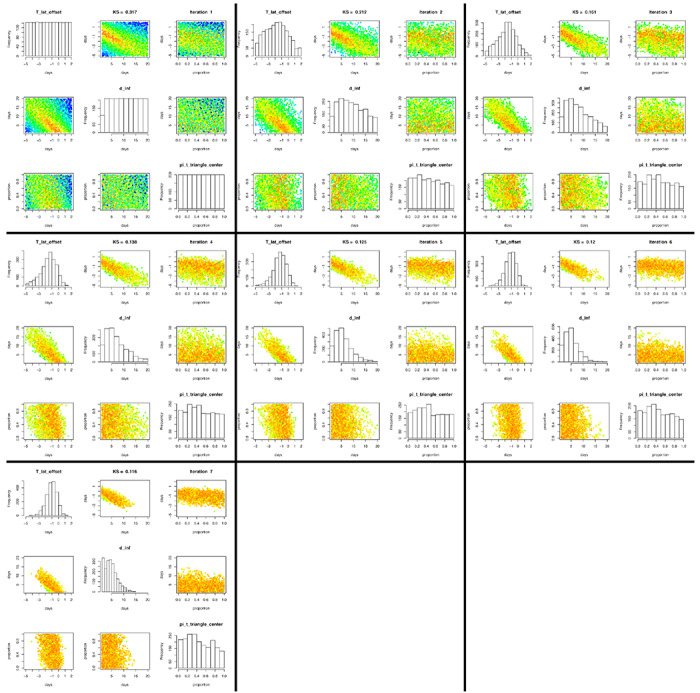
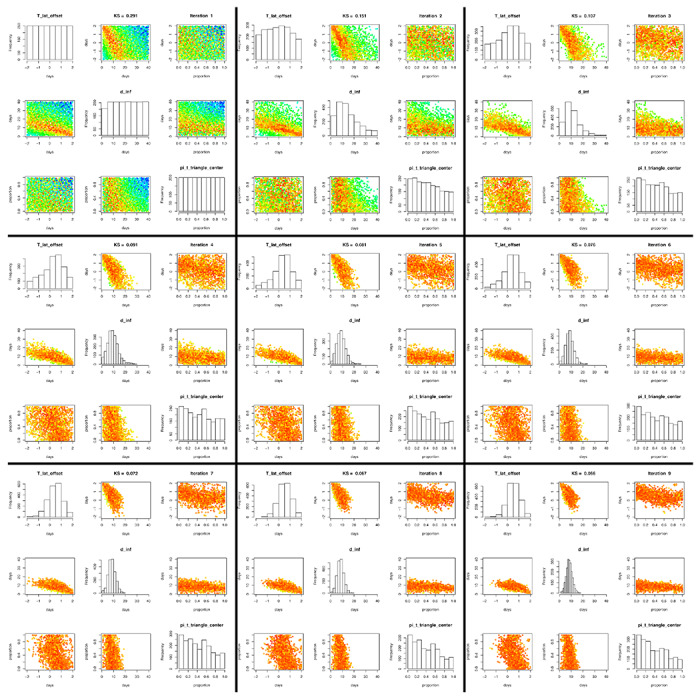
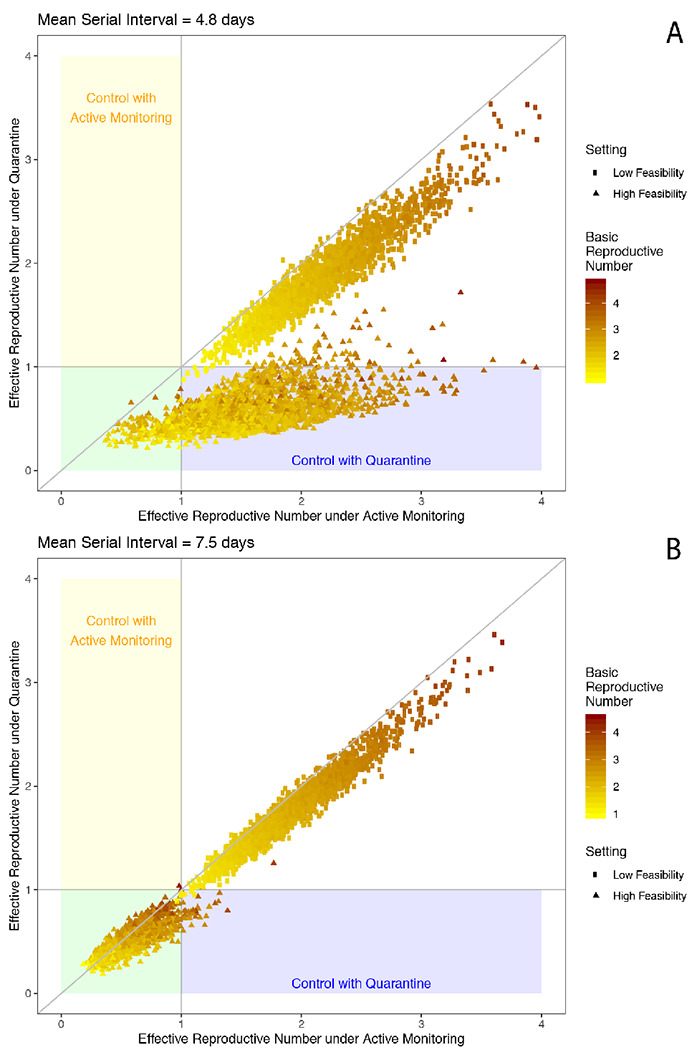
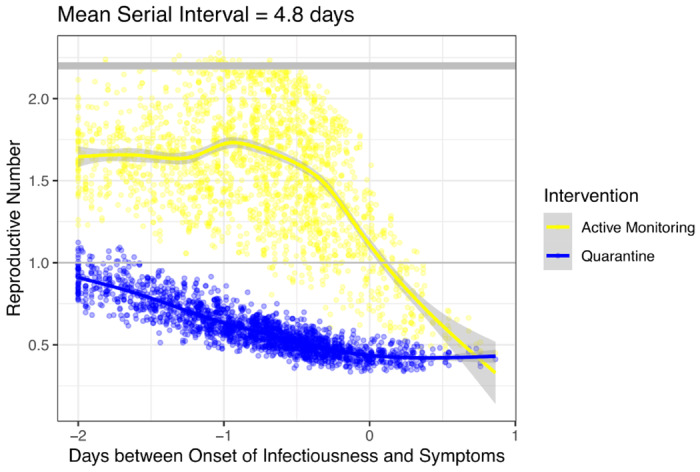
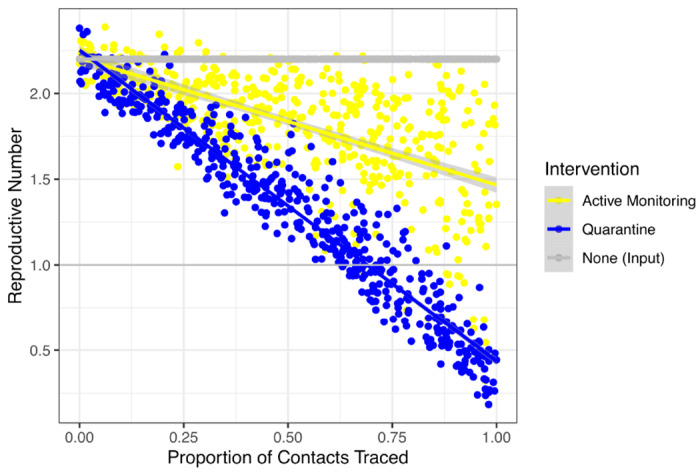
Methods: To estimate the comparative efficacy of these case-based interventions to control COVID-19, we fit a stochastic branching model to reported parameters for the dynamics of the disease. Specifically, we fit to the incubation period distribution and each of two sets of the serial interval distribution: a shorter one with a mean serial interval of 4.8 days and a longer one with a mean of 7.5 days. To assess variable resource settings, we consider two feasibility settings: a high feasibility setting with 90% of contacts traced, a half-day average delay in tracing and symptom recognition, and 90% effective isolation; and low feasibility setting with 50% of contacts traced, a two-day average delay, and 50% effective isolation.
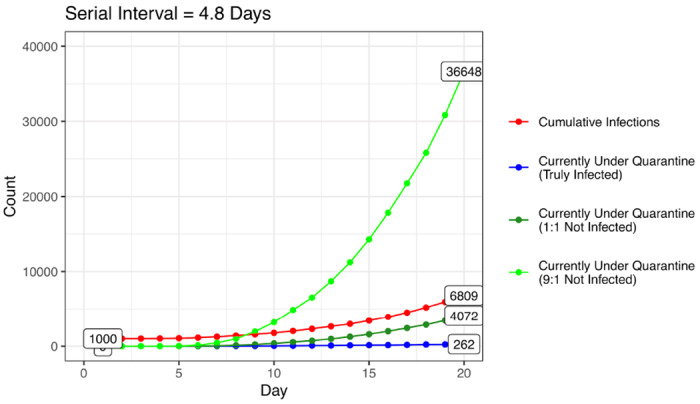
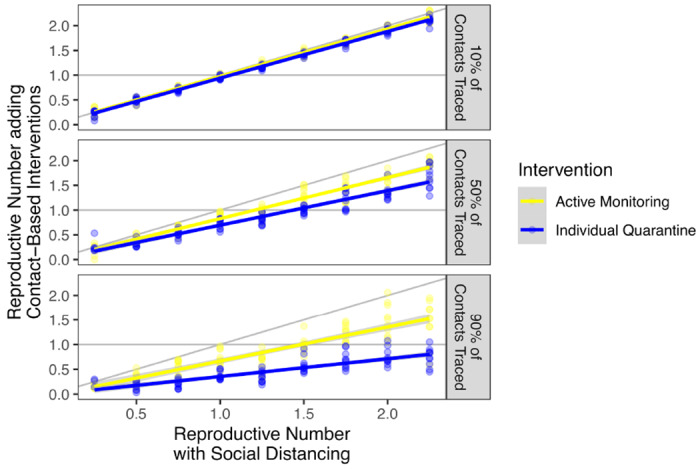
Findings: Our results suggest that individual quarantine in high feasibility settings where at least three-quarters of infected contacts are individually quarantined contains an outbreak of COVID-19 with a short serial interval (4.8 days) 84% of the time. However, in settings where this performance is unrealistically high and the outbreak continues to grow, so too will the burden of the number of contacts traced for active monitoring or quarantine. When resources are prioritized for scalable interventions such as social distancing, we show active monitoring or individual quarantine of high-risk contacts can contribute synergistically to mitigation efforts.
Interpretation: Our model highlights the urgent need for more data on the serial interval and the extent of presymptomatic transmission in order to make data-driven policy decisions regarding the cost-benefit comparisons of individual quarantine vs. active monitoring of contacts. To the extent these interventions can be implemented they can help mitigate the spread of COVID-19.
Keywords: coronavirus; disease control; emerging infectious disease; isolation; nonpharmaceutical interventions; outbreak; symptom monitoring.
Conflict of interest statement
Declaration of interests We declare no competing interests.
Figures
References
-
- World Health Organization. Coronavirus. https://www.who.int/emergencies/diseases/novel-coronavirus-2019 (accessed Feb 4, 2020).
-
- Johns Hopkins Center for Systems Science and Engineering. Coronavirus 2019-nCoV Global Cases. https://gisanddata.maps.arcgis.com/apps/opsdashboard/index.html#/bda7594... (accessed March 25, 2020).
-
- CDC. Interim US Guidance for Risk Assessment and Public Health Management of Persons with Potential 2019 Novel Coronavirus (2019-nCoV) Exposure in Travel-associated or Community Settings. Centers for Disease Control and Prevention; 2020; published online Feb 5 https://www.cdc.gov/coronavirus/2019-ncov/php/risk-assessment.html (accessed Feb 4, 2020).
-
- Qin A, Myers SL, Yu E. China Tightens Wuhan Lockdown in ‘Wartime’ Battle With Coronavirus. 2020; published online Feb 6 https://www.nytimes.com/2020/02/06/world/asia/coronavirus-china-wuhan-qu... (accessed Feb 12, 2020).
Publication types
Grants and funding
LinkOut - more resources
Full Text Sources
Research Materials