

This is a preprint.
Urban Air Pollution May Enhance COVID-19 Case-Fatality and Mortality Rates in the United States
- PMID: 32511493
- PMCID: PMC7273261
- DOI: 10.1101/2020.05.04.20090746
Urban Air Pollution May Enhance COVID-19 Case-Fatality and Mortality Rates in the United States
Update in
-
Urban Air Pollution May Enhance COVID-19 Case-Fatality and Mortality Rates in the United States.Innovation (Camb). 2020 Nov 25;1(3):100047. doi: 10.1016/j.xinn.2020.100047. Epub 2020 Sep 21. Innovation (Camb). 2020. PMID: 32984861 Free PMC article.
Abstract
Background: The novel human coronavirus disease 2019 (COVID-19) pandemic has claimed more than 240,000 lives worldwide, causing tremendous public health, social, and economic damages. While the risk factors of COVID-19 are still under investigation, environmental factors, such as urban air pollution, may play an important role in increasing population susceptibility to COVID-19 pathogenesis.
Methods: We conducted a cross-sectional nationwide study using zero-inflated negative binomial models to estimate the association between long-term (2010-2016) county-level exposures to NO2, PM2.5 and O3 and county-level COVID-19 case-fatality and mortality rates in the US. We used both single and multipollutant models and controlled for spatial trends and a comprehensive set of potential confounders, including state-level test positive rate, county-level healthcare capacity, phase-of-epidemic, population mobility, sociodemographic, socioeconomic status, behavior risk factors, and meteorological factors.
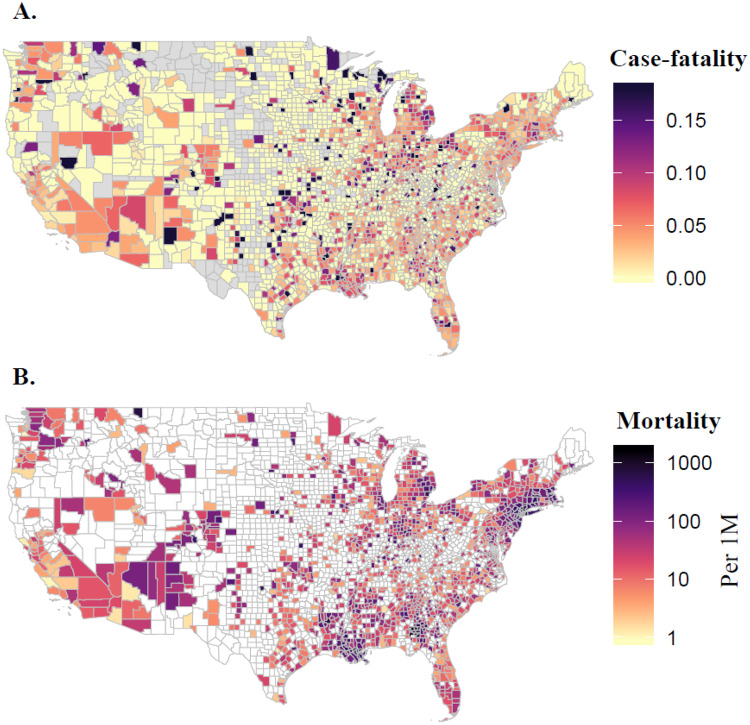
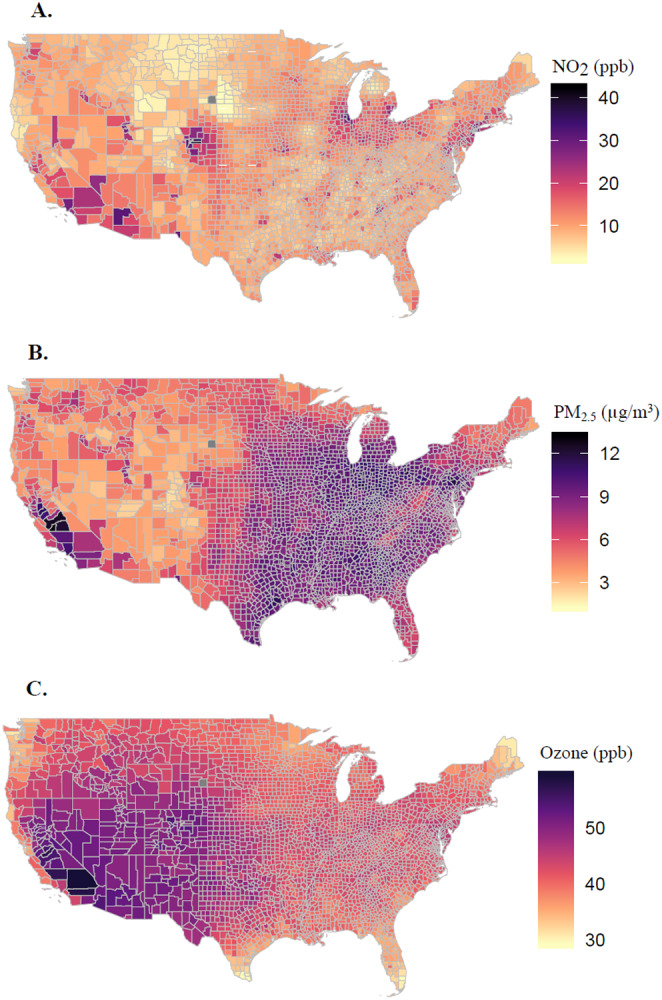
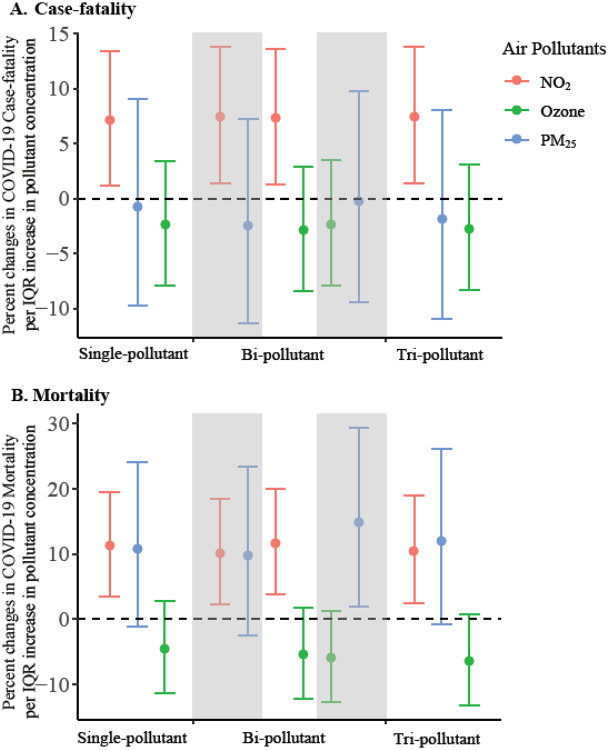
Results: 1,027,799 COVID-19 cases and 58,489 deaths were reported in 3,122 US counties from January 22, 2020 to April 29, 2020, with an overall observed case-fatality rate of 5.8%. Spatial variations were observed for both COVID-19 death outcomes and long-term ambient air pollutant levels. County-level average NO2 concentrations were positively associated with both COVID-19 case-fatality rate and mortality rate in single-, bi-, and tri-pollutant models (p-values<0.05). Per inter-quartile range (IQR) increase in NO2 (4.6 ppb), COVID-19 case-fatality rate and mortality rate were associated with an increase of 7.1% (95% CI 1.2% to 13.4%) and 11.2% (95% CI 3.4% to 19.5%), respectively. We did not observe significant associations between long-term exposures to PM2.5 or O3 and COVID-19 death outcomes (p-values>0.05), although per IQR increase in PM2.5 (3.4 ug/m3) was marginally associated with 10.8% (95% CI: -1.1% to 24.1%) increase in COVID-19 mortality rate.
Discussions and conclusions: Long-term exposure to NO2, which largely arises from urban combustion sources such as traffic, may enhance susceptibility to severe COVID-19 outcomes, independent of long-term PM2.5 and O3 exposure. The results support targeted public health actions to protect residents from COVID-19 in heavily polluted regions with historically high NO2 levels. Moreover, continuation of current efforts to lower traffic emissions and ambient air pollution levels may be an important component of reducing population-level risk of COVID-19 deaths.
Keywords: Air pollution; COVID-19; Case-fatality rate; Mortality; Nitrogen dioxide.
Conflict of interest statement
Potential Conflicts of Interest: The authors have no conflicts of interest relevant to this article to disclose
Figures
References
-
- Onder G, Rezza G, Brusaferro S. Case-fatality rate and characteristics of patients dying in relation to COVID-19 in Italy. Jama. 2020. - PubMed
-
- Johns Hopkins Coronavirus Resource Center; 2020. https://coronavirus.jhu.edu/map.html. Accessed April 29, 2020.
-
- COVID I, Murray CJ. Forecasting COVID-19 impact on hospital bed-days, ICU-days, ventilator-days and deaths by US state in the next 4 months. medRxiv. 2020.
Publication types
Grants and funding
LinkOut - more resources
Full Text Sources
Miscellaneous