

This is a preprint.
Excess Out-Of-Hospital Mortality and Declining Oxygen Saturation: The Sentinel Role of EMS Data in the COVID-19 Crisis in Tijuana, Mexico
- PMID: 32511518
- PMCID: PMC7273286
- DOI: 10.1101/2020.05.13.20098186
Excess Out-Of-Hospital Mortality and Declining Oxygen Saturation: The Sentinel Role of EMS Data in the COVID-19 Crisis in Tijuana, Mexico
Update in
-
Excess Out-of-Hospital Mortality and Declining Oxygen Saturation: The Sentinel Role of Emergency Medical Services Data in the COVID-19 Crisis in Tijuana, Mexico.Ann Emerg Med. 2020 Oct;76(4):413-426. doi: 10.1016/j.annemergmed.2020.07.035. Epub 2020 Jul 23. Ann Emerg Med. 2020. PMID: 33012377 Free PMC article.
Abstract
Objective: Emergency medical services (EMS) may serve as a key source of real-time data about the evolving health of COVID-19 affected populations, especially in low-and-middle-income countries (LMICs) with less rapid and reliable vital statistic registration systems. Although official COVID-19 statistics in Mexico report almost exclusively in-hospital mortality events, excess out-of-hospital mortality has been identified in other settings, including one EMS study in Italy that showed a 58% increase. EMS and hospital reports from several countries have suggested that silent hypoxemia--low oxygen saturation (SpO2) in the absence of dyspnea--is associated with COVID-19 outbreaks. It is unclear, however, how these phenomena can be generalized to LMICs. We assess how EMS data can be used in a sentinel capacity in Tijuana, a city on the Mexico-United States border with earlier exposure to COVID-19 than many LMIC settings.
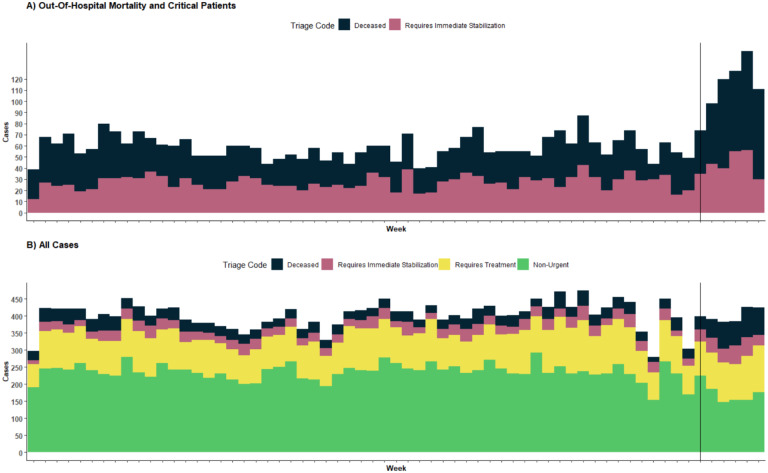
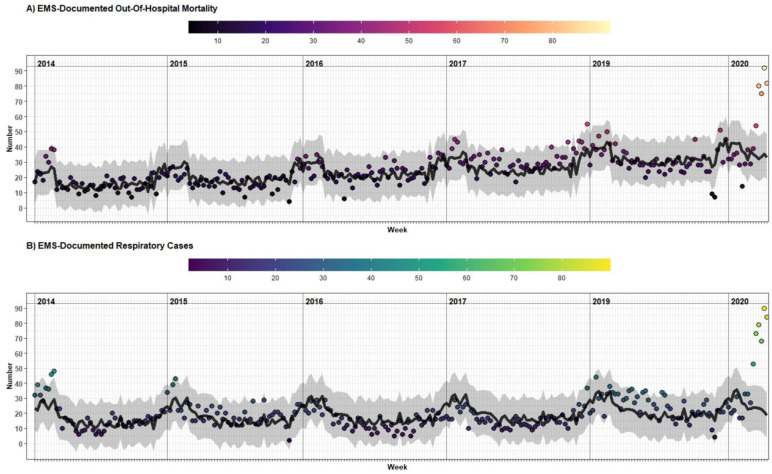
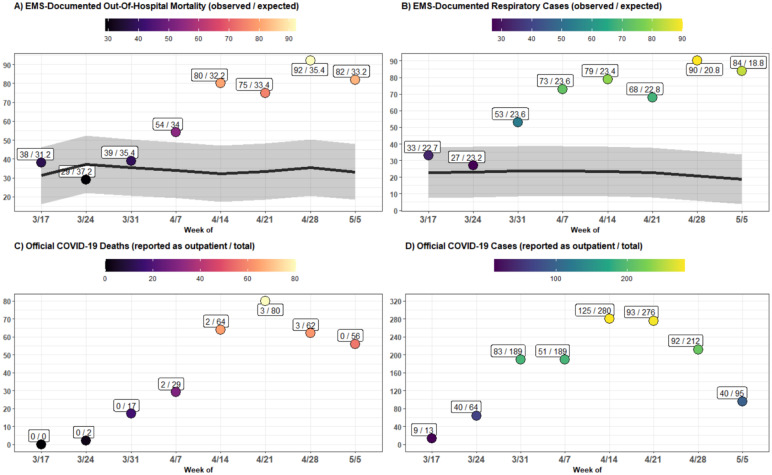
Methods: We calculated numbers of weekly out-of-hospital deaths and respiratory cases seen by EMS in Tijuana, and estimate the difference between peak-epidemic rates (during April 14th-May 11th) and forecasted 2014-2019 trends. Results were compared with official COVID-19 statistics, stratified by neighborhood socioeconomic status (SES), and examined for changing demographic or clinical features, including mean (SpO2).
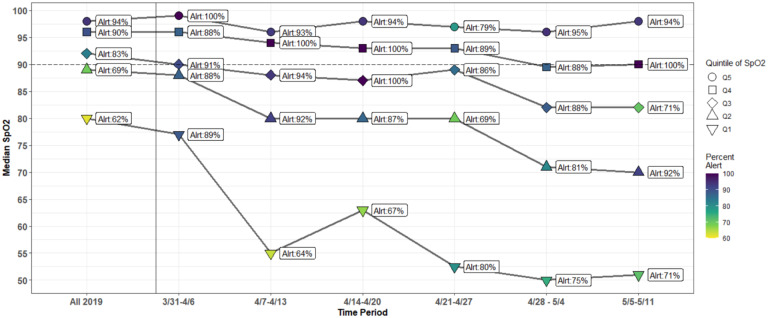
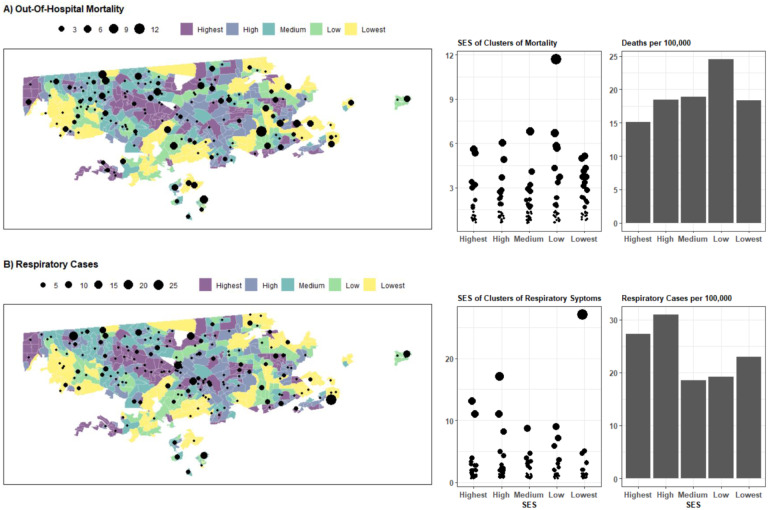
Results: An estimated 194.7 (95%CI: 135.5-253.9) excess out-of-hospital deaths events occurred, representing an increase of 145% (70%-338%) compared to forecasted trends. During the same window, only 8 COVID-19-positive, out-of-hospital deaths were reported in official statistics. This corresponded with a rise in respiratory cases of 274% (119%-1142%), and a drop in mean SpO2 to 77.7%, from 90.2% at baseline. The highest out-of-hospital death rates were observed in low-SES areas, although respiratory cases were more concentrated in high-SES areas.
Conclusions: EMS systems may play an important sentinel role in monitoring excess out-of-hospital mortality and other trends during the COVID-19 crisis in LMICs. Using EMS data, we observed increases in out-of-hospital deaths in Tijuana that were nearly threefold greater magnitude than increases reported using EMS data in Italy. Increased testing in out-of-hospital settings may be required to determine if excess mortality is being driven by COVID-19 infection, health system saturation, or patient avoidance of healthcare. We also found evidence of worsening rates of hypoxemia among respiratory patients seen by EMS, suggesting a rise in silent hypoxemia, which should be met with increased detection and clinical management efforts. Finally, we observed that social disparities in out-of-hospital death that warrant monitoring and amelioration.
Conflict of interest statement
Figures
References
-
- The World Bank. [May 15, 2020]; Isabella Danel and. An Assessment of LAC’s Vital Statistics System: The Foundation of Maternal and Infant Mortality Monitoring. Accessed. http://documents.worldbank.org/curated/en/206651468177844686/pdf/448620W....
-
- Estimating census and death registration completeness (census completeness, death registration coverage). Accessed May 15, 2020 https://unstats.un.org/unsd/vitalstatkb/KnowledgebaseArticle50331.aspx
-
- [May 15, 2020]; Geograffa (INEGI) IN de E y. Mortalidad. Registros administrativos. Vitales. Natalidad. Matrimonios. Published January 1, 1994. Accessed. https://www.inegi.org.mx/temas/mortalidad/
-
- Excess mortality from the Coronavirus pandemic (COVID-19). Our World in Data. Accessed May 15, 2020 https://ourworldindata.org/excess-mortality-covid
Publication types
Grants and funding
LinkOut - more resources
Full Text Sources
Miscellaneous