

This is a preprint.
Household Secondary Attack Rate of COVID-19 and Associated Determinants
- PMID: 32511590
- PMCID: PMC7276017
- DOI: 10.1101/2020.04.11.20056010
Household Secondary Attack Rate of COVID-19 and Associated Determinants
Update in
-
Household secondary attack rate of COVID-19 and associated determinants in Guangzhou, China: a retrospective cohort study.Lancet Infect Dis. 2020 Oct;20(10):1141-1150. doi: 10.1016/S1473-3099(20)30471-0. Epub 2020 Jun 17. Lancet Infect Dis. 2020. PMID: 32562601 Free PMC article.
Abstract
Background: As of April 2, 2020, the global reported number of COVID-19 cases has crossed over 1 million with more than 55,000 deaths. The household transmissibility of SARS-CoV-2, the causative pathogen, remains elusive.
Methods: Based on a comprehensive contact-tracing dataset from Guangzhou, we estimated both the population-level effective reproductive number and individual-level secondary attack rate (SAR) in the household setting. We assessed age effects on transmissibility and the infectivity of COVID-19 cases during their incubation period.
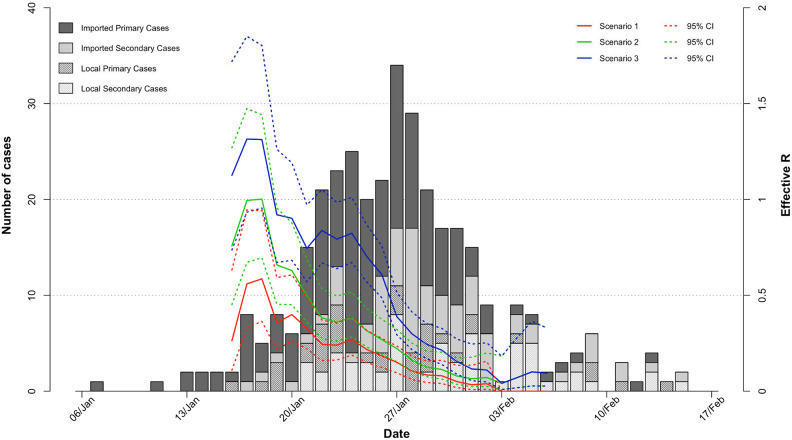
Results: A total of 195 unrelated clusters with 212 primary cases, 137 nonprimary (secondary or tertiary) cases and 1938 uninfected close contacts were traced. We estimated the household SAR to be 13.8% (95% CI: 11.1-17.0%) if household contacts are defined as all close relatives and 19.3% (95% CI: 15.5-23.9%) if household contacts only include those at the same residential address as the cases, assuming a mean incubation period of 4 days and a maximum infectious period of 13 days. The odds of infection among children (<20 years old) was only 0.26 (95% CI: 0.13-0.54) times of that among the elderly (≥60 years old). There was no gender difference in the risk of infection. COVID-19 cases were at least as infectious during their incubation period as during their illness. On average, a COVID-19 case infected 0.48 (95% CI: 0.39-0.58) close contacts. Had isolation not been implemented, this number increases to 0.62 (95% CI: 0.51-0.75). The effective reproductive number in Guangzhou dropped from above 1 to below 0.5 in about 1 week.
Conclusion: SARS-CoV-2 is more transmissible in households than SARS-CoV and MERS-CoV, and the elderly ≥60 years old are the most vulnerable to household transmission. Case finding and isolation alone may be inadequate to contain the pandemic and need to be used in conjunction with heightened restriction of human movement as implemented in Guangzhou.
Figures

References
Publication types
Grants and funding
LinkOut - more resources
Full Text Sources
Research Materials
Miscellaneous