

This is a preprint.
Effect of non-pharmaceutical interventions for containing the COVID-19 outbreak in China
- PMID: 32511601
- PMCID: PMC7276028
- DOI: 10.1101/2020.03.03.20029843
Effect of non-pharmaceutical interventions for containing the COVID-19 outbreak in China
Update in
-
Effect of non-pharmaceutical interventions to contain COVID-19 in China.Nature. 2020 Sep;585(7825):410-413. doi: 10.1038/s41586-020-2293-x. Epub 2020 May 4. Nature. 2020. PMID: 32365354 Free PMC article.
Abstract
Background: The COVID-19 outbreak containment strategies in China based on non-pharmaceutical interventions (NPIs) appear to be effective. Quantitative research is still needed however to assess the efficacy of different candidate NPIs and their timings to guide ongoing and future responses to epidemics of this emerging disease across the World.
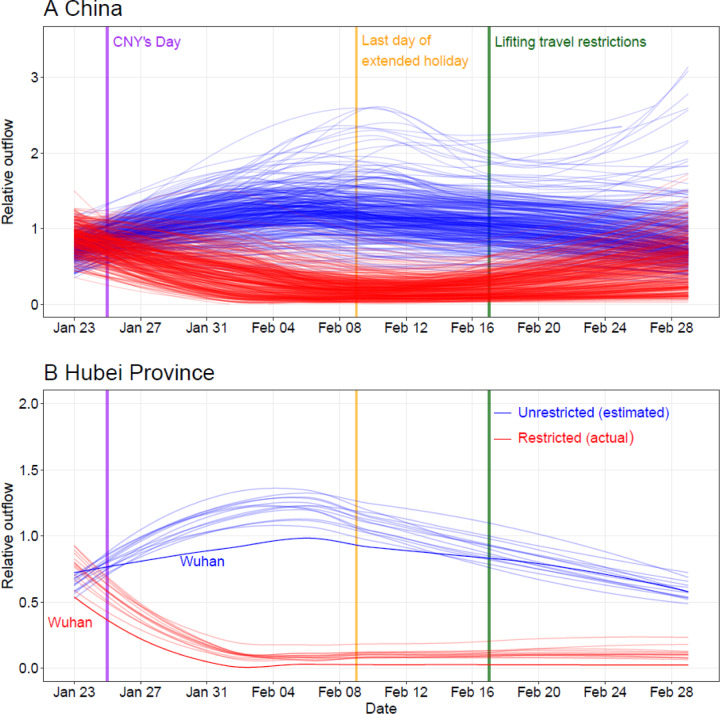
Methods: We built a travel network-based susceptible-exposed-infectious-removed (SEIR) model to simulate the outbreak across cities in mainland China. We used epidemiological parameters estimated for the early stage of outbreak in Wuhan to parameterise the transmission before NPIs were implemented. To quantify the relative effect of various NPIs, daily changes of delay from illness onset to the first reported case in each county were used as a proxy for the improvement of case identification and isolation across the outbreak. Historical and near-real time human movement data, obtained from Baidu location-based service, were used to derive the intensity of travel restrictions and contact reductions across China. The model and outputs were validated using daily reported case numbers, with a series of sensitivity analyses conducted.
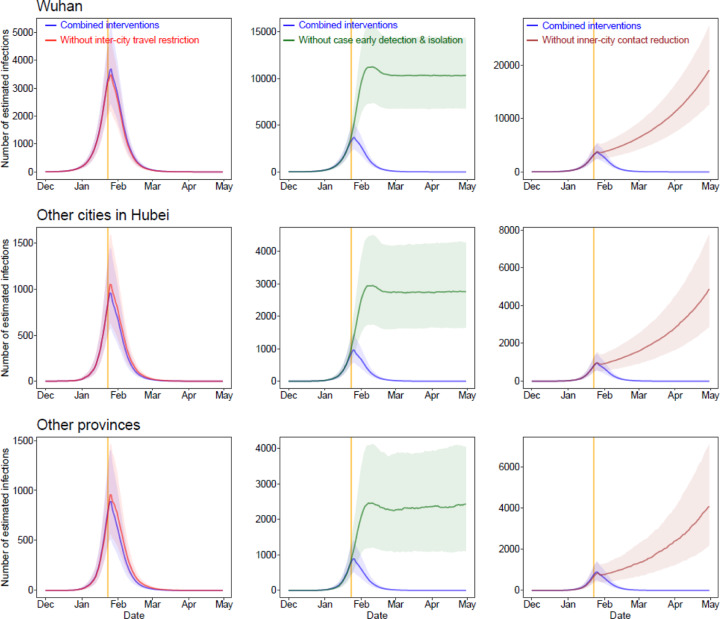
Results: We estimated that there were a total of 114,325 COVID-19 cases (interquartile range [IQR] 76,776 - 164,576) in mainland China as of February 29, 2020, and these were highly correlated (p<0.001, R2=0.86) with reported incidence. Without NPIs, the number of COVID-19 cases would likely have shown a 67-fold increase (IQR: 44 - 94), with the effectiveness of different interventions varying. The early detection and isolation of cases was estimated to prevent more infections than travel restrictions and contact reductions, but integrated NPIs would achieve the strongest and most rapid effect. If NPIs could have been conducted one week, two weeks, or three weeks earlier in China, cases could have been reduced by 66%, 86%, and 95%, respectively, together with significantly reducing the number of affected areas. However, if NPIs were conducted one week, two weeks, or three weeks later, the number of cases could have shown a 3-fold, 7-fold, and 18-fold increase across China, respectively. Results also suggest that the social distancing intervention should be continued for the next few months in China to prevent case numbers increasing again after travel restrictions were lifted on February 17, 2020.
Conclusion: The NPIs deployed in China appear to be effectively containing the COVID-19 outbreak, but the efficacy of the different interventions varied, with the early case detection and contact reduction being the most effective. Moreover, deploying the NPIs early is also important to prevent further spread. Early and integrated NPI strategies should be prepared, adopted and adjusted to minimize health, social and economic impacts in affected regions around the World.
Conflict of interest statement
Declaration of interests
We declare no competing interests.
Figures


References
-
- World Health Organization. Novel coronavirus (2019-nCoV). 2020. https://www.who.int/emergencies/diseases/novel-coronavirus-2019 (accessed 29 February 2020).
-
- World Health Organization. Coronavirus Disease (COVID-19) Press Conference, 21 February 2020. 2020. https://www.who.int/docs/default-source/coronaviruse/transcripts/who-aud... (accessed 23 February 2020).
Publication types
Grants and funding
LinkOut - more resources
Full Text Sources