[Preprint]. 2020 Jul 5:2020.04.15.20066746.
doi: 10.1101/2020.04.15.20066746.

Temporal detection and phylogenetic assessment of SARS-CoV-2 in municipal wastewater

Affiliations

Temporal detection and phylogenetic assessment of SARS-CoV-2 in municipal wastewater

Artem Nemudryi et al. medRxiv. .

Update in

Abstract

SARS-CoV-2 has recently been detected in feces, which indicates that wastewater may be used to monitor viral prevalence in the community. Here we use RT-qPCR to monitor wastewater for SARS-CoV-2 RNA over a 52-day time course. We show that changes in SARS-CoV-2 RNA concentrations correlate with local COVID-19 epidemiological data (R2=0.9), though detection in wastewater trails symptom onset dates by 5-8 days. We determine a near complete (98.5%) SARS-CoV-2 genome sequence from the wastewater and use phylogenic analysis to infer viral ancestry. Collectively, this work demonstrates how wastewater can be used as a proxy to monitor viral prevalence in the community and how genome sequencing can be used for high-resolution genotyping of the predominant strains circulating in a community.


Conflict of interest statement

Declaration of interests B.W. is the founder of SurGene, LLC, and is an inventor on patent applications related to CRISPR-Cas systems and applications thereof.

Figures
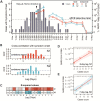
Fig 1.
Fig 1.. Detection and quantification of SARS-CoV-2 in wastewater and in the community.
A) SARS-CoV-2 RT-qPCR tests were performed according to CDC guidelines and protocols. Detection included two primer pairs, each targeting distinct regions of the nucleocapsid (N) gene from SARS-CoV-2 (i.e., N1, and N2). Three 0.5-liter samples were collected manually (grab) or subsampled from a 24-hour composite. SARS-CoV-2 RNA concentrations (copies per liter) were estimated using a standard curve. The limit of detection in this assay is 10 copies per 20 μl qPCR reaction. For composite samples, concentrations were normalized according to the total daily volume (see Methods). Temporal dynamics of SARS-CoV-2 RNA (line graph) superimposed on the epidemiological data (bar plot). Symptom onset data was collected by interviewing COVID-19 patients. Bars represent number of patients who reported symptom onset on the specified day. B) Cross-correlation of epidemiological data and SARS-CoV-2 RNA levels in wastewater. Values of cross-correlation function (CCF) are offset by 0- to 14-days. The 95% confidence interval is shown with dashed blue line. CCFs above this line are statistically significant. C) The relationship between symptom onset and SARS-CoV-2 RNA measured in wastewater was modeled using linear regression. Goodness-of-fit (R-squared values) metrics are shown for displacing RT-qPCR data relative to symptom onset by 0- to 14-days. D and E) Linear regression between symptom onset and total SARS-CoV-2 RNA in wastewater adjusted for 8-day and 7-day lags for N1 and N2, respectively. Pink and blue shadows define the 95% confidence interval.
Fig 2.
Fig 2.. Phylogenetic analysis of SARS-CoV-2 sequences from wastewater.
A) Maximum-likelihood phylogeny of the SARS-CoV-2 related lineage (n = 14,971 sequences). Phylogenetic history of SARS-CoV-2 strain sequenced from Bozeman’s wastewater is shown in crimson. Outer ring colored according to regions of the world where the samples were isolated. Tree is rooted relative to RaTG13 genome (a bat coronavirus with 96% sequence similarity to SARS-CoV-2; Genbank: MN996532.1). Mutations that occurred over space and time are shown in red. B) Inset from panel B: sequences isolated from Bozeman wastewater clade with sequences of American and Australian origin (left). Sequences are named according to geographic origin and viral isolation date. Comparison of mutations in sequences shown in inset (right). The Wuhan reference sequence for each of the positions where mutations occur is shown across the top. Mutated positions and bases present in Bozeman wastewater (WW) sequence are shown in red, bases matching Wuhan reference sequence are shown in white, and mutations not present in Bozeman WW sequence are shown in blue.

References

    1. Ahmed W., Angel N., Edson J., Bibby K., Bivins A., O’Brien J.W., Choi P.M., Kitajima M., Simpson S.L., Li J., et al. (2020). First confirmed detection of SARS-CoV-2 in untreated wastewater in Australia: A proof of concept for the wastewater surveillance of COVID-19 in the community. Sci Total Environ 728, 138764. - PMC - PubMed
    1. Bedford T., Greninger A.L., Roychoudhury P., Starita L.M., Famulare M., Huang M.-L., Nalla A., Pepper G., Reinhardt A., Xie H., et al. (2020). Cryptic transmission of SARS-CoV-2 in Washington State. medRxiv. - PMC - PubMed
    1. Capella-Gutierrez S., Silla-Martinez J.M., and Gabaldon T. (2009). trimAl: a tool for automated alignment trimming in large-scale phylogenetic analyses. Bioinformatics 25, 1972–1973. - PMC - PubMed
    1. Castillo A.E., Parra B., Tapia P., Acevedo A., Lagos J., Andrade W., Arata L., Leal G., Barra G., Tambley C., et al. (2020). Phylogenetic analysis of the first four SARS-CoV-2 cases in Chile. J Med Virol. - PMC - PubMed
    1. Cheung K.S., Hung I.F., Chan P.P., Lung K.C., Tso E., Liu R., Ng Y.Y., Chu M.Y., Chung T.W., Tam A.R., et al. (2020). Gastrointestinal Manifestations of SARS-CoV-2 Infection and Virus Load in Fecal Samples from the Hong Kong Cohort and Systematic Review and Meta-analysis. Gastroenterology. - PMC - PubMed

Publication types