

Multiple pathways coordinate assembly of human mitochondrial complex IV and stabilization of respiratory supercomplexes
- PMID: 32511785
- PMCID: PMC7360963
- DOI: 10.15252/embj.2019103912
Multiple pathways coordinate assembly of human mitochondrial complex IV and stabilization of respiratory supercomplexes
Abstract
Mitochondrial respiratory chain complexes I, III, and IV can associate into larger structures termed supercomplexes or respirasomes, thereby generating structural interdependences among the individual complexes yet to be understood. In patients, nonsense mutations in complex IV subunit genes cause severe encephalomyopathies randomly associated with pleiotropic complex I defects. Using complexome profiling and biochemical analyses, we have explored the structural rearrangements of the respiratory chain in human cell lines depleted of the catalytic complex IV subunit COX1 or COX2. In the absence of a functional complex IV holoenzyme, several supercomplex I+III2 species coexist, which differ in their content of COX subunits and COX7A2L/HIGD2A assembly factors. The incorporation of an atypical COX1-HIGD2A submodule attenuates supercomplex I+III2 turnover rate, indicating an unexpected molecular adaptation for supercomplexes stabilization that relies on the presence of COX1 independently of holo-complex IV formation. Our data set the basis for complex I structural dependence on complex IV, revealing the co-existence of alternative pathways for the biogenesis of "supercomplex-associated" versus individual complex IV, which could determine physiological adaptations under different stress and disease scenarios.
Keywords: mitochondrial biogenesis; mitochondrial complex IV assembly; mitochondrial respiratory chain; respirasomes; respiratory supercomplex stabilization.
© 2020 The Authors.
Conflict of interest statement
The authors declare that they have no conflict of interest.
Figures
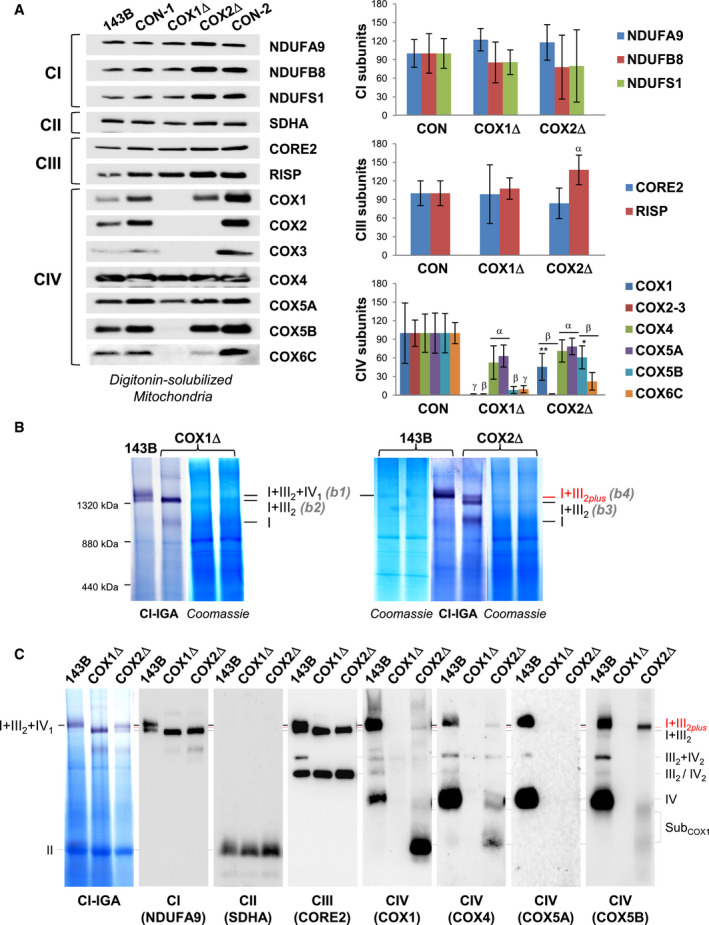
- A
Mitochondrial extracts from 143B cells, and COX1Δ and COX2Δ mutant cybrids and their respective isogenic controls (CON‐1 and CON‐2) were analyzed by SDS–PAGE and immunoblotting with the indicated antibodies. The graphs (right) show densitometric quantifications of the signals normalized to CII subunit SDHA. The mean of three independent controls (CON) was set to 100, and all measurements were referenced to that value. The values represent mean ± SD (n = 3–8). Mann–Whitney U‐test was applied for statistical analyses. Variations between controls and mutants: α, P < 0.05; β, P < 0.01; and γ, P < 0.001. Specific variations between COX1Δ and COX2Δ mutants: *P < 0.05; **P < 0.01.
- B
Digitonized mitochondria (digitonin‐to‐protein ratio of 2:1) were analyzed by BN–PAGE, followed by CI in‐gel activity (IGA) assays and Coomassie staining. The SC I+III2+IV1 band (b1) was excised from the control (143B) lane, and the SC I+III2 bands (b2 to b4) were excised from the COX1Δ and COX2Δ lanes. Their protein compositions were subsequently analyzed by nano‐LC/ESI‐MS (see also Fig EV2). The relative position of the molecular weight marker is indicated on the left.
- C
BN–PAGE was followed by CI‐IGA assay and immunoblotting with the indicated antibodies (in brackets). The identity of the MRC complexes and SCs is I+III2+IV1, SC containing CI, CIII2, and CIV; I+III2, SC containing CI and CIII2; I+III2plus, SC containing CI, CIII2, and a COX1 submodule; III2+IV, SC containing CIII2 and CIV; I, complex I; III2, CIII dimer; IV2, CIV dimer; subCOX1, COX1‐containing subcomplexes.

- A
Whole‐cell lysates from control 143B and HEK293T cells, COX1Δ and COX2Δ cybrids, COX18Δ HEK293T cells, and COX18Δ cells complemented with wild‐type COX18 (+COX18) were analyzed by SDS–PAGE and immunoblotting with antibodies targeting CIV subunits and SDHA as a loading control.
- B
Digitonin‐solubilized mitochondria from control and COX18Δ HEK293T cells were analyzed by BN–PAGE, followed by CI‐IGA assay and immunoblotting with the indicated antibodies. I+III2+IV1, SC containing CI, CIII2, and CIV; I+III2, SC containing CI and CIII2; I+III2plus, SC containing CI, CIII2, and a COX1 submodule; III2+IV1, SC containing CIII2 and CIV; III2, CIII dimer; IV2, CIV dimer; IV, CIV monomer.
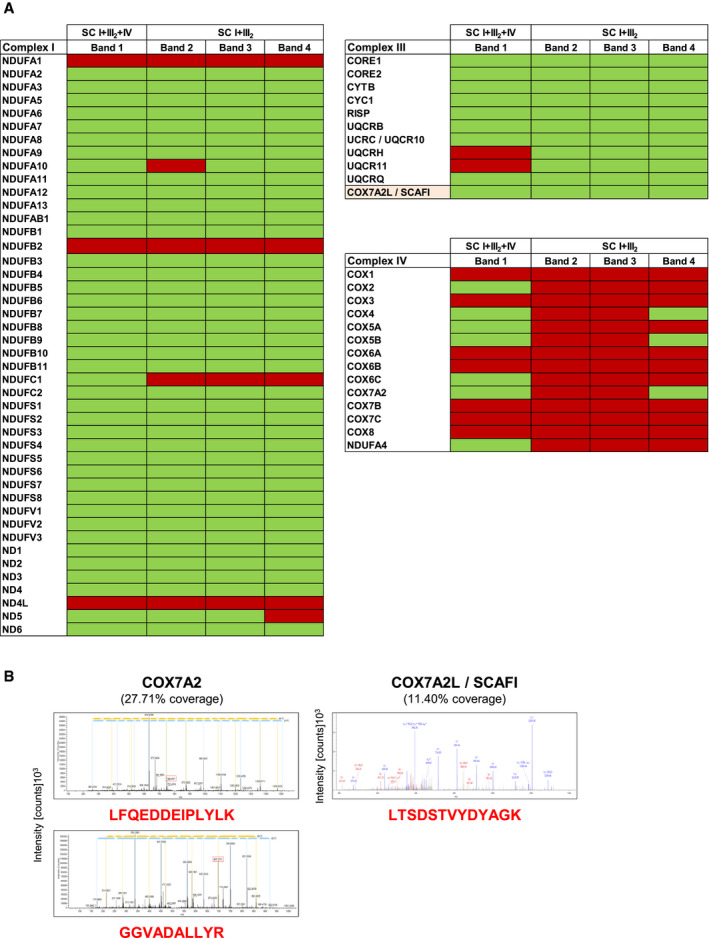
- A
Digitonin‐solubilized mitochondria from control, COX1Δ, and COX2Δ cybrids were separated by 1D‐BN–PAGE. CI‐containing bands 1–4 were identified by CI‐IGA assays, excised from Coomassie‐stained gels, and analyzed by nano‐LC/ESI‐MS in two independent experiments per sample. The presence (green) or absence (red) of MRC subunits detected on each band is indicated.
- B
MS/MS spectra from the doubly charged COX7A2 (left) and COX7A2L (right) peptides unambiguously detected by LC‐ESI/MS. The amino acid sequences of the identified unique peptides are highlighted in red. The most intense signals on the MS/MS spectra correspond to the main fragmentation series (b‐amino and y‐carboxy). I+III2+IV1, SC containing CI, CIII2, and CIV; I+III2, SCs containing CI and CIII2.
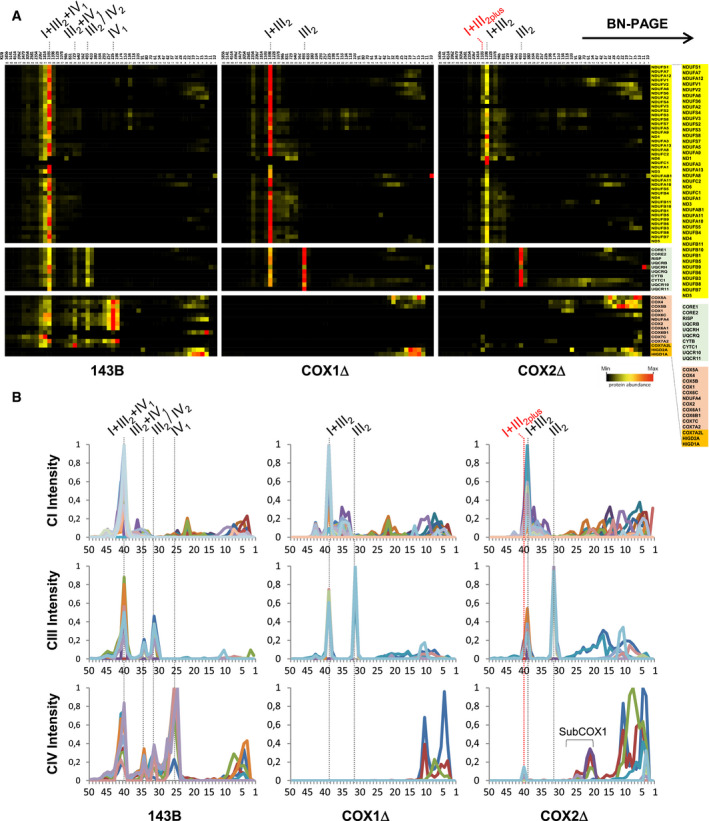
- A
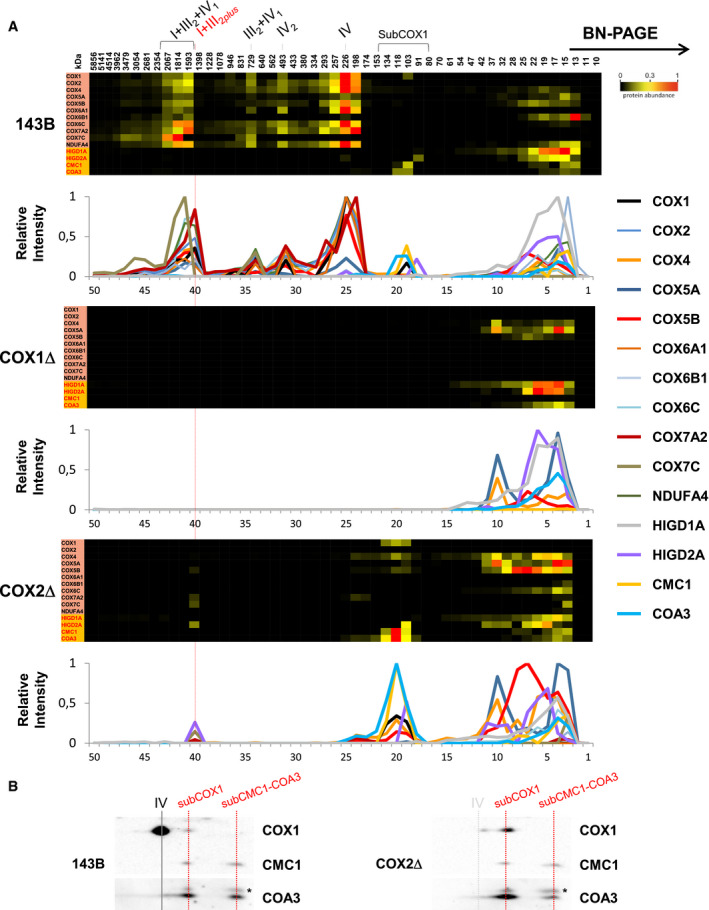
Control 143B cells (left panels), COX1Δ cybrids (middle panels), and COX2Δ cybrids (right panels). The right lane highlights structural subunits of CI (yellow), CIII (light green), and CIV (orange brown), and assembly factors (orange). Intensity‐based absolute quantification (iBAQ) values were normalized to the sum of all control values. Top lanes indicate gel slice numbers and their relative native masses.
- B
Intensity profiles showing abundance and relative distribution of structural subunits from CI (upper graphs), CIII (middle graphs), and CIV (bottom graphs). The identities of MRC complexes and SCs are as in Fig 1.
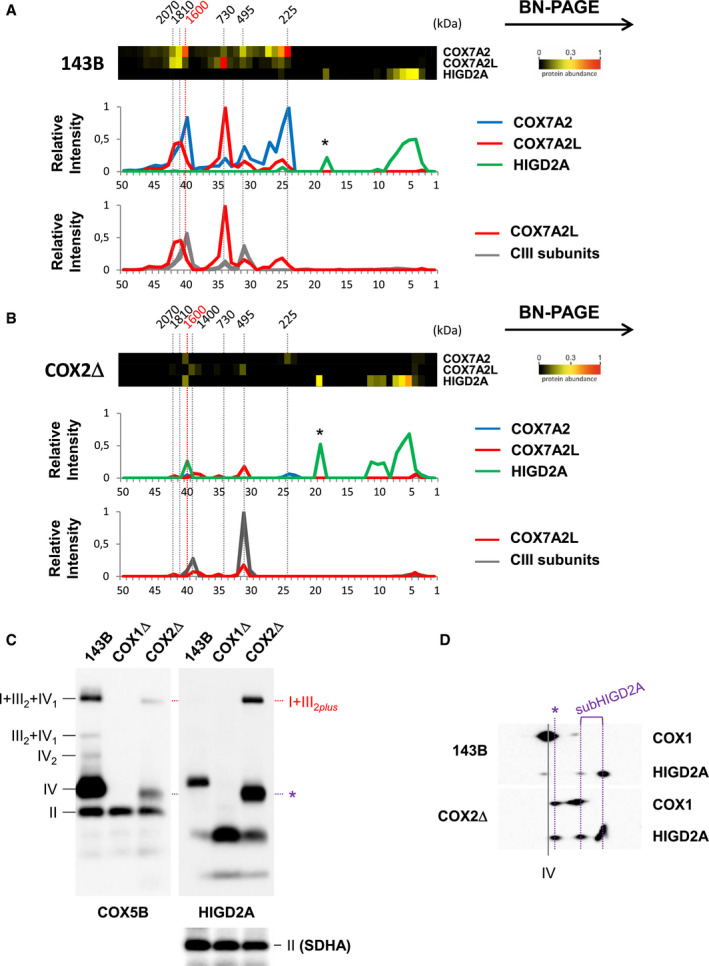
- A, B
Excerpts of complexome profiling data showing the relative distribution of COX7A2, COX7A2L, and HIGD2A in (A) control 143B cells and (B) COX2Δ cybrids. The molecular weight (˜ 1.6 MDa) of the COX7A2‐containing respirasomes (SC I+III2+IV1 in CON cells, and SC I+III2plus in COX2Δ cybrids) is highlighted in red. The relative abundance and distribution of COX7A2L relative to CIII subunits are shown in the lower graphs.
- C, D
(C) BN–PAGE or (D) 2D‐BN/SDS–PAGE from control (143B) and mutant cybrids followed by immunoblotting with the indicated antibodies. I+III2+IV1, SC containing CI, CIII, and CIV; I+III2plus, SC containing CI, CIII, and specific COX subunits; III2+IV, SC containing CIII and CIV; IV2, CIV dimer; IV, CIV monomer; II, complex II used as loading control. The presence of a COX1‐COX5B‐HIGD2A‐containing subcomplex is indicated with an asterisk.
- A
Excerpts of complexome profiling data showing the distribution of CIV subunits and assembly factors HIGD1A, HIGD2A, CMC1, and COA3 in control (143B), COX1Δ, and COX2Δ cybrids. The relative abundance and distribution of detected proteins are shown in the lower graphs. The localization of SC I+III2plus in COX2Δ cybrids is highlighted with a red line. The approximate molecular weights of CIV‐containing structures are indicated on the top (in kDa).
- B
2D‐BN/SDS–PAGE analysis from control (143B) and COX2Δ cybrids followed by immunoblotting with the indicated antibodies. I+III2+IV1, SC containing CI, CIII, and CIV; I+III2plus, SC containing CI, CIII, and a COX1 submodule; III2+IV, SC containing CIII and CIV; IV2, CIV dimer; IV, CIV monomer. The presence of a COX1‐CMC1‐COA3‐containing subcomplex is indicated.
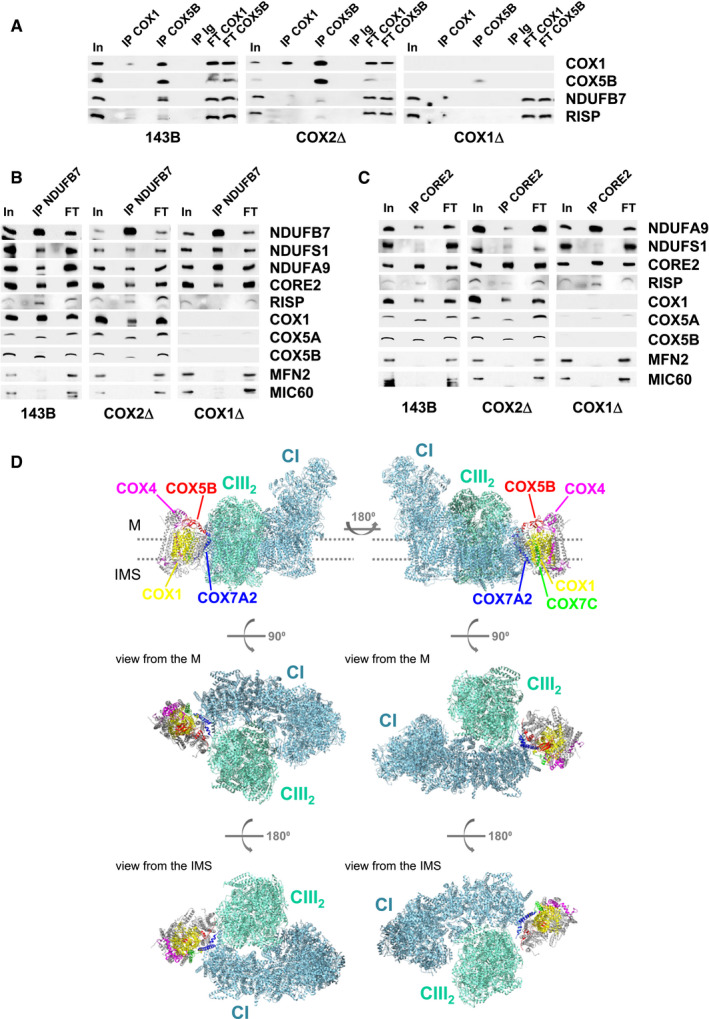
- A–C
Mitochondrial extracts from control 143B cells (left), COX1Δ cybrids (right), and COX2Δ cybrids (middle) were immunoprecipitated using antibodies against (A) CIV subunits COX1 and COX5B. (B) CI subunit NDUFB7. (C) CIII subunit CORE2. Samples were subsequently analyzed by SDS–PAGE and immunoblotting with the indicated antibodies. In, input. IP, immunoprecipitate. FT, flow‐through. Ig, unrelated immunoglobulin used as a negative control.
- D
Structural arrangement of COX subunits detected in association with SC I+III2. Upper illustrations depict lateral views of human SC I+III2+IV1, where CI (aquamarine) and CIII2 (light green) are positioned along the inner membrane plane (dots). CIV appears as a smooth backbone with the associated COX subunits highlighted to show their positions relative to SC I+III2: COX7A2 (blue) and COX5B (red) attach COX1 (yellow) to the concave surface formed by CIII2 and the CI membrane arm, interaction further stabilized by COX7C (green) binding to CI. COX4 (magenta) interacts with COX1 on the distal side of CIV. Medium illustrations: matrix (M) view. Lower illustrations: intermembrane space (IMS) view. The figure was created with USCF Chimera v.1.12 using the 5XTH structure (Guo et al, 2017) from the PDB database.
- A
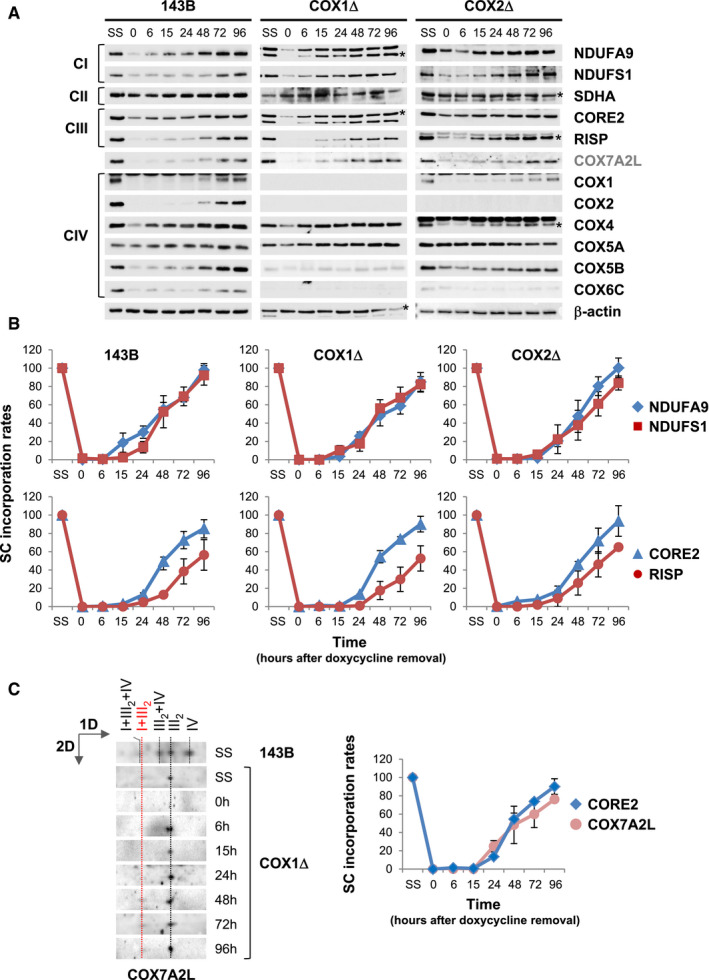
Whole‐cell extracts were subsequently analyzed by SDS–PAGE and immunoblotting with the indicated antibodies. β‐actin was used as a loading control. Asterisks indicate the matching bands recognized by the antibodies.
- B
Mitochondria were extracted with a digitonin‐to‐protein ratio of 2:1 g/g and analyzed by BN–PAGE. The assembly dynamics of CI subunits NDUFA9 and NDUFS1, involved in early and late steps of CI assembly, and of CIII subunits CORE2 and RISP, involved in early and late steps of CIII assembly, were compared in the three cell lines.
- C
Assembly kinetics of COX7A2L relative to CORE2 in the COX1Δ cybrids. The directions of electrophoresis on 2D‐BN/SDS–PAGE gels are indicated with arrows. I+III2+IV, SCs containing CI, CIII, and CIV; I+III2, SC containing CI and CIII; III2+IV, SC containing CIII and CIV; III2, CIII dimer; IV, CIV monomer.
- A
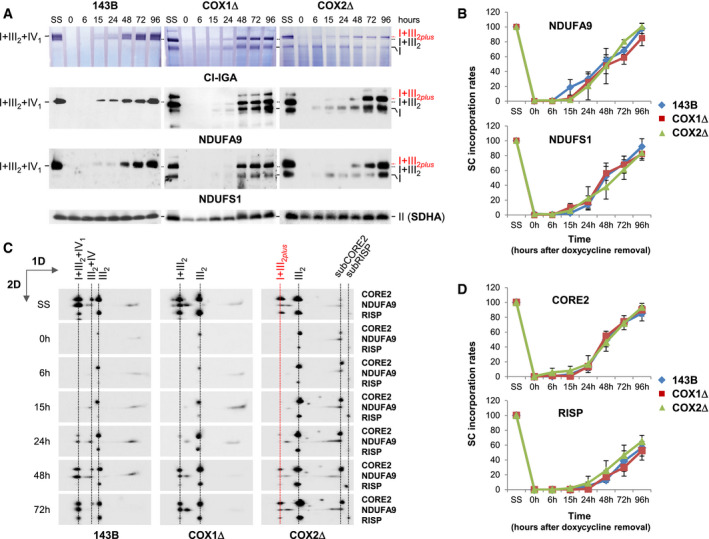
Digitonin‐solubilized mitochondria from doxycycline‐treated 143B cells, and COX1Δ and COX2Δ cybrids were analyzed by BN–PAGE followed by CI‐IGA assays (upper panels) or immunoblotting (medium and lower panels) with antibodies against CI subunits NDUFA9 and NDUFS1.
- B
Mean incorporation rates of NDUFA9 and NDUFS1 into SC I+III2+IV1 from 143B cells and into SC I+III2 from the CIV‐KO cybrids.
- C
Samples were subsequently analyzed by 2D‐BN/SDS–PAGE and immunoblotting with the indicated antibodies.
- D
Mean incorporation rates of CIII subunits CORE2 and RISP into SC I+III2+IV1 from control cells and into SC I+III2 from CIV‐KO cybrids.
- B–D
Signals from at least three independent experiments were quantified and normalized by CII subunit SDHA levels. Time‐point values are expressed as percentages of untreated cells (SS) and indicated as mean ± SD.
- A–C
The identities of MRC complexes and SCs are as in Fig 1.
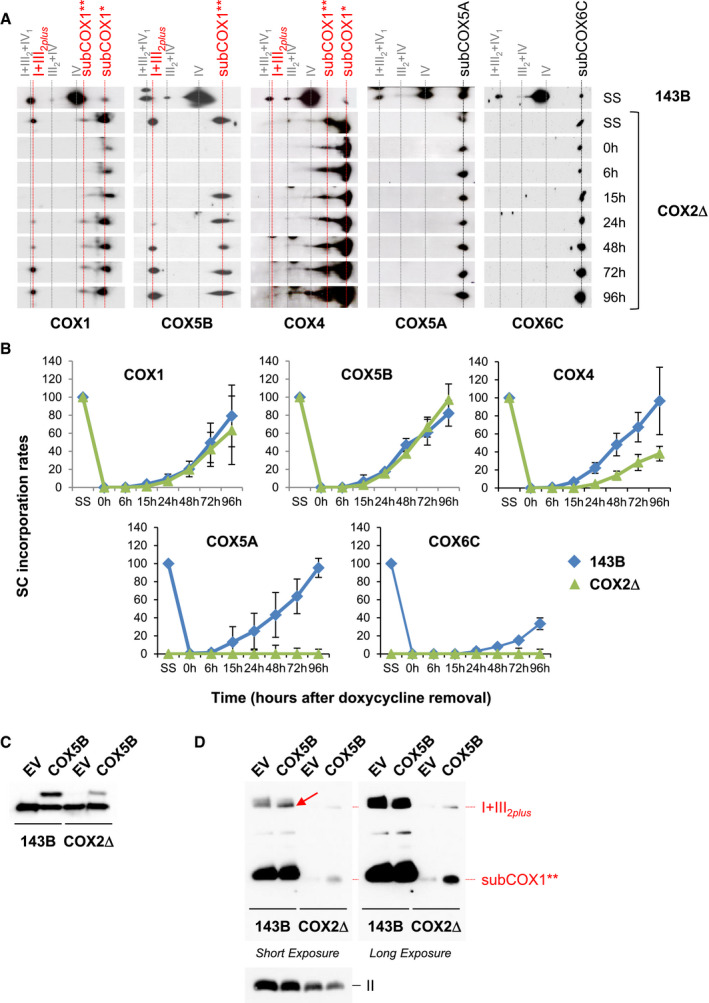
- A
Digitonized mitochondria from doxycycline‐treated 143B cells and COX2Δ cybrids were analyzed by 2D‐BN/SDS–PAGE and Western blot with the indicated antibodies.
- B
Mean incorporation rates of COX subunits into SC I+III2plus from COX2Δ cybrids. Signals from three independent experiments were quantified and normalized by CII. Time‐point values are expressed as percentages of the untreated cells (SS) and indicated as mean ± SD. Control (143B) values for subunits COX4, COX5A, and COX6C were obtained from (Moreno‐Lastres et al, 2012).
- C, D
SDS–PAGE (C) and BN–PAGE (D) analyses from 143B cells and COX2Δ cybrids transiently transfected either with a COX5B‐Myc‐DDK construct or with the empty vector, followed by immunoblotting with antibodies against COX5B and CII subunit SDHA (loading control). The identities of MRC complexes and SCs are as in Fig 1. The red arrow points to the accumulation of overexpressed COX5B bound to SC I+III2 in control cells.
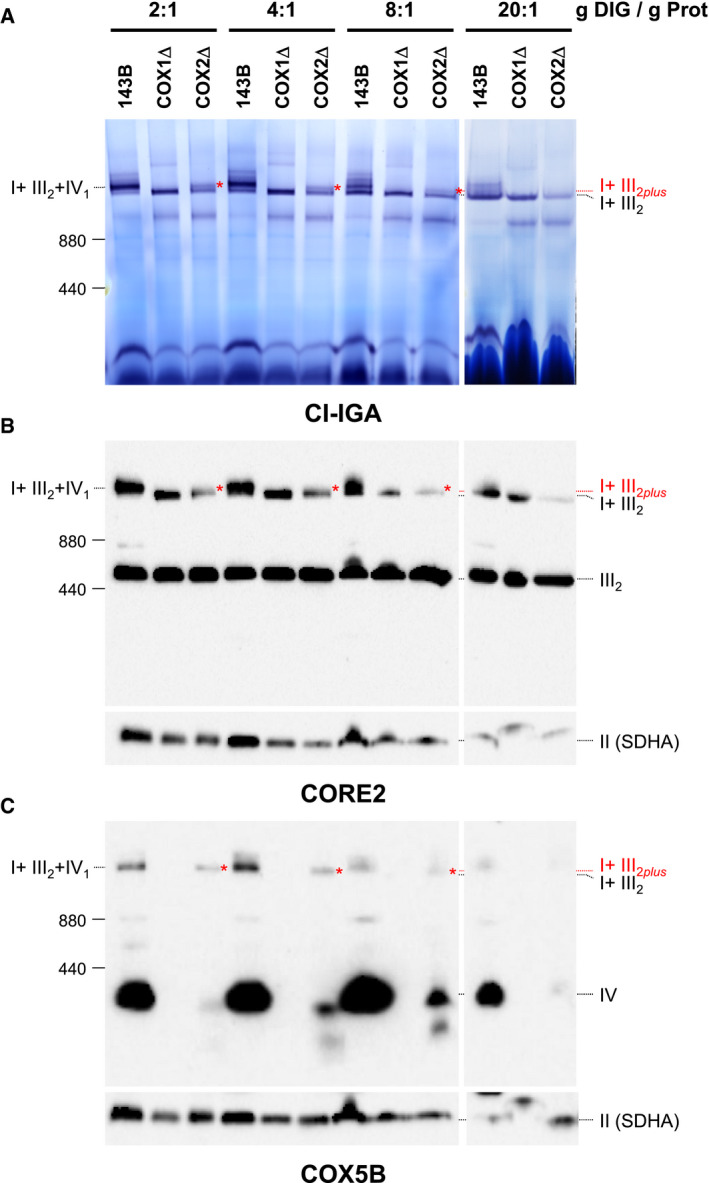
- A–C
Mitochondria from control (143B), COX1Δ, and COX2Δ cybrids were extracted with increasing digitonin‐to‐mitochondrial protein ratios (ranging from 2 to 20 g/g) and analyzed by BN–PAGE followed by (A) CI‐IGA assays, or alternatively, by immunoblotting with antibodies against (B) the CIII subunit CORE2, or with (C) the CIV subunit COX5B. Red asterisks indicate the presence of SC I+III2plus in the COX2Δ cybrids. I+III2+IV1, SC containing CI, CIII2, and CIV; I+III2, SC containing CI and CIII2; I+III2plus, SC containing CI, CIII2, and a COX1 submodule.

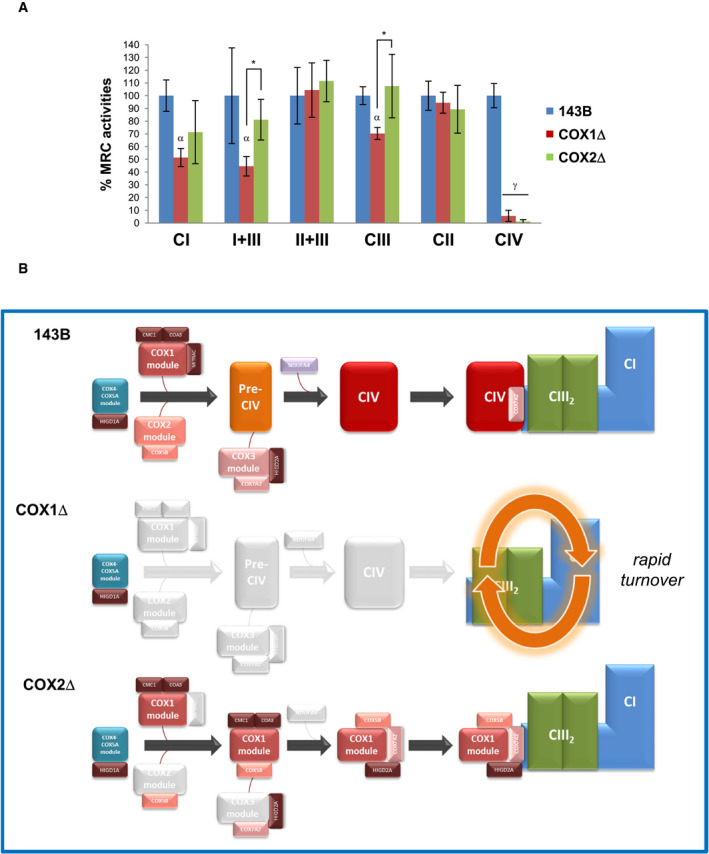
- A
Respiratory chain enzyme activities of control (blue), COX1Δ (red), and COX2Δ (green) cybrids. Enzyme activities were measured in three experimental replicates. Data are expressed as the percentages of control cells and indicated as means ± SD. Mann–Whitney U‐test was applied for statistical analyses. Variations between controls and mutants: α, P < 0.05; γ, P < 0.001. Specific variations between COX1Δ and COX2Δ mutants: *P < 0.05.
- B
Structural reorganization of SCs in the absence of CIV. In control cells (top), subunits COX4 and COX5A form an independent subcomplex that binds newly synthesized COX1, allowing the completion of CIV assembly and its further integration into respirasomes through canonical pathways. In COX1Δ cybrids (middle), SC I+III2 is rapidly degraded due to the absence of stabilizing CIV components. In COX2Δ cybrids (bottom), SC I+III2 is stabilized by the binding of a “non‐canonical” stable COX1 submodule (comprising subunits COX1, COX5B, and COX7A2 and the assembly factor HIGD2A), likely by keeping this SC in an assembly competent state for the further incorporation of CIV subunits/modules up to completion of respirasome biogenesis.
References
-
- Acín‐Pérez R, Fernández‐Silva P, Peleato ML, Pérez‐Martos A, Enriquez JA (2008) Respiratory active mitochondrial supercomplexes. Mol Cell 32: 529–539 - PubMed
-
- Balsa E, Marco R, Perales‐Clemente E, Szklarczyk R, Calvo E, Landázuri MO, Enríquez JA (2012) NDUFA4 is a subunit of complex IV of the mammalian electron transport chain. Cell Metab 16: 378–386 - PubMed
Publication types
MeSH terms
Substances
Grants and funding
LinkOut - more resources
Full Text Sources
Research Materials
