. 2020 Sep:331:113354.
doi: 10.1016/j.expneurol.2020.113354. Epub 2020 Jun 5.

Chronic defects in intraspinal mechanisms of spike encoding by spinal motoneurons following chemotherapy

Affiliations

Chronic defects in intraspinal mechanisms of spike encoding by spinal motoneurons following chemotherapy

Stephen N Housley et al. Exp Neurol. 2020 Sep.

Abstract

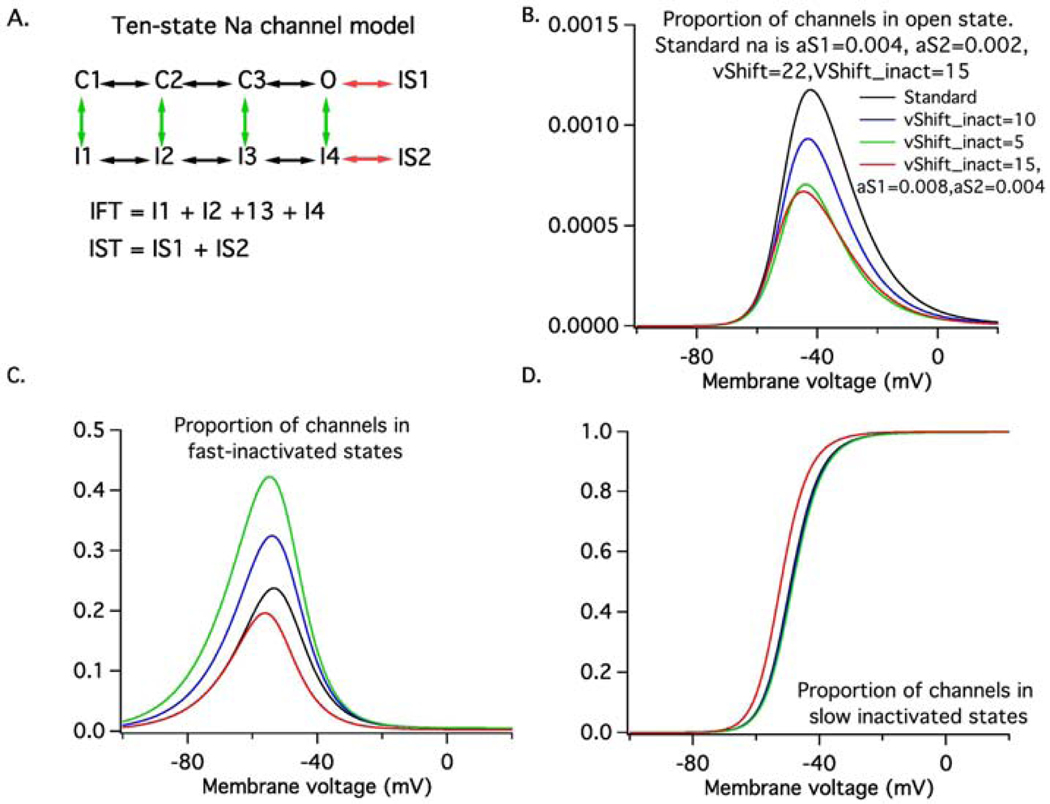
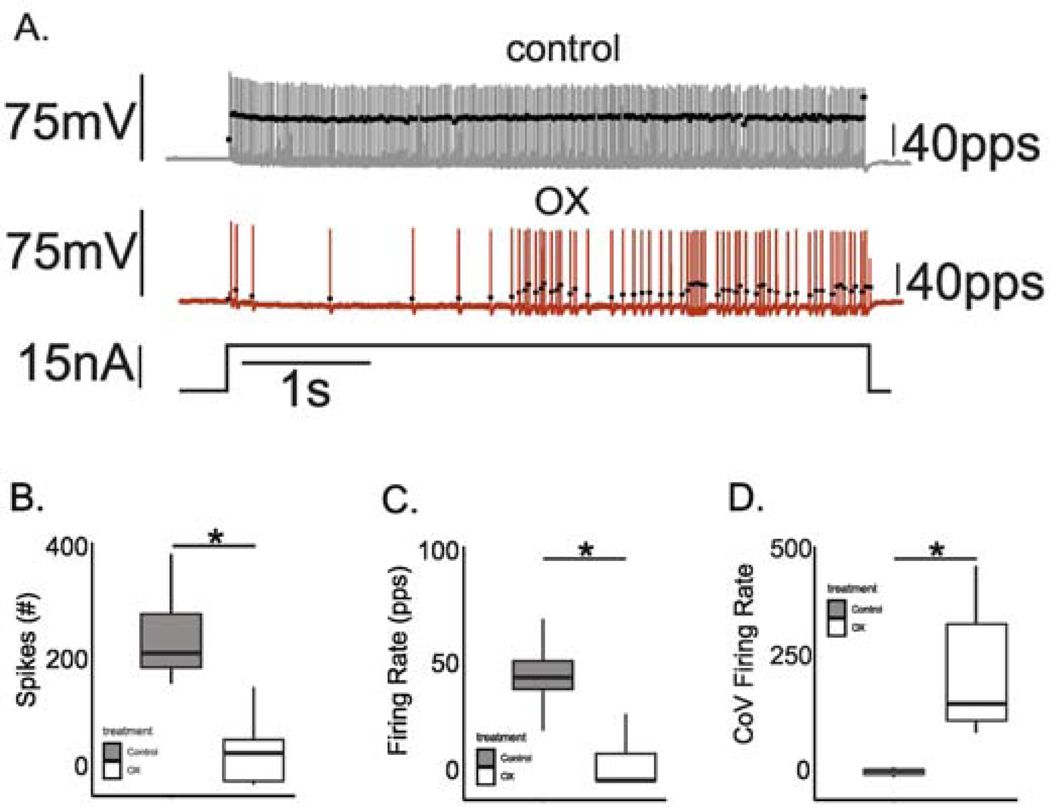
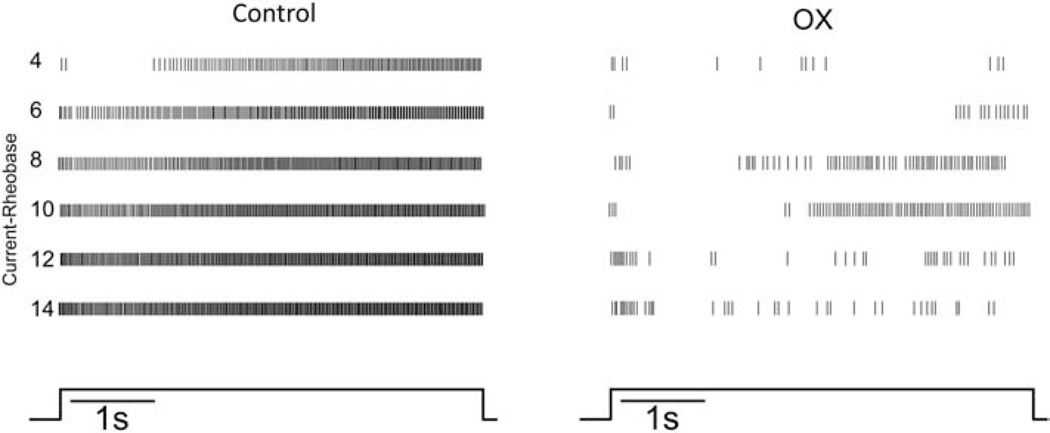
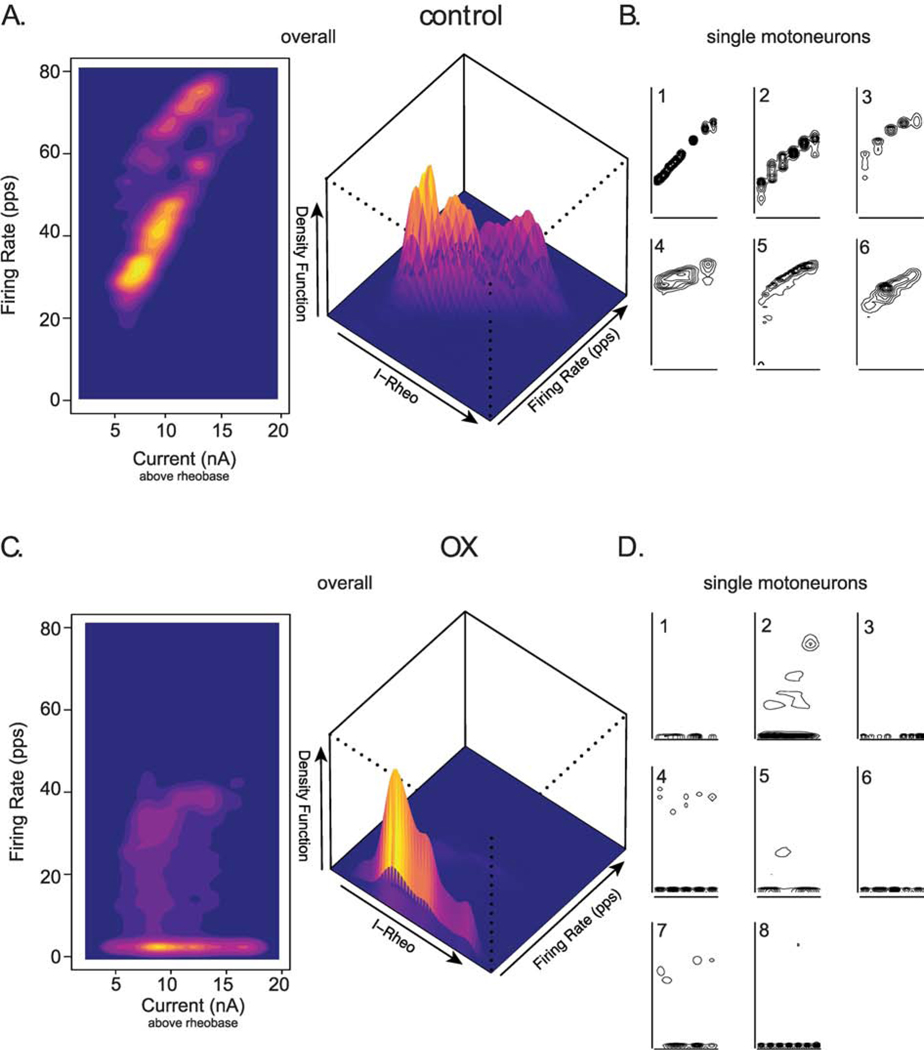
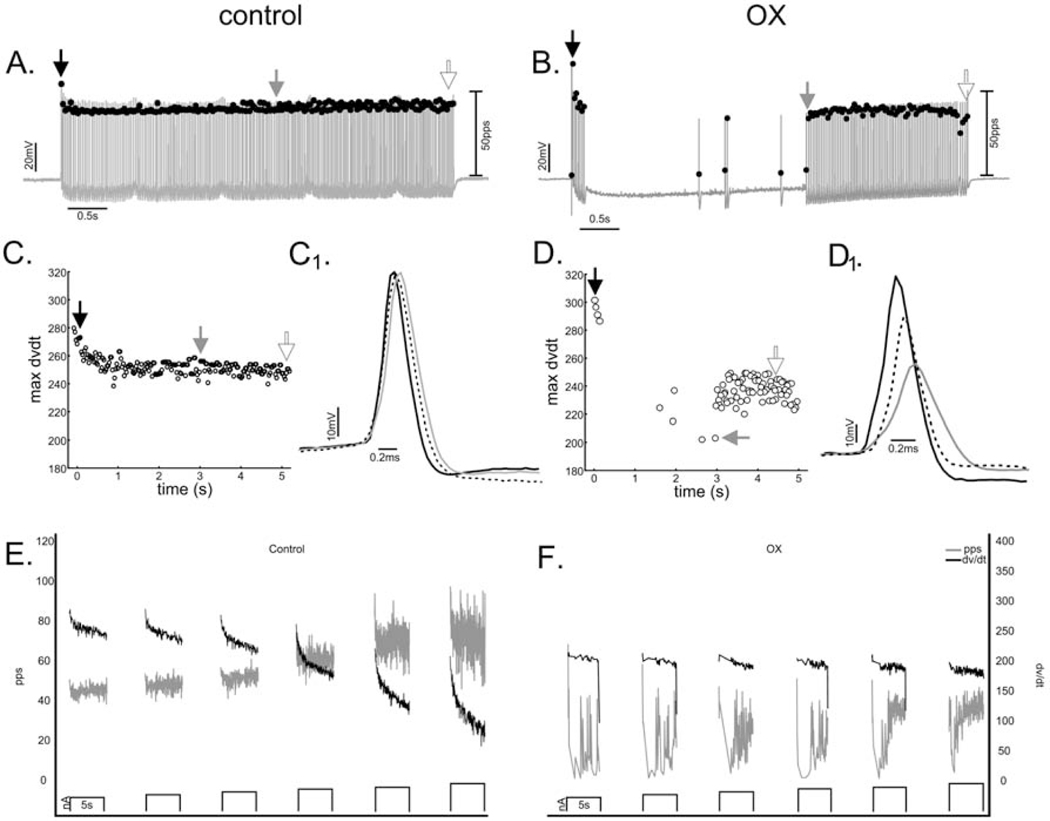
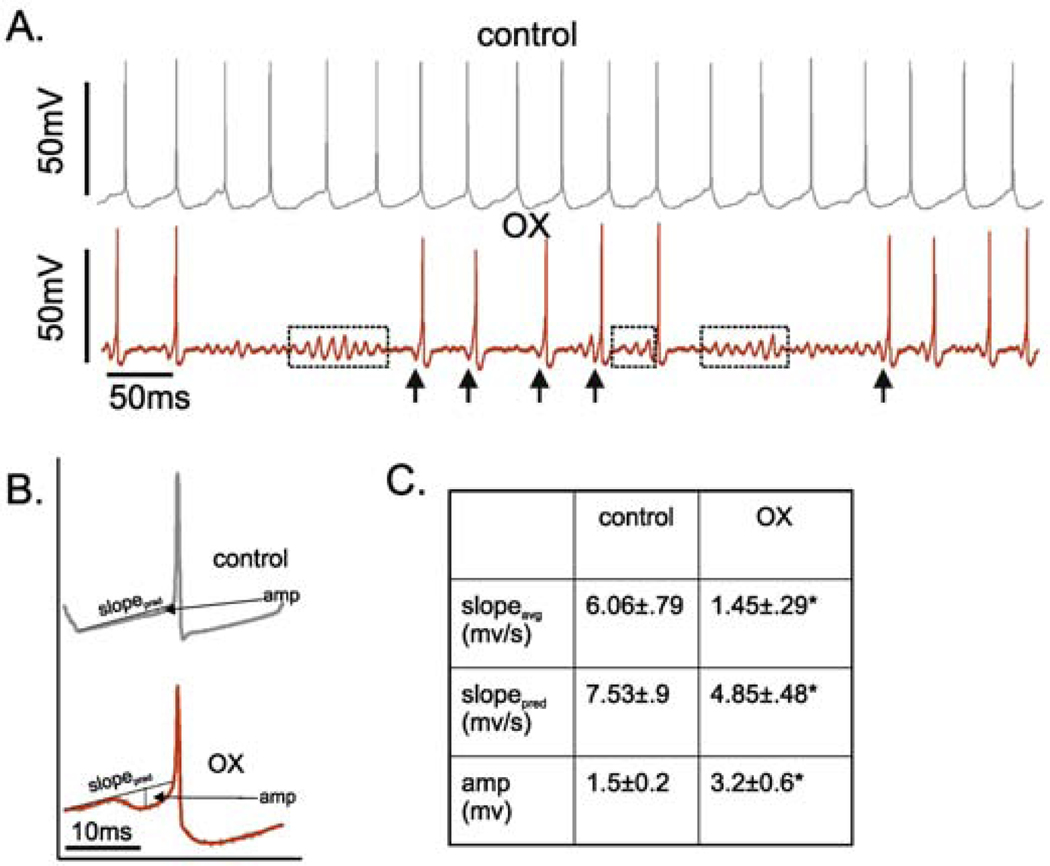
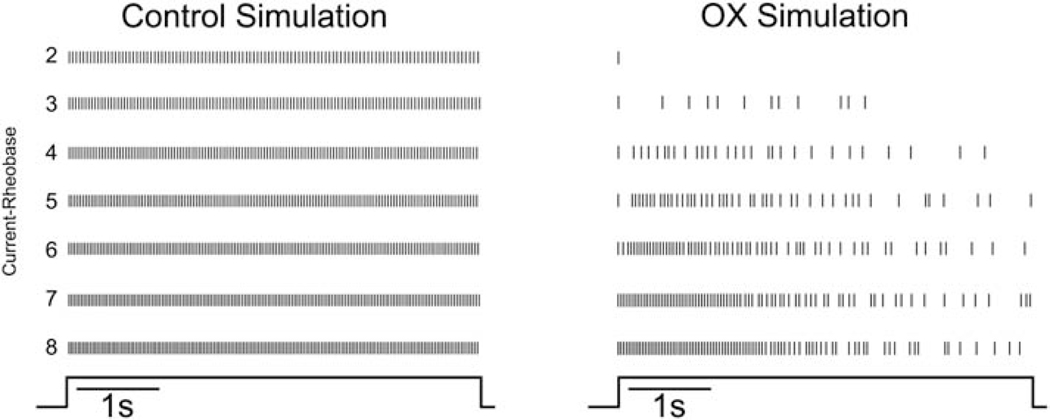
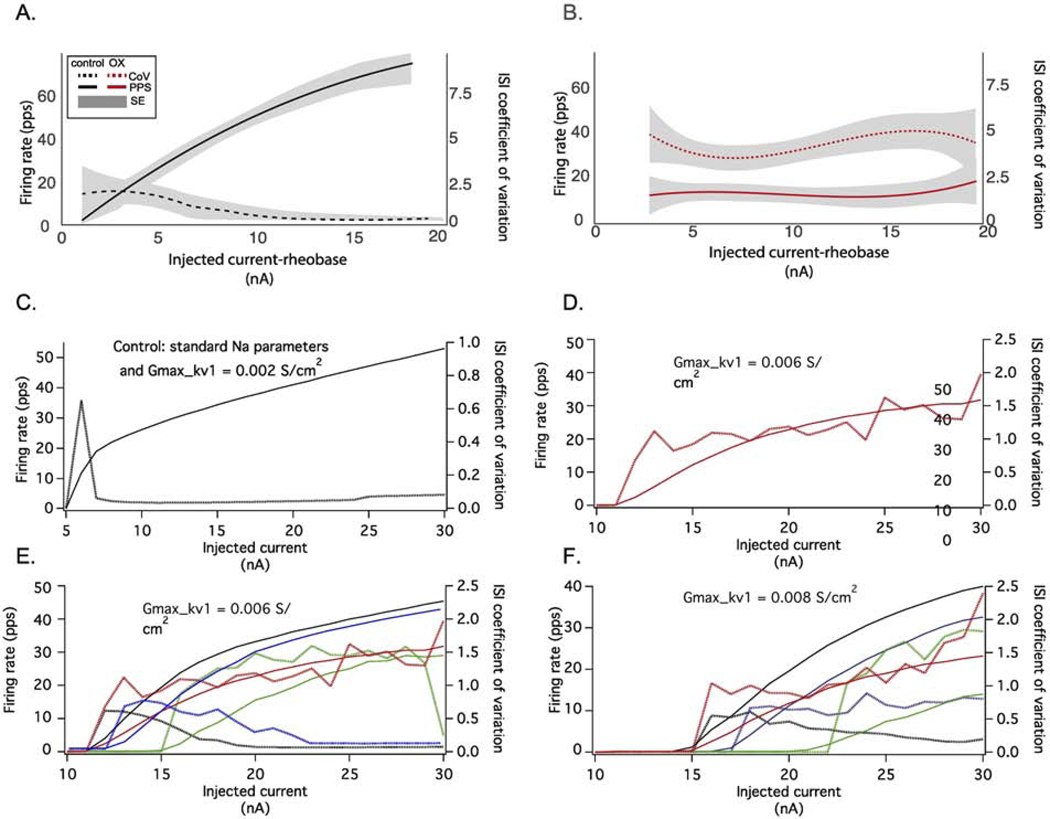
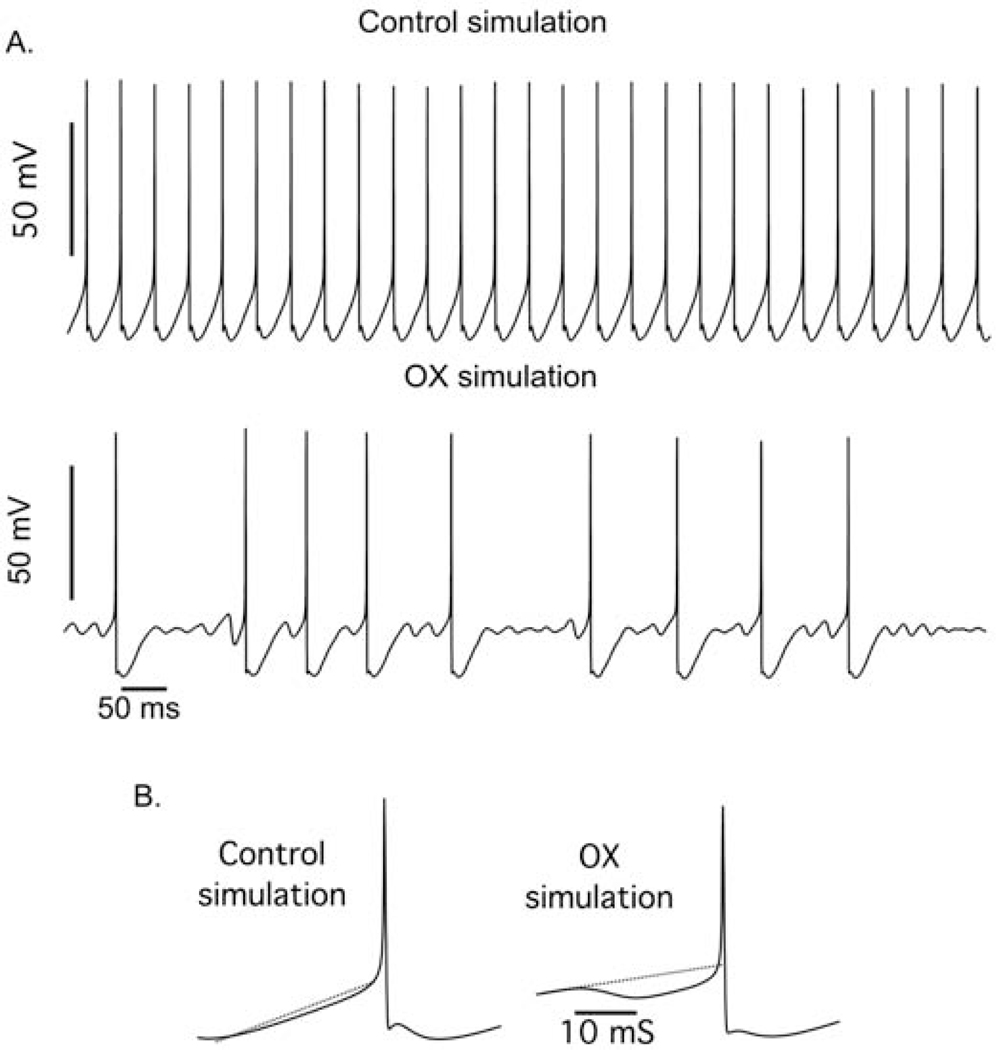
Chemotherapy-induced sensorimotor disabilities, including gait and balance disorders, as well as physical fatigue often persist for months and sometimes years into disease free survival from cancer. While associated with impaired sensory function, chronic sensorimotor disorders might also depend on chemotherapy-induced defects in other neuron types. In this report, we extend consideration to motoneurons, which, if chronically impaired, would necessarily degrade movement behavior. The present study was undertaken to determine whether motoneurons qualify as candidate contributors to chronic sensorimotor disability independently from sensory impairment. We tested this possibility in vivo from rats 5 weeks following human-scaled treatment with one of the platinum-based compounds, oxaliplatin, widely used in chemotherapy for a variety of cancers. Action potential firing of spinal motoneurons responding to different fixed levels of electrode-current injection was measured in order to assess the neurons' intrinsic capacity for stimulus encoding. The encoding of stimulus duration and intensity corroborated in untreated control rats was severely degraded in oxaliplatin treated rats, in which motoneurons invariably exhibited erratic firing that was unsustained, unpredictable from one stimulus trial to the next, and unresponsive to changes in current strength. Direct measurements of interspike oscillations in membrane voltage combined with computer modeling pointed to aberrations in subthreshold conductances as a plausible contributor to impaired firing behavior. These findings authenticate impaired spike encoding as a candidate contributor to, in the case of motoneurons, deficits in mobility and fatigue. Aberrant firing also becomes a deficit worthy of testing in other CNS neurons as a potential contributor to perceptual and cognitive disorders induced by chemotherapy in patients.

Keywords: CNS; Central nervous system; Chemotherapy; Computer modeling; Encoding; Firing behavior; Impaired excitability; Motoneurons; Rate-modulation; Subthreshold oscillations.


Figures

Figure 1.
Figure 1.. In Silico Motoneuron Model.
(A) Shows the ten-state model Na channel model. The green vertical arrows represent transitions to fast-inactivated states, whereas the red horizontal arrows represent transitions to slow-inactivated states. IFT represents the total occupancy of all fast-inactivated states whereas IST represents that of the slow-inactivated states. Shows the steady-state occupancy of the open (B), fast-activated (C) and slow-inactivated states (D) as a function of membrane voltage. The black lines represent the features of the standard model, the blue and green lines represent changes in fast-inactivation process produced by hyperpolarizing the fast-inactivation voltage-dependence by either 5 (blue) or 10 mV (green). The red lines represent changes in state occupancy produced by doubling the rate at which slow-inactivated states are entered. Note that the steady-state persistent Na current (open state occupancy) is nearly identical for the 10mV shift in fast-inactivation and for the faster entry into the slow-inactivated states. However, this state-state is reached at different rates in the two cases.
Figure 2.
Figure 2.. Chemotherapy Disrupted Repetitive Firing of Motoneurons.
(A) Records show representative instantaneous firing rates (filled black circles: pulses per second (pps)) superimposed on APs (grey lines: mV) recorded intracellularly from motoneurons acquired in a rat after 5 weeks after clinically relevant chemotherapy treatment (middle) and from a control rat (top) in response to matched depolarizing current injection (bottom trace: nA). Box and whisker plots compare (B) the total number of APs, (C) mean firing rate and (D) coefficient of variation in firing rate recorded for across all trials of 5 second depolarizing current injection in each treatment group. * indicates statistically significant differences between experimental groups as empirically derived from hierarchical Bayesian model (stan_glm): 95% highest density intervals do not overlap between groupwise contrasts.
Figure 3.
Figure 3.. Firing disrupted at All Current Strengths.
Raster plots from representative control and OX motoneurons show firing responses to 5 sec trials of 5 sec current clamp (bottom trace). Vertical lines represent the timing of APs as they occur during each of the 5s trials aligned in rows of increasing depolarizing current from 4 to 14 nA above rheobase (current-rheobase). Selected motoneurons had comparable rheobases (control 10nA and OX 9nA).
Figure 4.
Figure 4.. Firing Rate Modulation Nearly Eliminated.
(A and C) Two-dimensional plots (left) shows the population of control (A, n = 6) and chemotherapy (C, n = 8) motoneuron’s capacity to modulate firing rate (frequency-current relationship: F-I) in response to varying levels of depolarizing current above rheobase (current-rheobase). Three-dimensional plot (right) highlights the density distribution of raw data across all injected currents levels. Narrowing topographical lines in B and D and hotter colors in A and C indicate higher density and correspond to higher peak values in plot to right. B and D show F-I plots from individual motoneurons comprising control and chemotherapy plots in A and C respectively.
Figure 5.
Figure 5.. AP dV/dt not Predictive of Firing Cessation and Resumption.
(A and B) Instantaneous firing rate (filled black circles: pulses per second (pps)) superimposed on APs (grey lines: mV) recorded from (A) control and (E) OX motoneurons during current clamp. (C and D) Scatter plots of dv/dt extracted from all APs illustrated in records A and B, respectively. Insets show time-expanded APs superimposed and identified by black, dotted and grey lines corresponding to their positions during repetitive firing indicated, respectively, as black, open, and grey arrows in (A,B and C,D). (E and F) Traces of firing rate (grey lines relative to left y axis) and dV/dt (black lines relative to right y axis) for 6 trials each of increasing current (3–8 nA above rheobase current bottom traces on x axis) for (E) one control and (F) one OX motoneuron.
Figure 6.
Figure 6.. Subthreshold Membrane Potential Oscillations.
(A). Shows representative intracellular records of membrane potential for control (top: grey) and OX (bottom: red) motoneurons in response to matched depolarizing current injection. In record from OX motoneuron, dotted boxes outline prominent subthreshold oscillations and arrows point to hyperpolarization immediately preceding AP, designated pre-spike hyperpolarization. (B) Spike-triggered averages of membrane potential preceding all APs in current-matched trials control and OX motoneurons illustrating pre-spike hyperpolarization. (C) shows the observed (top) and predicted (middle) voltage slopes for the 15ms preceding AP threshold along with the average amplitude in pre-AP hyperpolarization (bottom).
Figure 7.
Figure 7.. Modulation of Subthreshold Kinetics Reproduces Erratic Firing.
Raster plots from simulated control and simulated OX motoneurons show firing responses to depolarizing current that are analogous to experimentally observed data in Fig. 4. Vertical lines represent the timing of action potentials as they occur during each of the 5s trials. Each horizontal trace represents a single 5s trial as the depolarizing current is increased from 2 to 8nA above rheobase (current-rheobase). Control motoneuron firing behavior was modeled with both a high level of NaPIC and a low level of Kv1 (0.002 S/cm2, bottom panel). OX motoneuron firing was modelled by altering the level of Kv1 (0.006 S/cm2) and lowering NaPIC. In this case, the decrease in NaPIC resulted from increased slow Na inactivation and exhibited a stuttering firing pattern over a large range, from just a few nA above rheobase (I-rheobase = 9 nA) up to 21 nA above rheobase (the highest current level tested).
Figure 8.
Figure 8.. Erratic Firing in Conductance Parameter Space.
A and B show the average firing rates produced by a 5 sec injected current step (solid lines) along with the coefficient of variation (CoV) of the interspike intervals (ISI: dotted lines) for different levels of injected current for experimentally observed control (A) and OX data (B). (C) Control motoneuron firing behavior was modeled with both a high level of Na current and a low level of Kv1 (0.002 S/cm2). (D) OX motoneuron firing was modelled by increasing the level of Kv1 (0.006 S/cm2) and the amount of slow inactivation. In this case, the model had increased slow inactivation and exhibited a stuttering firing pattern of a large range, from just a few nA above rheobase (I-rheobase = 9 nA) up to 21 nA above rheobase (the highest current level tested) and qualitatively matched experimentally observed trends, although rate modulation was blunted but largely preserved. E and F show the relationship between CoV and firing rate over two fixed levels of Kv1 0.006 S/cm2 (E) and 0.008 S/cm2, and for different levels of NaPIC: the standard level (black), decreased due to a 5 mV or 10 mV shift in fast inactivation (blue and green), and increased due to an increase in slow Na inactivation. In all model configurations, the firing rate increased monotonically with the level of injected current, in contrast to the experimental data (B).
Figure 9.
Figure 9.. Modeling Subthreshold Oscillations and Pre-Spike Hyperpolarization.
(A). Intracellular voltage records from a simulated control and OX motoneuron. (B) Spike-triggered average (STA) from entire 5s current injection trial shows the average membrane voltage (mV) immediately preceding spiking for the control and OX simulation.

References

    1. Park SB et al. Long-term neuropathy after oxaliplatin treatment: challenging the dictum of reversibility. Oncologist 16, 708–716 (2011). - PMC - PubMed
    1. Bennett BK et al. Impact of oxaliplatin-induced neuropathy: a patient perspective. Supportive Care in Cancer 20, 2959–2967 (2012). - PubMed
    1. Tofthagen C, Donovan KA, Morgan MA, Shibata D. & Yeh Y. Oxaliplatin-induced peripheral neuropathy’s effects on health-related quality of life of colorectal cancer survivors. Supportive Care in Cancer 21, 3307–3313 (2013). - PMC - PubMed
    1. Vardy J. et al. Fatigue in people with localized colorectal cancer who do and do not receive chemotherapy: a longitudinal prospective study. Annals of Oncology 27, 1761–1767 (2016). - PMC - PubMed
    1. Marshall TF, Zipp GP, Battaglia F, Moss R. & Bryan S. Chemotherapy-induced-peripheral neuropathy, gait and fall risk in older adults following cancer treatment. Journal of Cancer Research and Practice (2017).

Publication types