. 2020 Oct 15:220:116991.
doi: 10.1016/j.neuroimage.2020.116991. Epub 2020 Jun 5.

Inferior temporal tau is associated with accelerated prospective cortical thinning in clinically normal older adults

Affiliations

Inferior temporal tau is associated with accelerated prospective cortical thinning in clinically normal older adults

Matthew R Scott et al. Neuroimage. .

Abstract

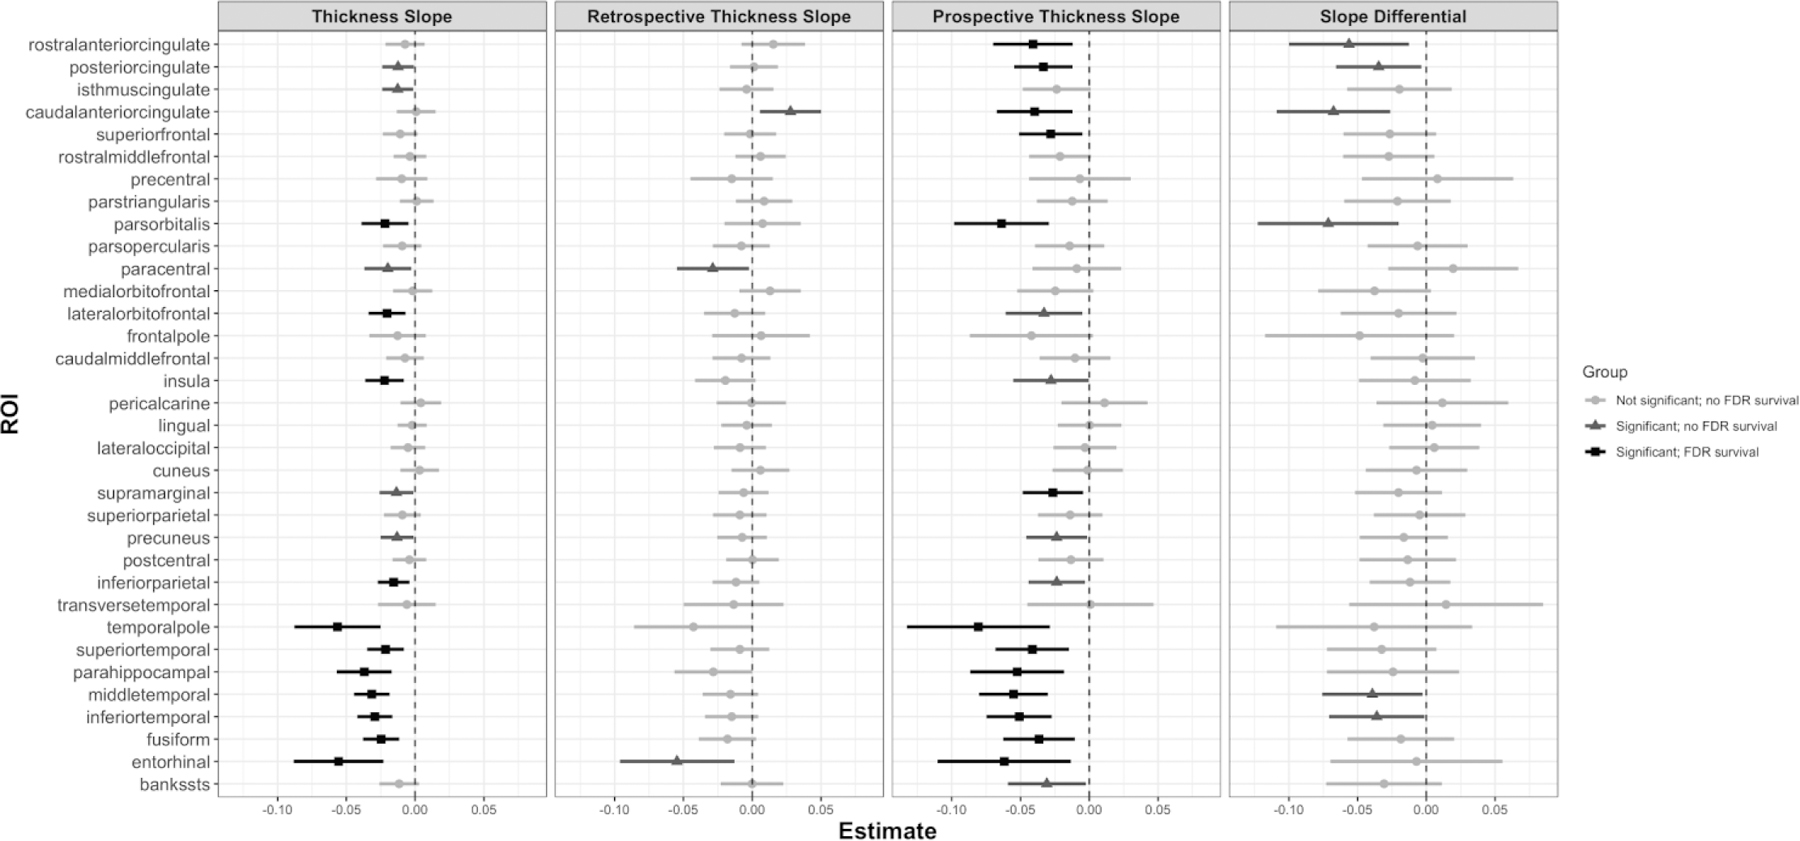
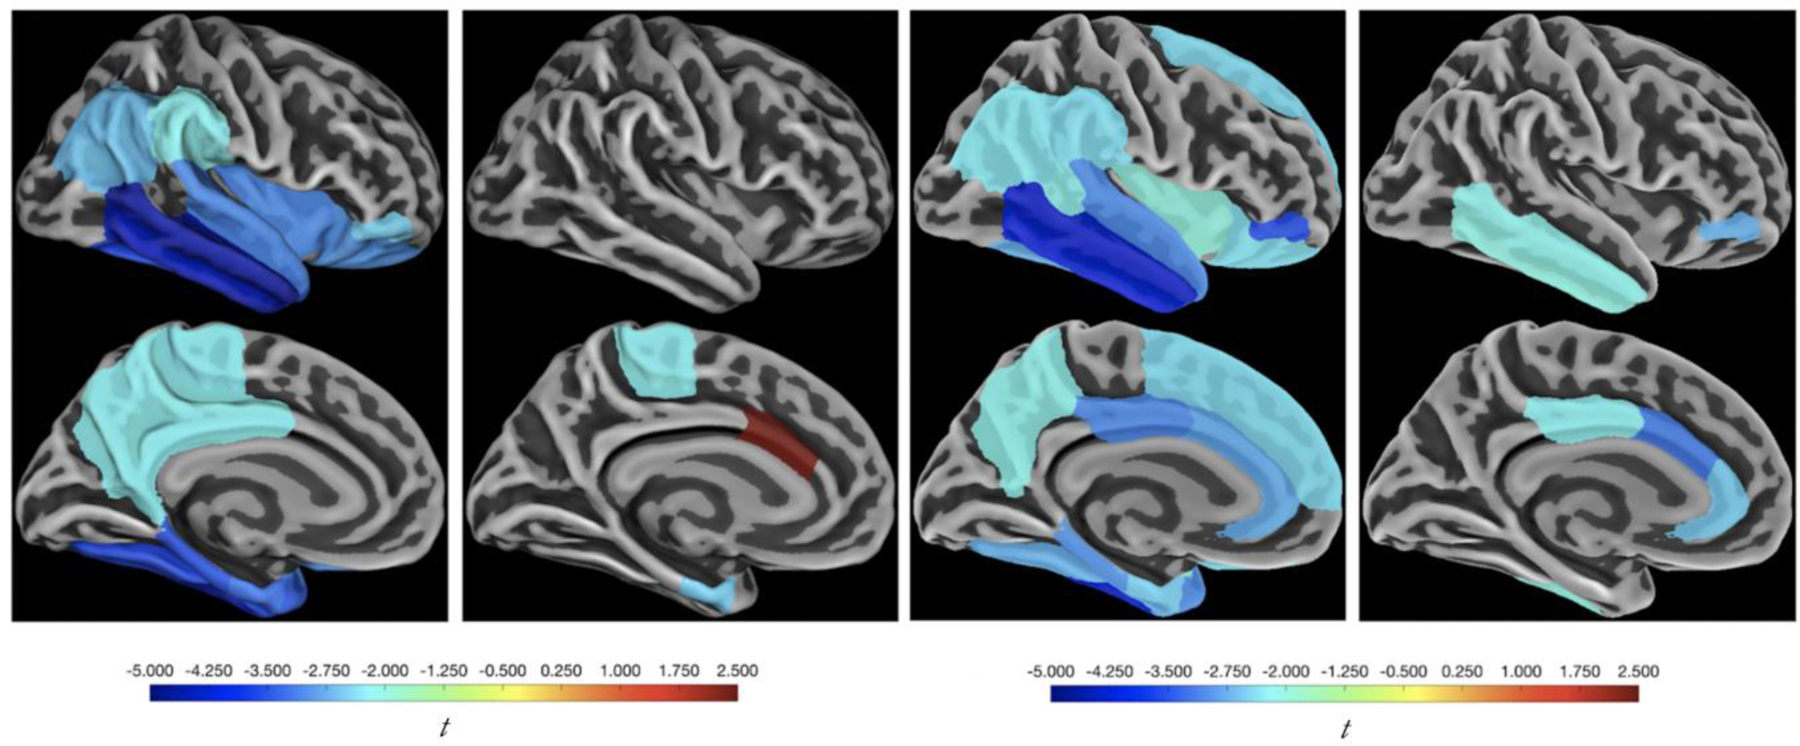
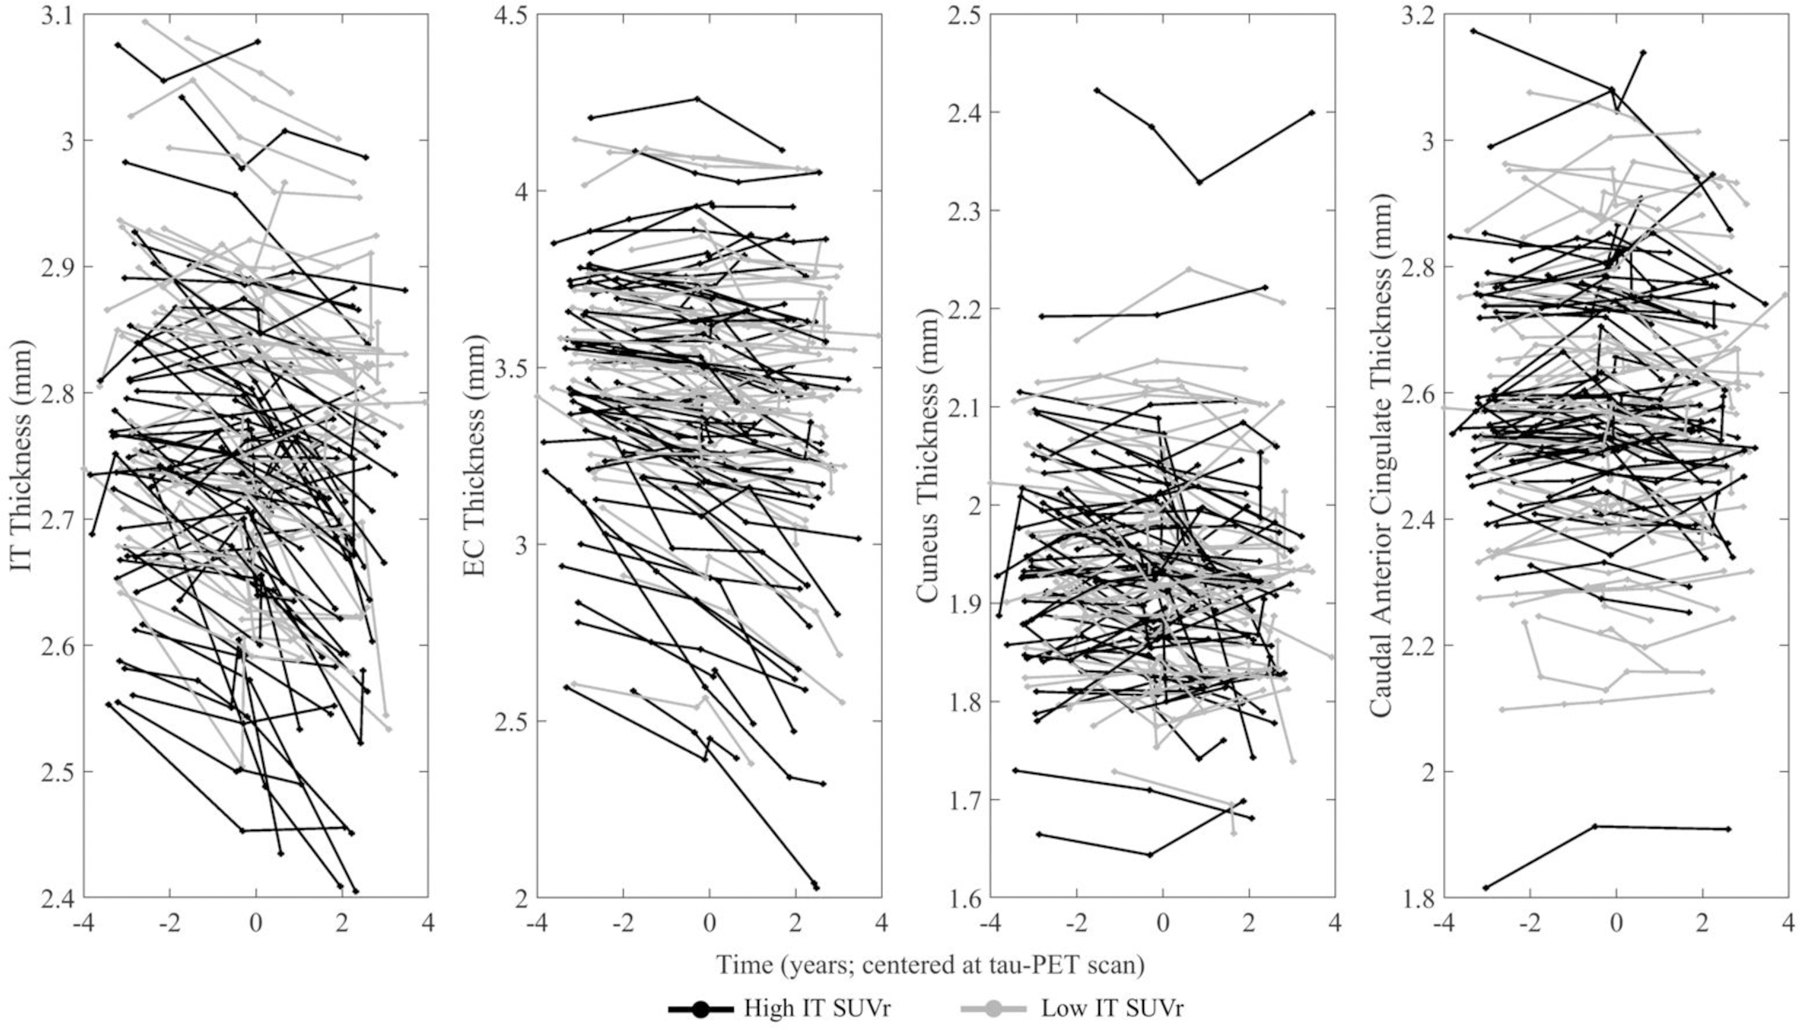
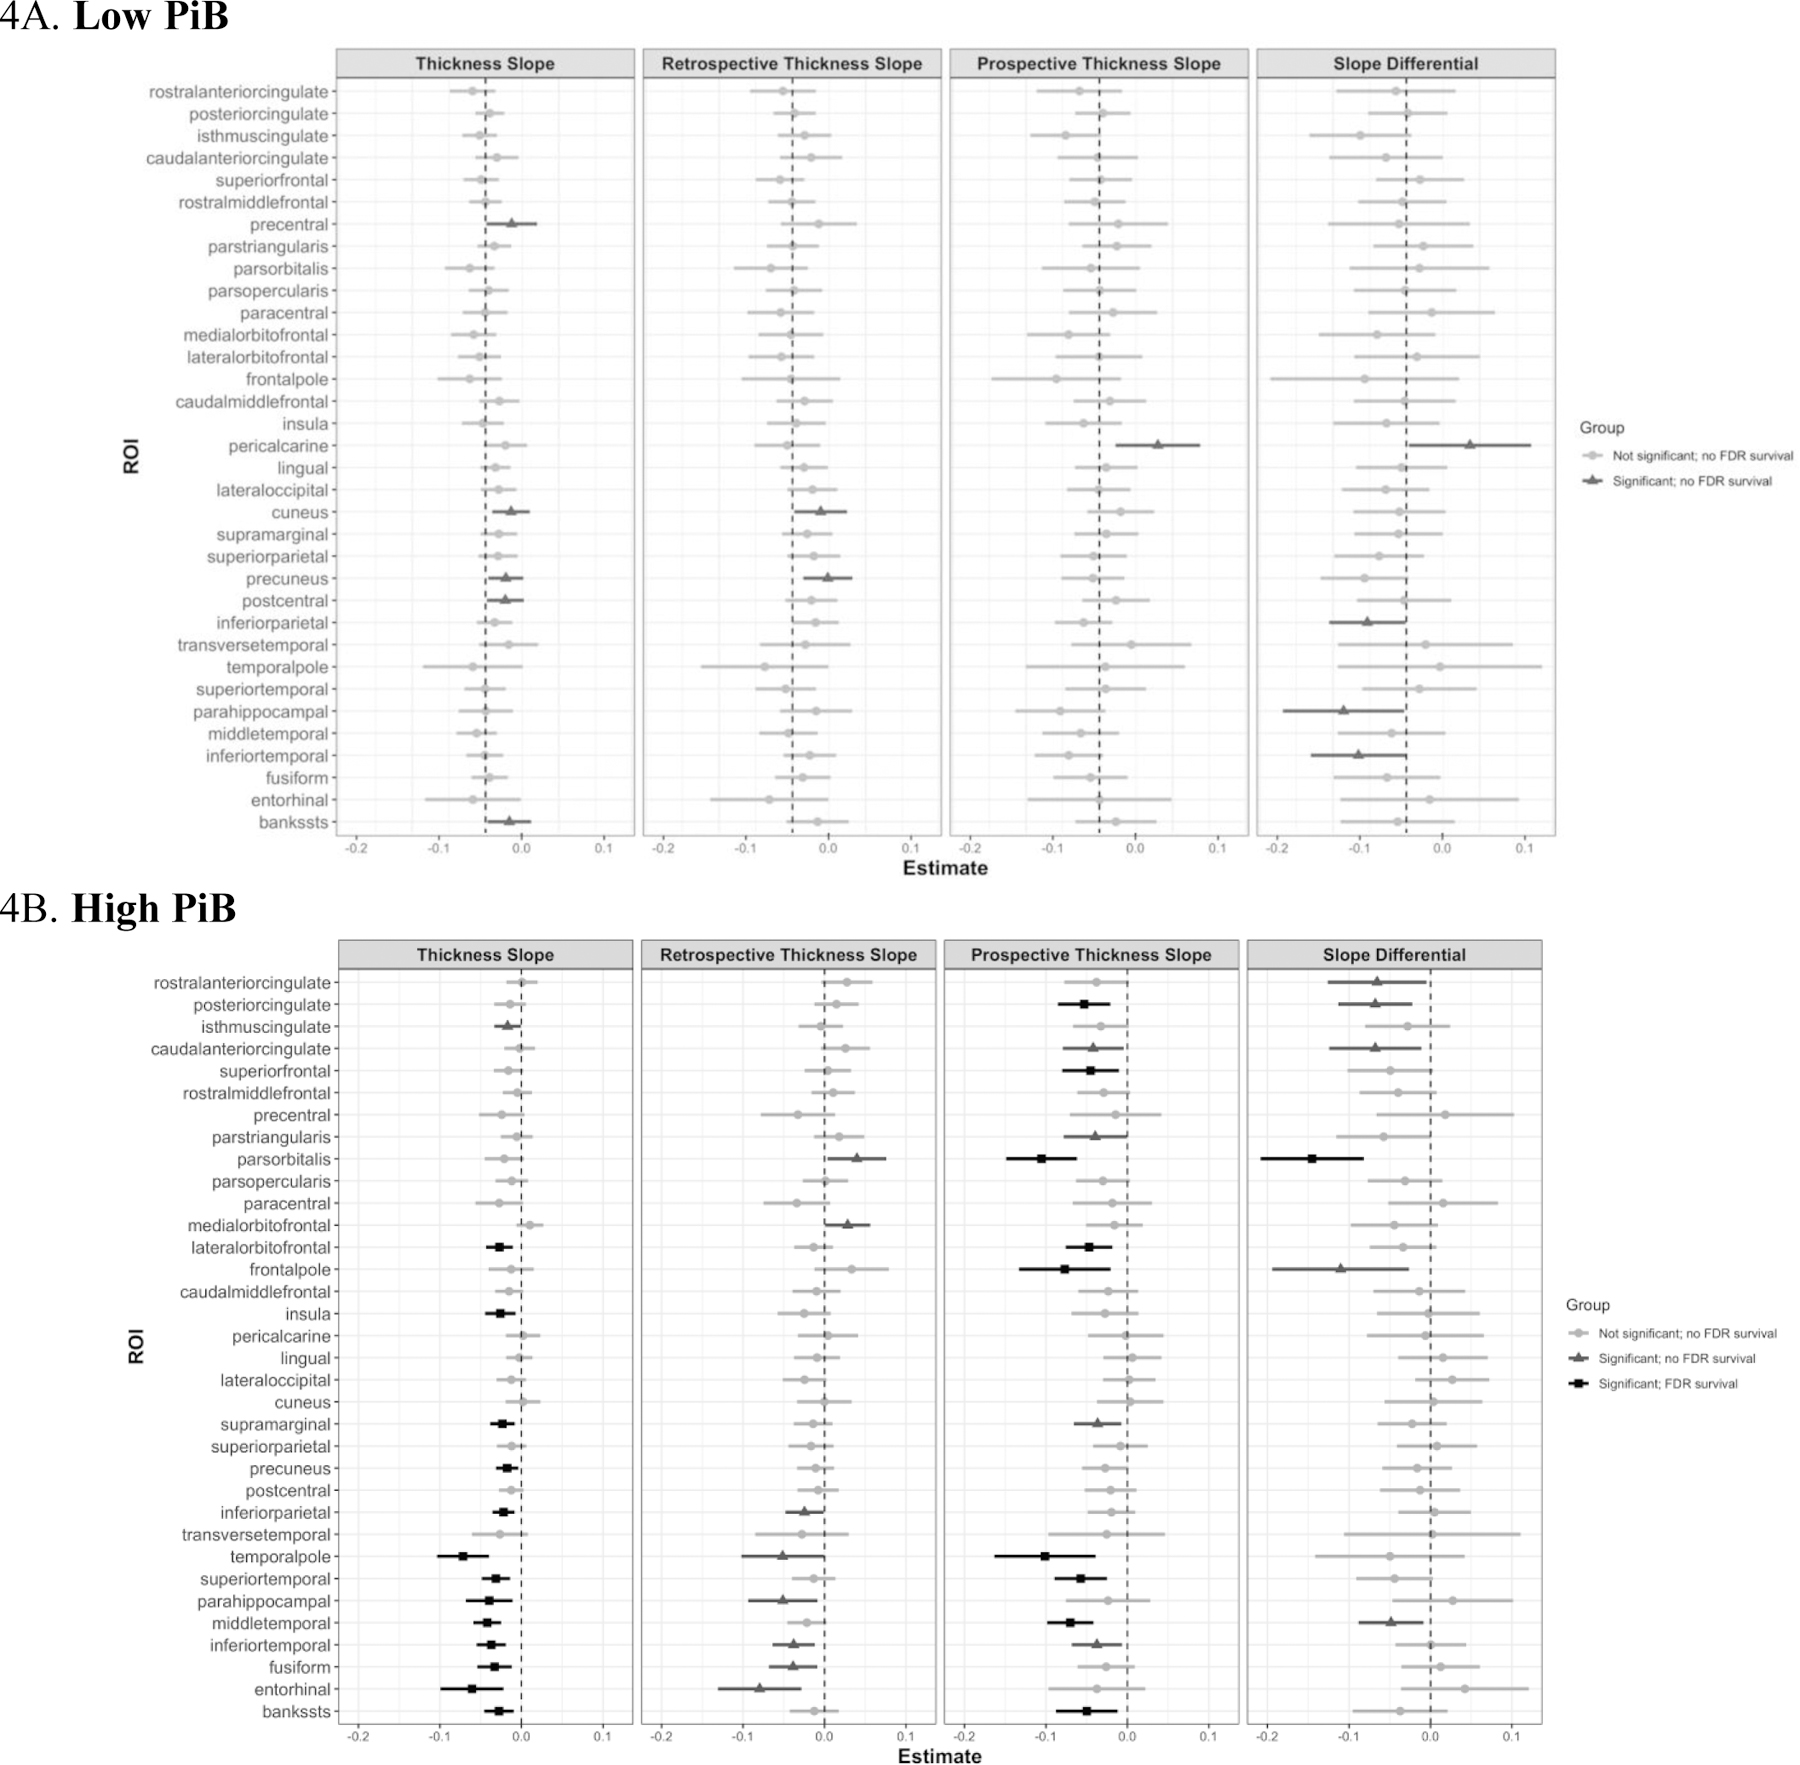
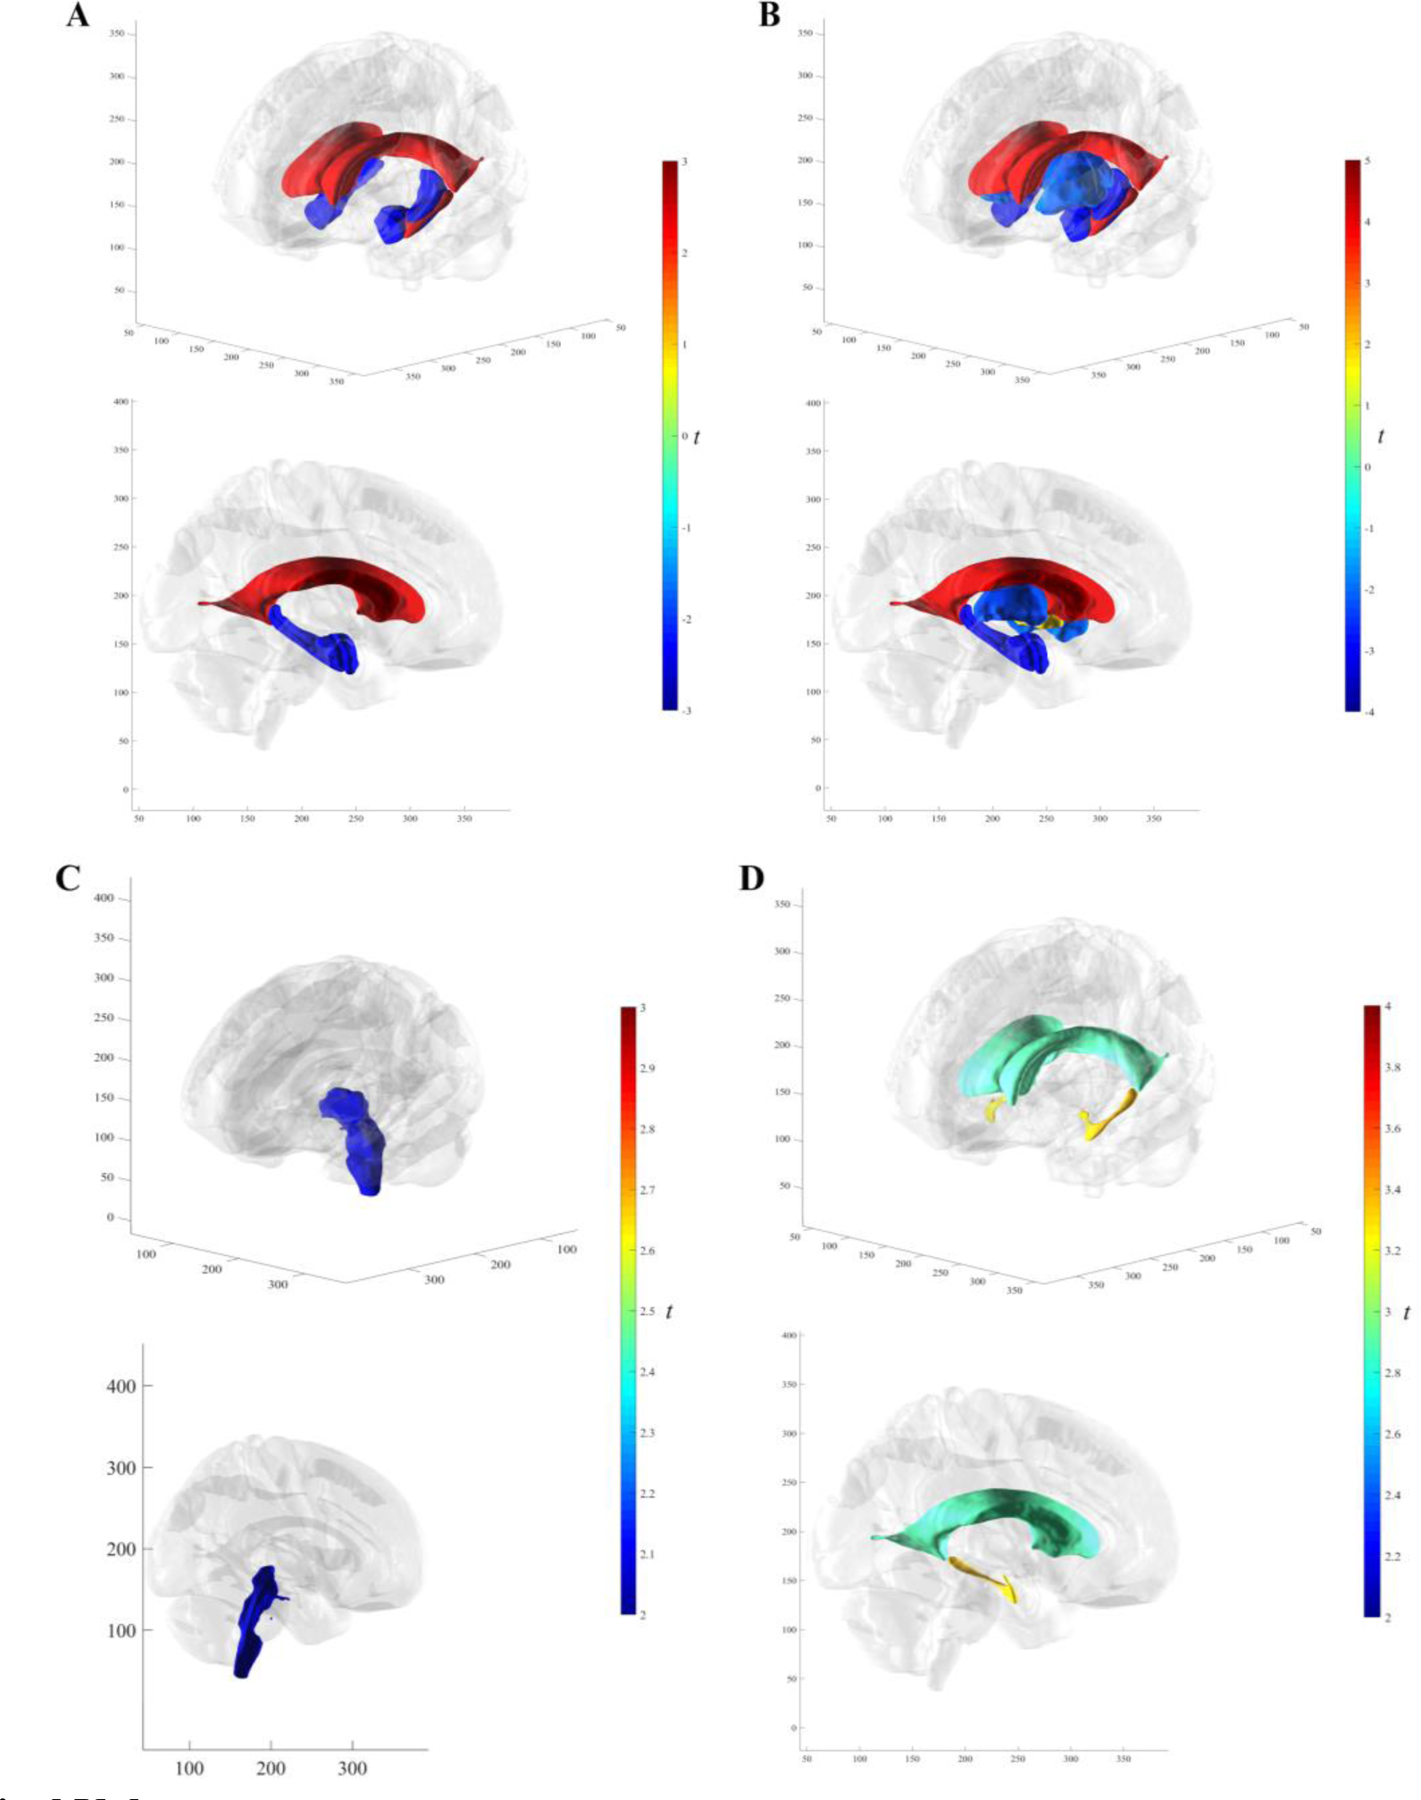
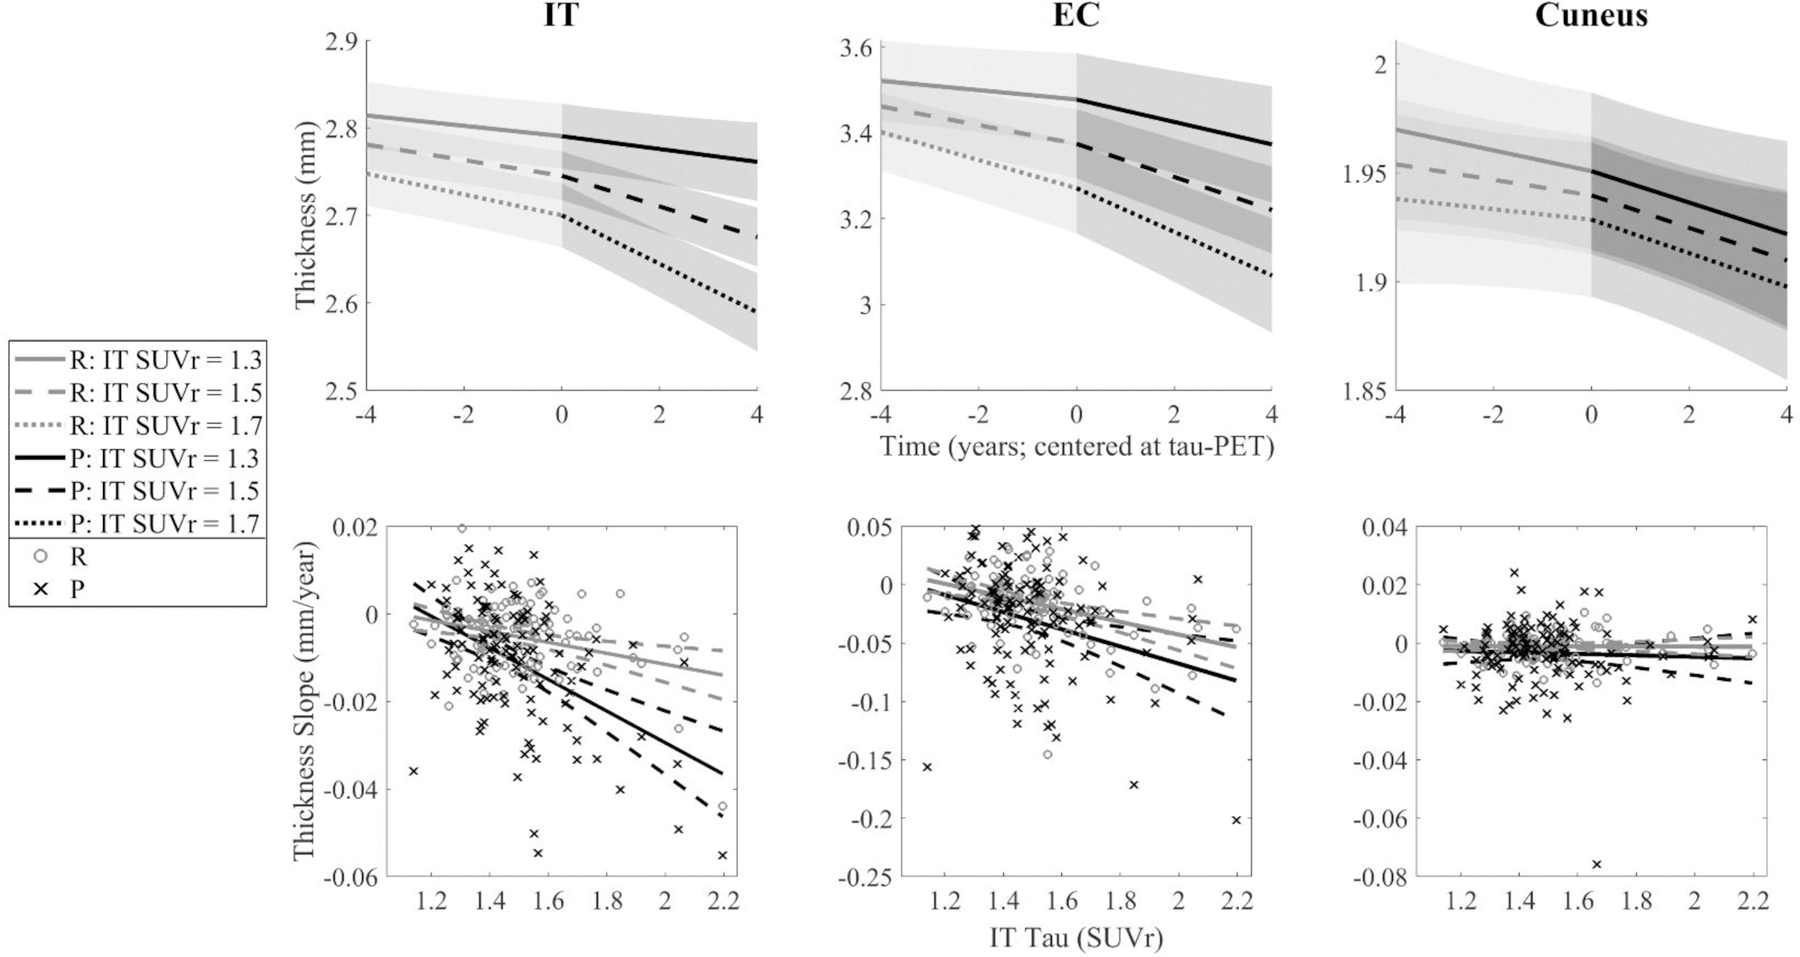
Neurofibrillary tau tangles are a hallmark pathology of Alzheimer's disease (AD) and are more closely associated with AD-related cortical atrophy and symptom severity than amyloid-beta (Aβ). However, studies regarding the effect of tau on longitudinal cortical thinning, particularly in healthy aging and preclinical AD, have been limited in number due to the relatively recent introduction of in vivo PET tracers for imaging tau pathology. Here, we investigate [18F]-flortaucipir (FTP, a marker of paired helical filament tau) PET as a predictor of atrophy in healthy aging and preclinical AD. We examine longitudinal structural MRI brain imaging data, retrospectively and prospectively relative to FTP imaging, using piecewise linear mixed-effect models with time centered at each participant's FTP-PET session. Participants include 111 individuals from the Harvard Aging Brain Study who underwent at least three MRI sessions over an average of 4.46 years and one FTP-PET at the approximate midpoint of the observation period. Our primary analyses focus on inferior temporal (IT) FTP standardized uptake value ratios and longitudinal FreeSurfer defined cortical regions of interest. Relationships were also explored using other regional FTP measures (entorhinal, composite, and local), within high and low Pittsburgh compound-B (PiB) PET groups, and with longitudinal subcortical volume. Strong associations between IT FTP and cortical thinning were found, most notably in temporal, midline, and prefrontal regions, with stronger effects generally observed in the prospective as compared to retrospective time frame. Significant differences between prospective and retrospective rates of thinning were found in the inferior and middle temporal gyri, cingulate areas, as well as pars orbitalis such that higher IT FTP was associated with greater prospective rates of thinning. Within the high PiB group, significant differences between prospective and retrospective rates of thinning were similarly observed. However, no consistent pattern of tau-related change in cortical thickness within the low PiB group was discerned. These results provide support for the hypothesis that tau pathology is a driver of future atrophy as well as provide additional evidence for tau-PET as an effective AD biomarker for interventional clinical trials.

Keywords: Alzheimer's disease; Cortical thinning; Flortaucipir; Imaging; Longitudinal modeling; MRI; PET; Tau.


Conflict of interest statement

Declaration of competing interest Dr. Schultz has received grants from the National Institute on Aging and served on paid advisory boards for Janssen Pharmaceuticals (2013) and Biogen (2016). Dr. Hanseeuw is funded by the Belgian National Fund for Scientific Research (FNRS) #SPD28094292. Dr. Jacobs reported funding from the European Union's Horizon 2020 Research and Innovation Programme under the Marie Sklodowska-Curie Grant agreement (IF-2015-GF, 706714). Dr. Johnson has served as a paid consultant for Bayer, GE Healthcare, Janssen, Siemens Medical Solutions, Genzyme, Novartis, Biogen, Roche, AZTherapy, GEHC, Lundbeck, Genentech, Lilly/Avid, AC Immune, and Abbvie. Dr. Sperling has received grants from National Institute on Aging, Alzheimer's Association, Eli Lilly and Co., and Janssen Pharmaceuticals. She has consulted for AC Immune, Eisai, Janssen, Roche, and Takeda. There are no other conflicts of interest to be reported.

Figures

Fig. 1
Fig. 1. IT FTP Effects
Forest plots for IT FTP analyses with lines centered at their respective unstandardized estimate with 95% confidence intervals. Thickness Slope) IT FTP ✕ Time effect in Model 1, over the full observation period. Retrospective Thickness Slope) IT FTP:Time:G1 effect in Model 2B. Prospective Thickness Slope) IT FTP:Time:G2 effect in Model 2B. Slope Differential) IT FTP:Time:G effect in Model 2A, showing a comparison of retrospective versus prospective thickness slopes. Light gray indicates no significant effect, mild gray indicates a significant effect but no FDR survival, and black represents a significant effect with FDR survival. Abbreviations: FTP = flortaucipir; IT = inferior temporal gyrus; FDR = False Discovery Rate.
Fig. 2
Fig. 2. Brain Maps of IT FTP Analyses
T-statistics from the effect of IT FTP on (left most) thickness over the full observation period, (left middle) retrospective thickness, (right middle) prospective thickness, and (right most) difference between retrospective and prospective thickness slopes are modeled as stated in Fig. 1 and Table 2. Only significant ROIs are shown, but they are not corrected for multiple comparisons. Bilateral measures were used for both SUVr and thickness. Abbreviations: FTP = flortaucipir; IT = inferior temporal gyrus; SUVr = standard uptake value ratios.
Fig. 3
Fig. 3. Cortical Thickness Spaghetti Plots by High and Low IT FTP
IT FTP is stratified by a median IT SUVr of 1.46 (black = greater than 1.46, gray = less than or equal to 1.46) and longitudinal thickness data for all 111 participants are presented in the (left most) IT, (left middle) EC, (right middle) cuneus, (right most) caudal anterior cingulate. Data are centered at the tau-PET scan. Cuneus models were run with and without the uppermost individual shown, and no significant changes were found within full sample as well as amyloid group analyses. Abbreviations: IT = inferior temporal gyrus; EC = entorhinal cortex; SUVr = standardized uptake value ratio; FTP = flortaucipir.
Fig. 4.
Fig. 4.. IT FTP Effects in Low and High PiB Groups
Forest plots of LME estimates for all ROIs are shown, with the sample stratified by PiB group. Bars are centered at their respective beta estimate (unstandardized) with 95% confidence intervals. Moreover, light gray indicates no significant effect, mild gray indicates a significant effect but no FDR survival, and black represents a significant effect with FDR survival. Abbreviations: FTP = flortaucipir; IT = inferior temporal gyrus; EC = entorhinal cortex; PiB = Pittsburgh compound B; FDR = False Discovery Rate.
Fig. 5
Fig. 5. Subcortical Volume
3D brain renderings of significant (no FDR correction) IT SUVr t-statistics. In order of increasing magnitude (A) Subcortical volume over the full follow-up range in the hippocampus, lateral ventricles, amygdala, and inferior lateral ventricles. (B) Prospective subcortical volume in the pallidum, putamen, thalamus proper, amygdala, hippocampus, lateral ventricles, and inferior lateral ventricles. (C) Retrospective subcortical volume in the brain stem. (D) Slope differences between retrospective and prospective thickness in the lateral and inferior lateral ventricles. Abbreviations: IT = inferior temporal gyrus; SUVr = standardized uptake value ratio; FTP = flortaucipir; FDR = False Discovery Rate.
Fig. 6
Fig. 6. The Influence of IT Tau on Cortical Thinning in Three Regions
(Top Row) IT, EC, and cuneus thinning are modeled at three levels of IT tau-PET (SUVr = 1.3, 1.5, and 1.7; median = 1.46) using estimates from Model 2A. (Bottom Row) Retrospective (gray o’s) and prospective (black x’s) thickness slopes are plotted against IT tau-PET signal. Slopes shown are representations of models analyzed, not direct reflections, as slopes were extracted by independent random effects of the equation: Thickness ~ 1 + (1|Participant) + (Time:Retrospective Indicator – 1|Participant) + (Time:Prospective Indicator – 1|Participant). Abbreviations: IT = inferior temporal gyrus; EC = entorhinal cortex; SUVr = standardized uptake value ratio; FTP = flortaucipir.

References

    1. Braak Heiko, and Braak Eva. “Frequency of Stages of Alzheimer-Related Lesions in Different Age Categories.” Neurobiology of Aging, vol. 18, no. 4, 1997, pp. 351–357., doi:10.1016/s0197-4580(97)00056-0. - DOI - PubMed
    1. Braak Heiko, and Braak Eva. “Neuropathological Stageing of Alzheimer-Related Changes.” Acta Neuropathologica, vol. 82, no. 4, 1991, pp. 239–259., doi:10.1007/bf00308809. - DOI - PubMed
    1. Braak Heiko, et al. “Staging of Alzheimer Disease-Associated Neurofibrillary Pathology Using Paraffin Sections and Immunocytochemistry.” Acta Neuropathologica, vol. 112, no. 4, 2006, pp. 389–404., doi:10.1007/s00401-006-0127-z. - DOI - PMC - PubMed
    1. Chan Dennis, et al. “Patterns of Temporal Lobe Atrophy in Semantic Dementia and Alzheimer’s Disease.” Annals of Neurology, vol. 49, no. 4, 2001, pp. 433–442., doi:10.1002/ana.92. - DOI - PubMed
    1. Dagley Alexander, et al. “Harvard Aging Brain Study: Dataset and Accessibility.” NeuroImage, vol. 144, 2017, pp. 255–258., doi:10.1016/j.neuroimage.2015.03.069. - DOI - PMC - PubMed

Publication types

MeSH terms