. 2020 Aug:142:104959.
doi: 10.1016/j.nbd.2020.104959. Epub 2020 Jun 6.

Disrupted inhibitory plasticity and homeostasis in Fragile X syndrome

Affiliations

Disrupted inhibitory plasticity and homeostasis in Fragile X syndrome

C A Cea-Del Rio et al. Neurobiol Dis. 2020 Aug.

Abstract

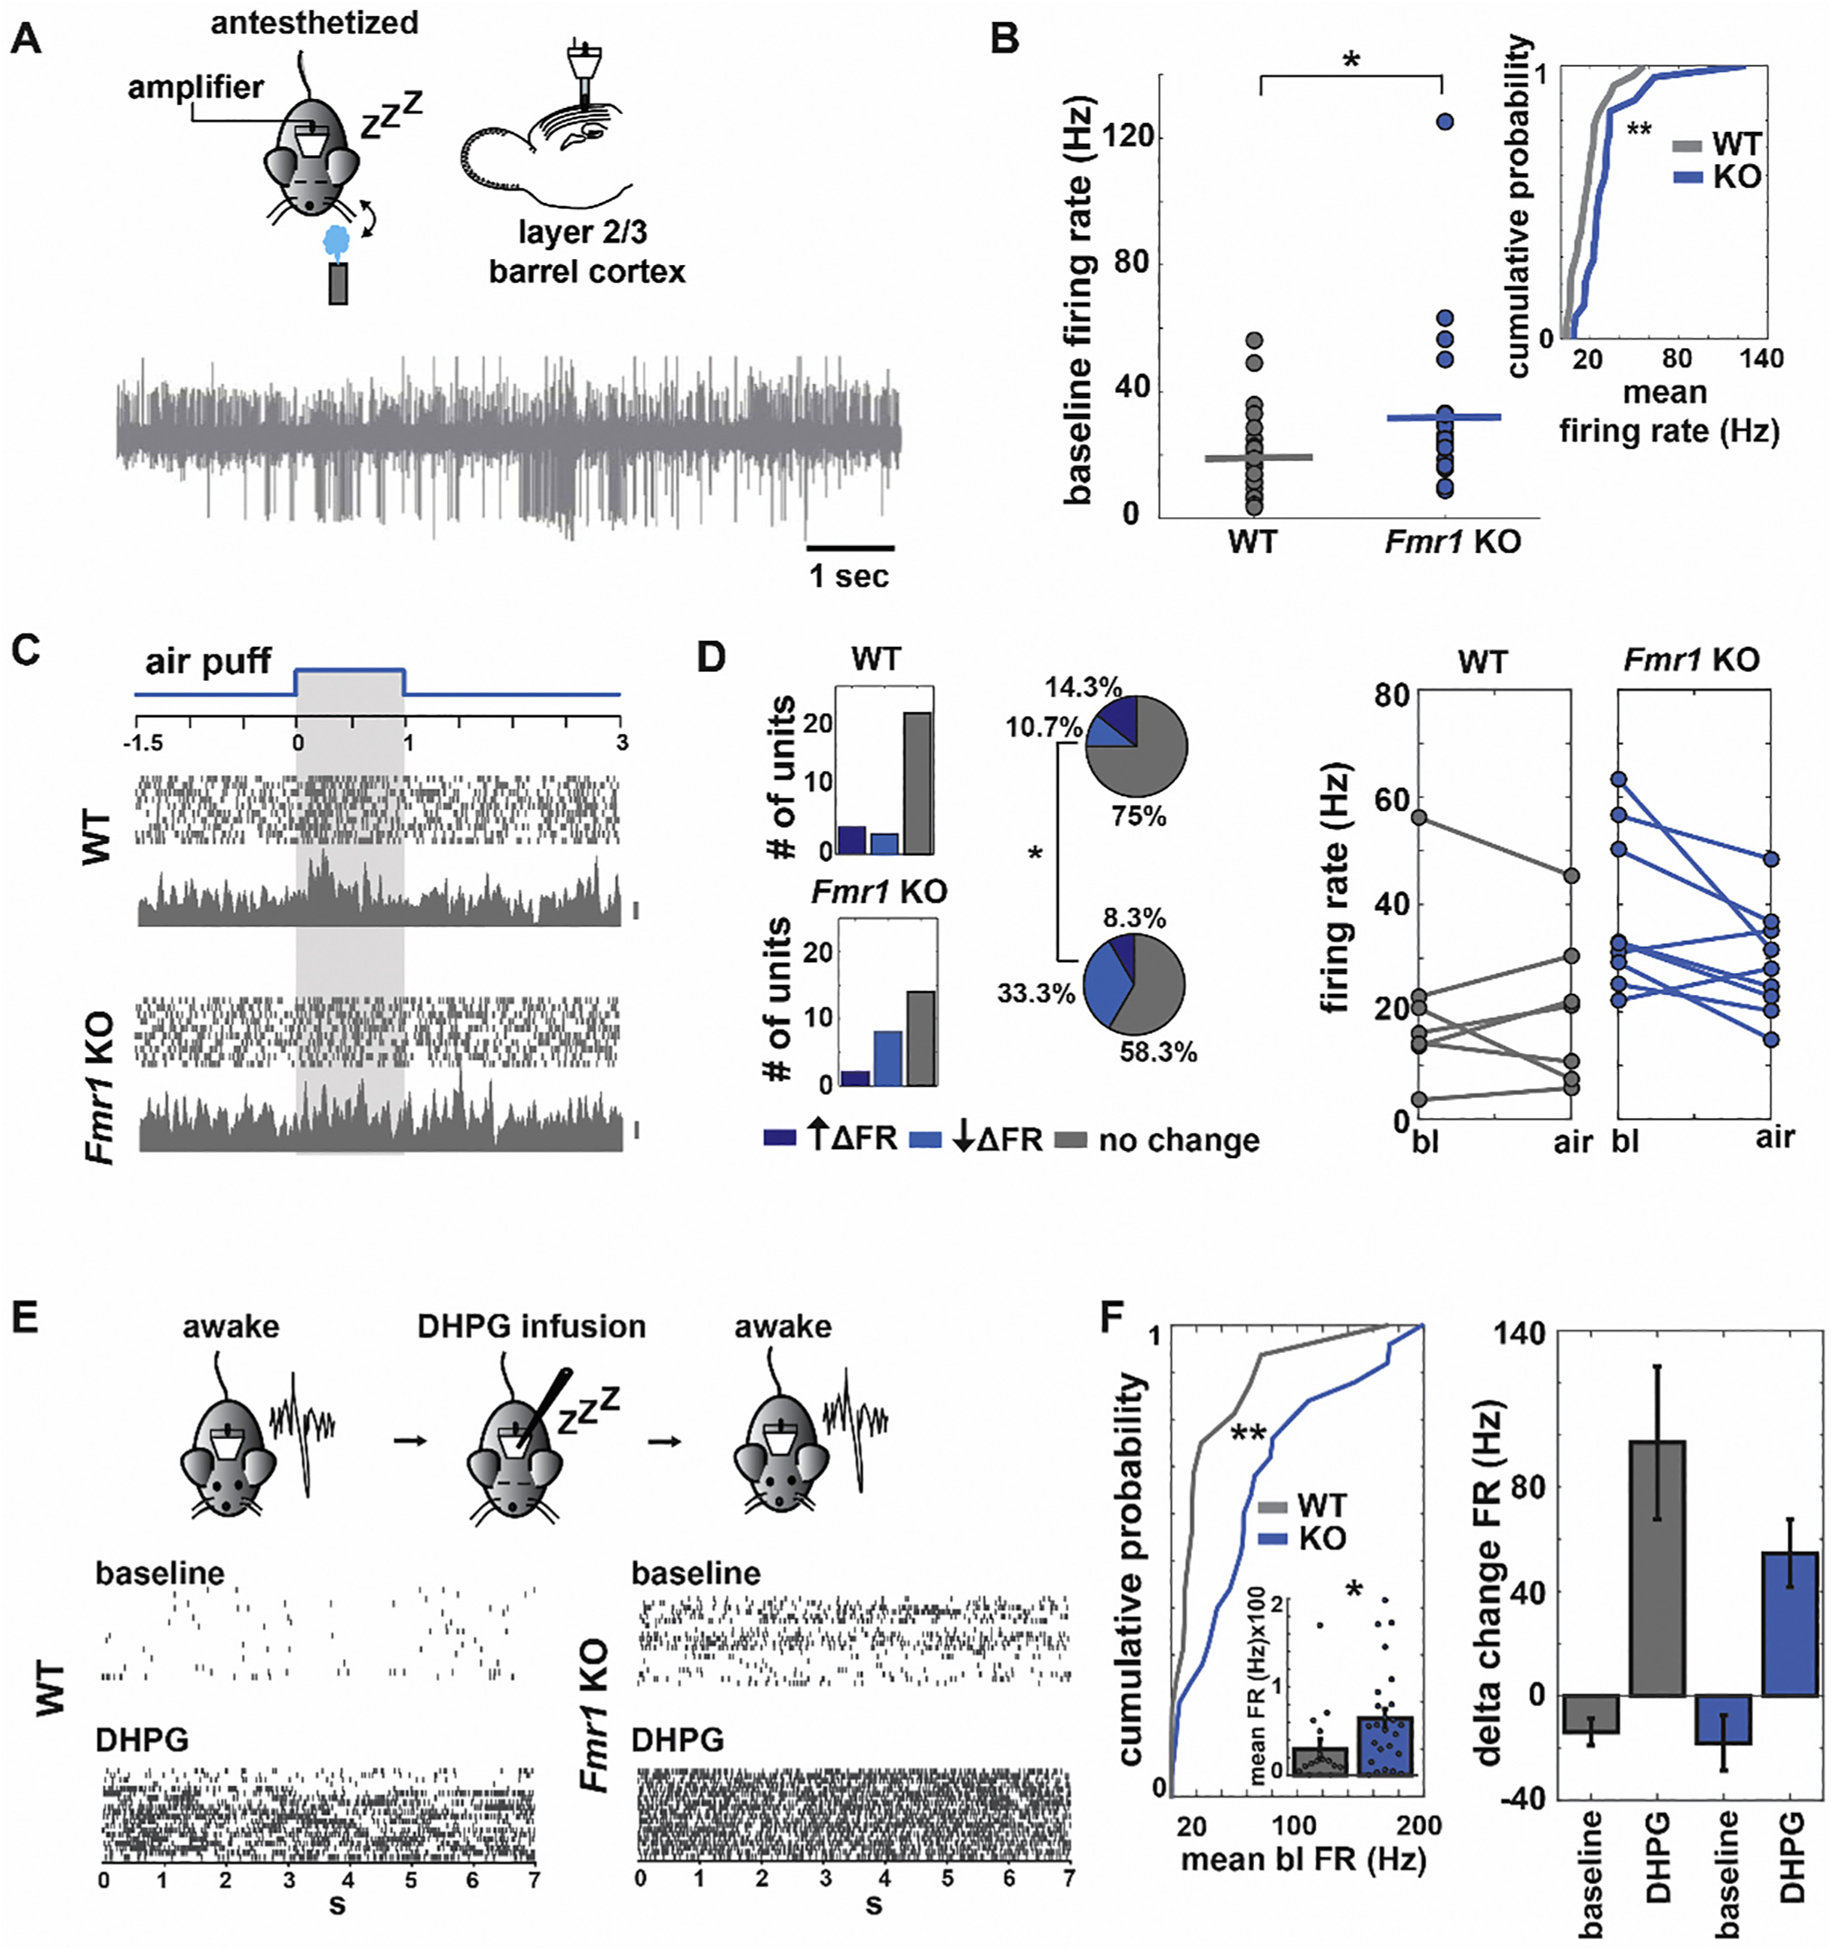
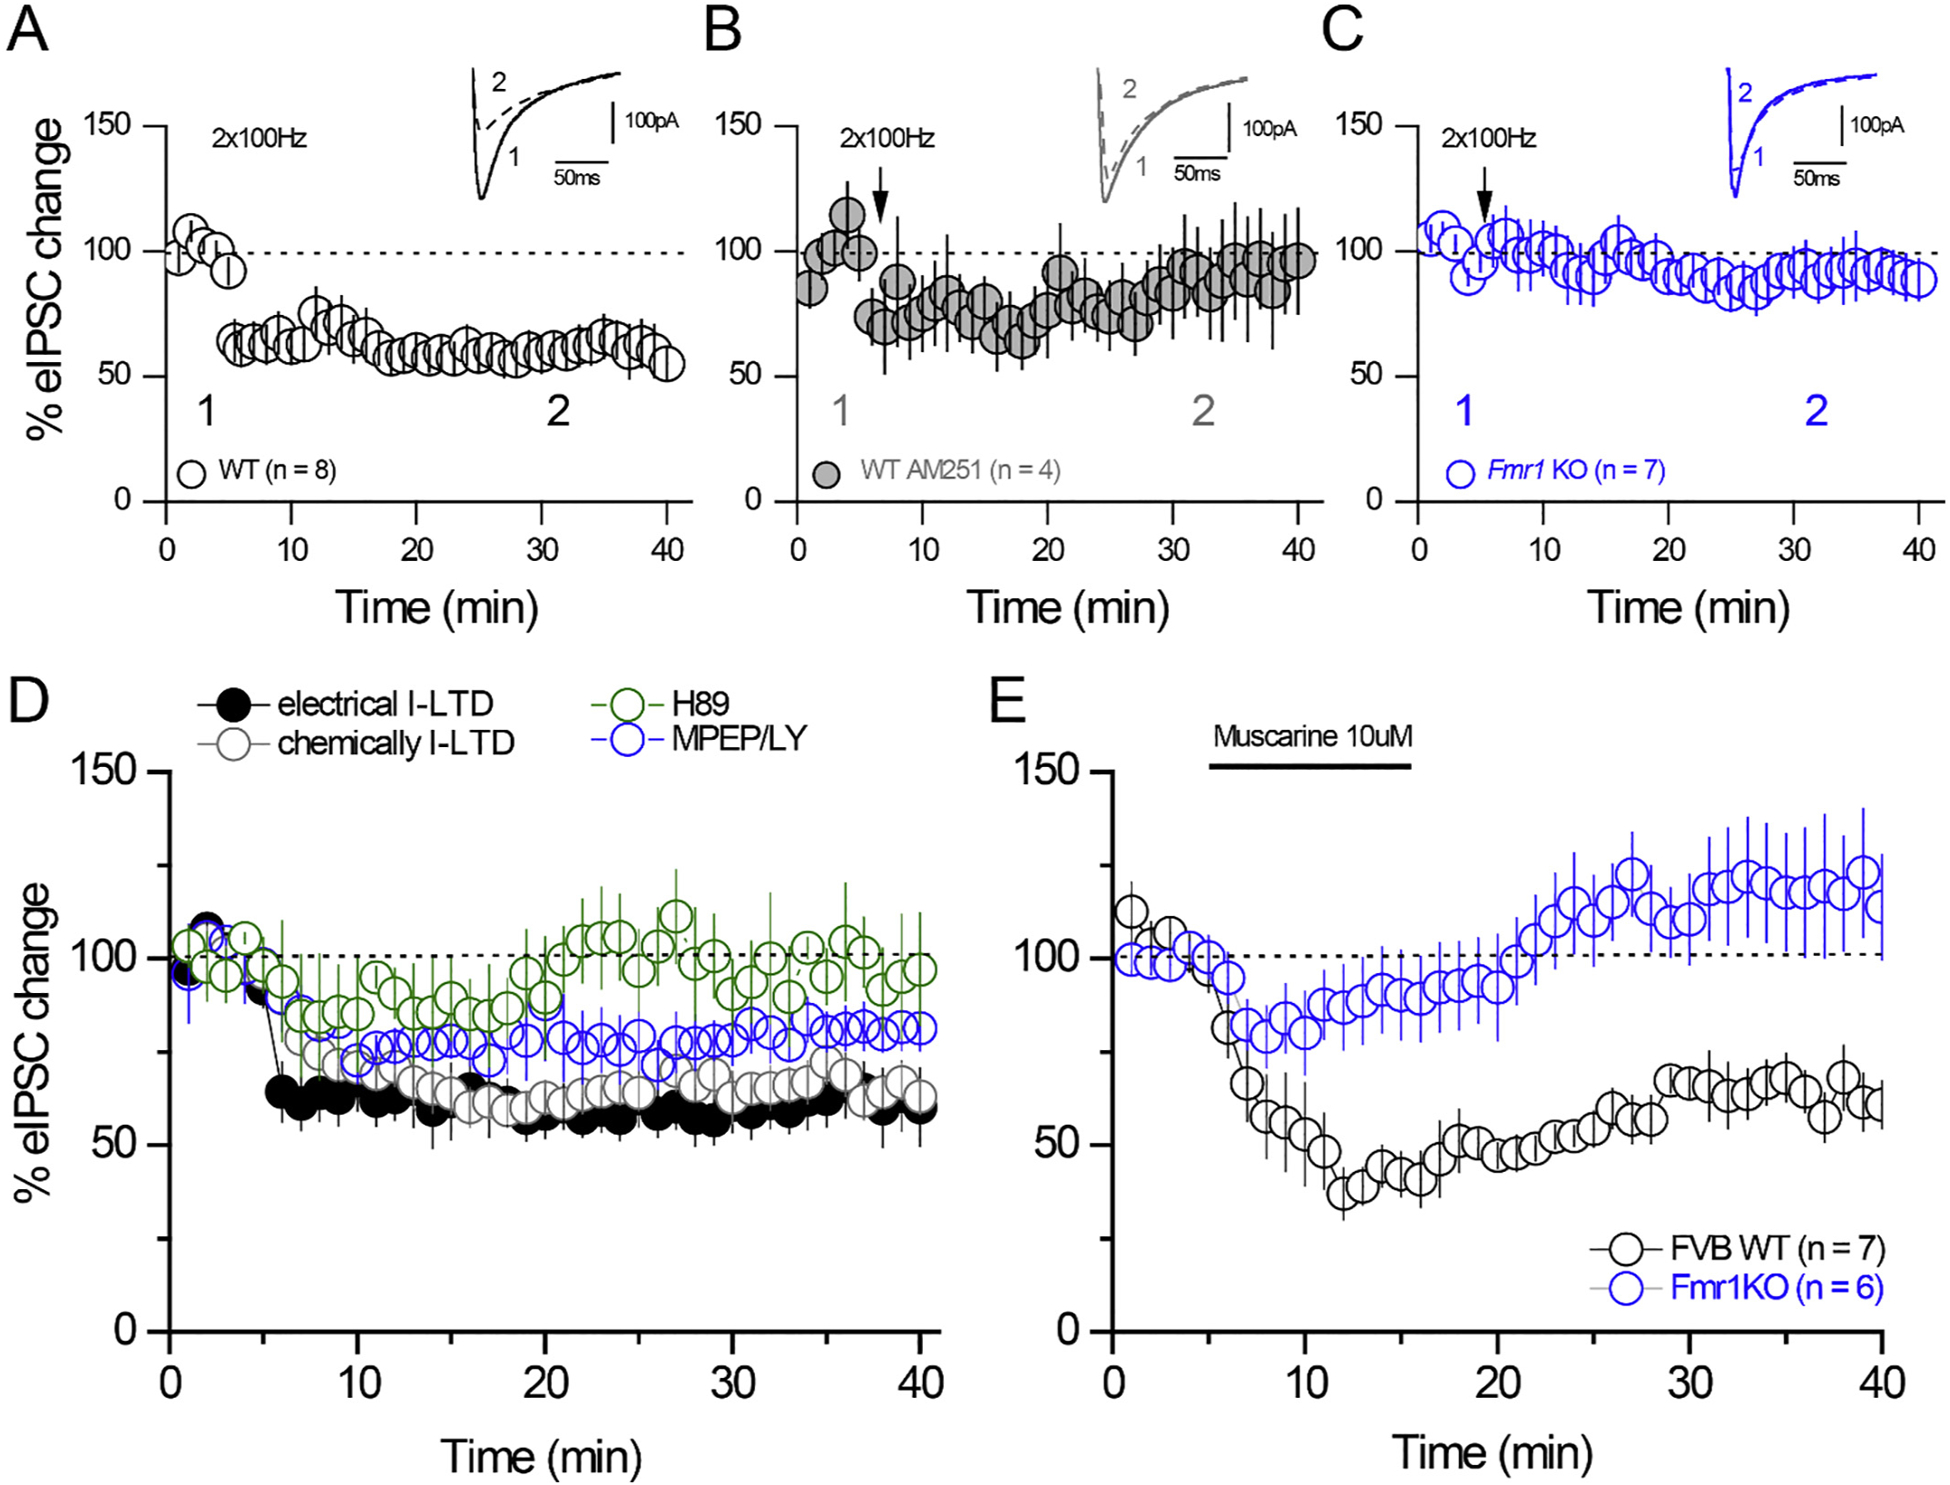
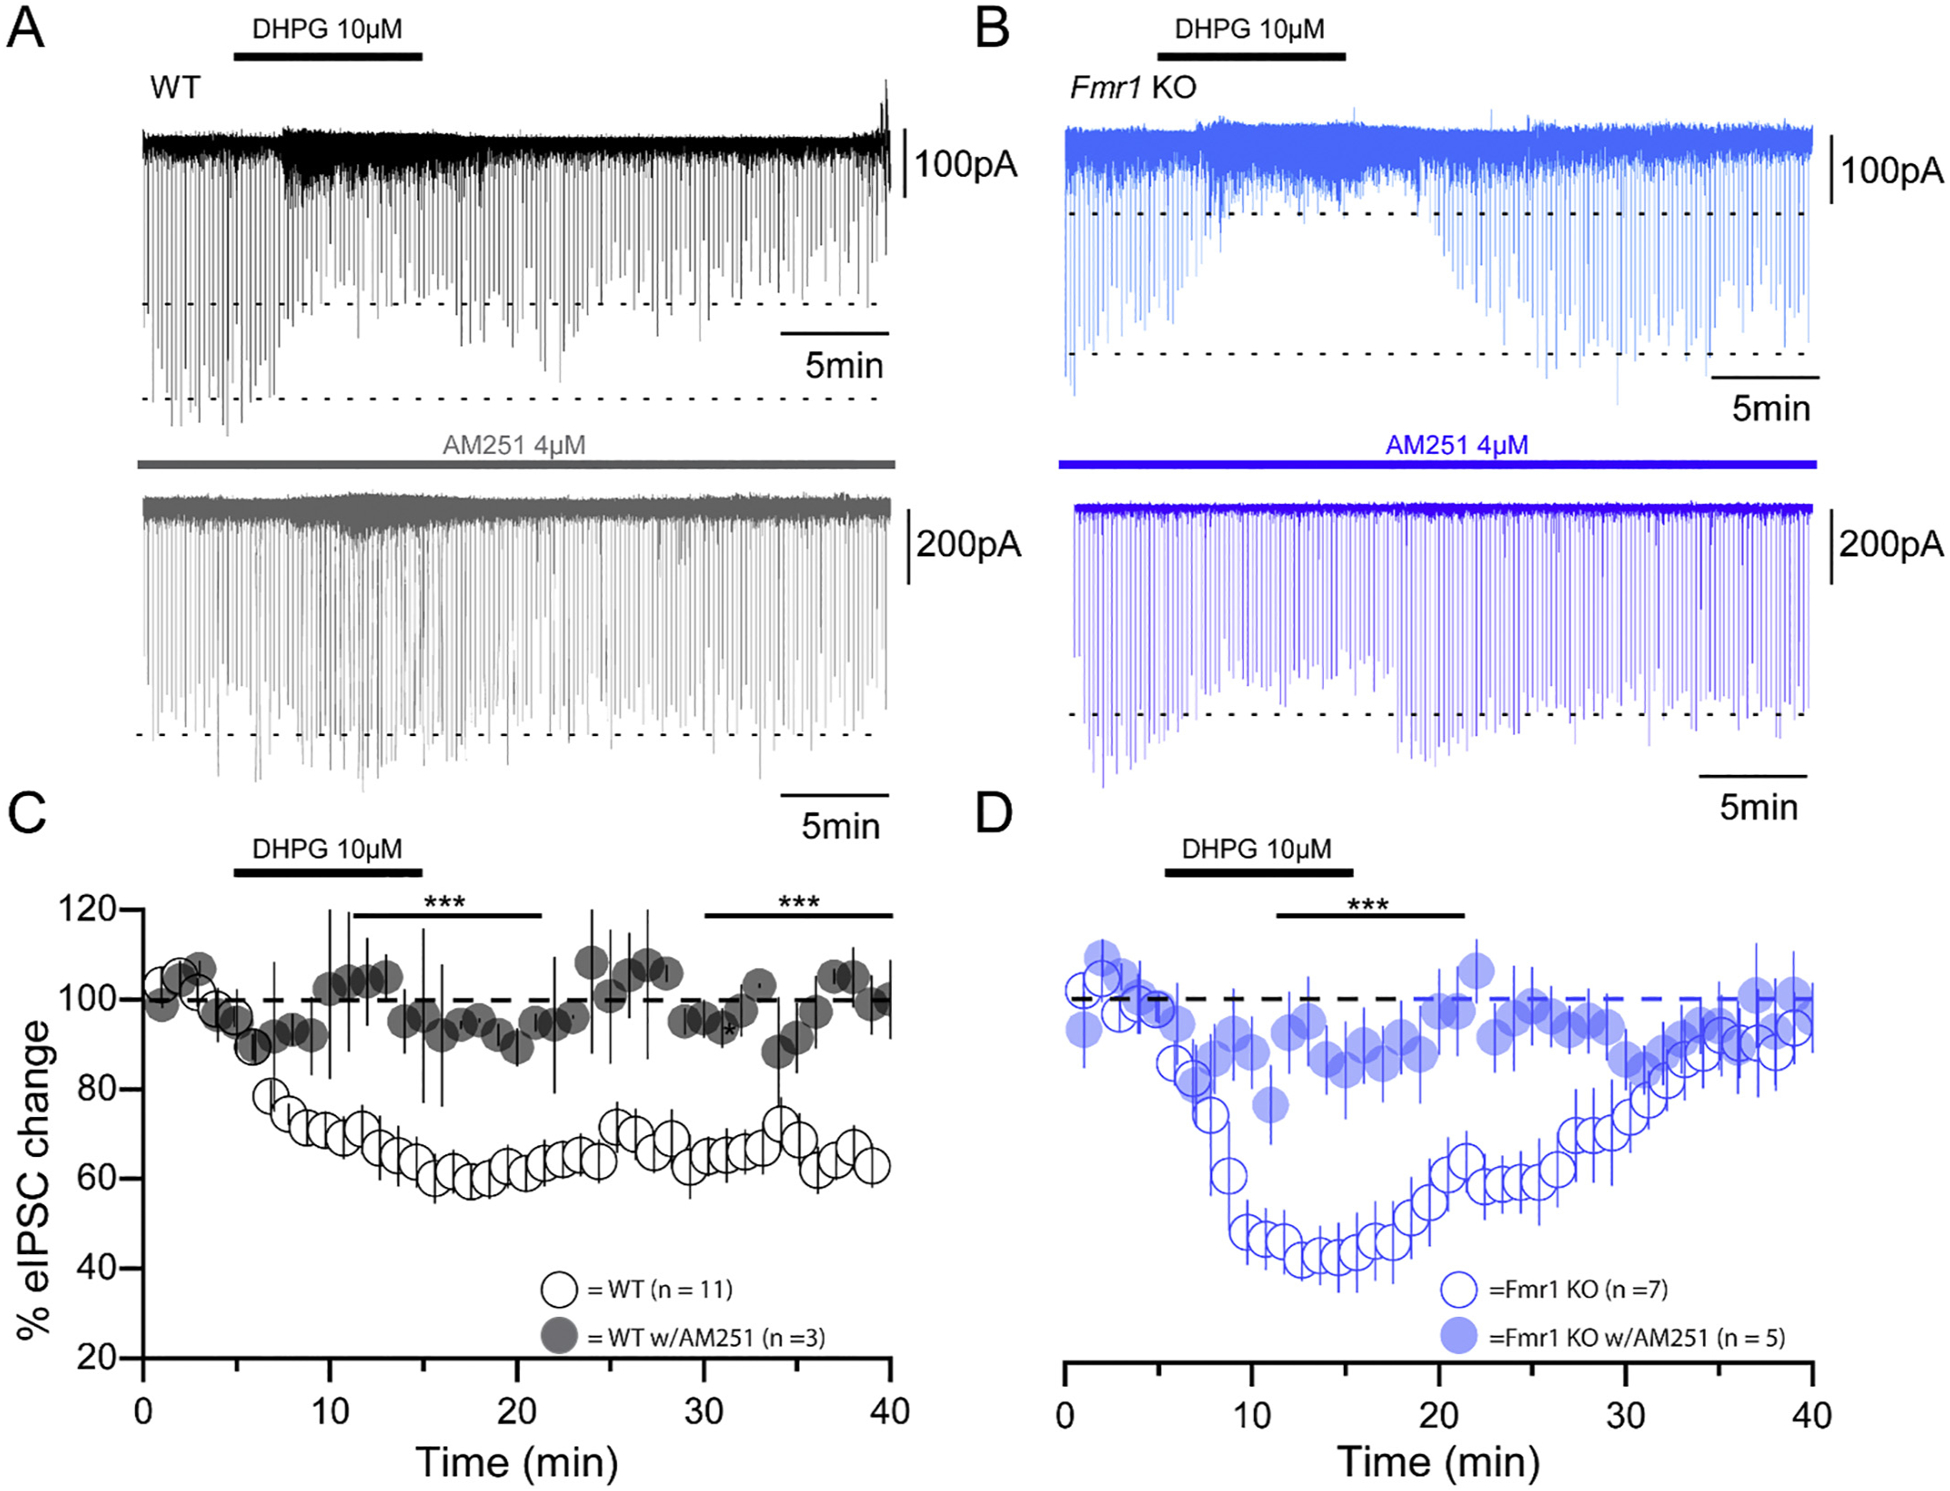
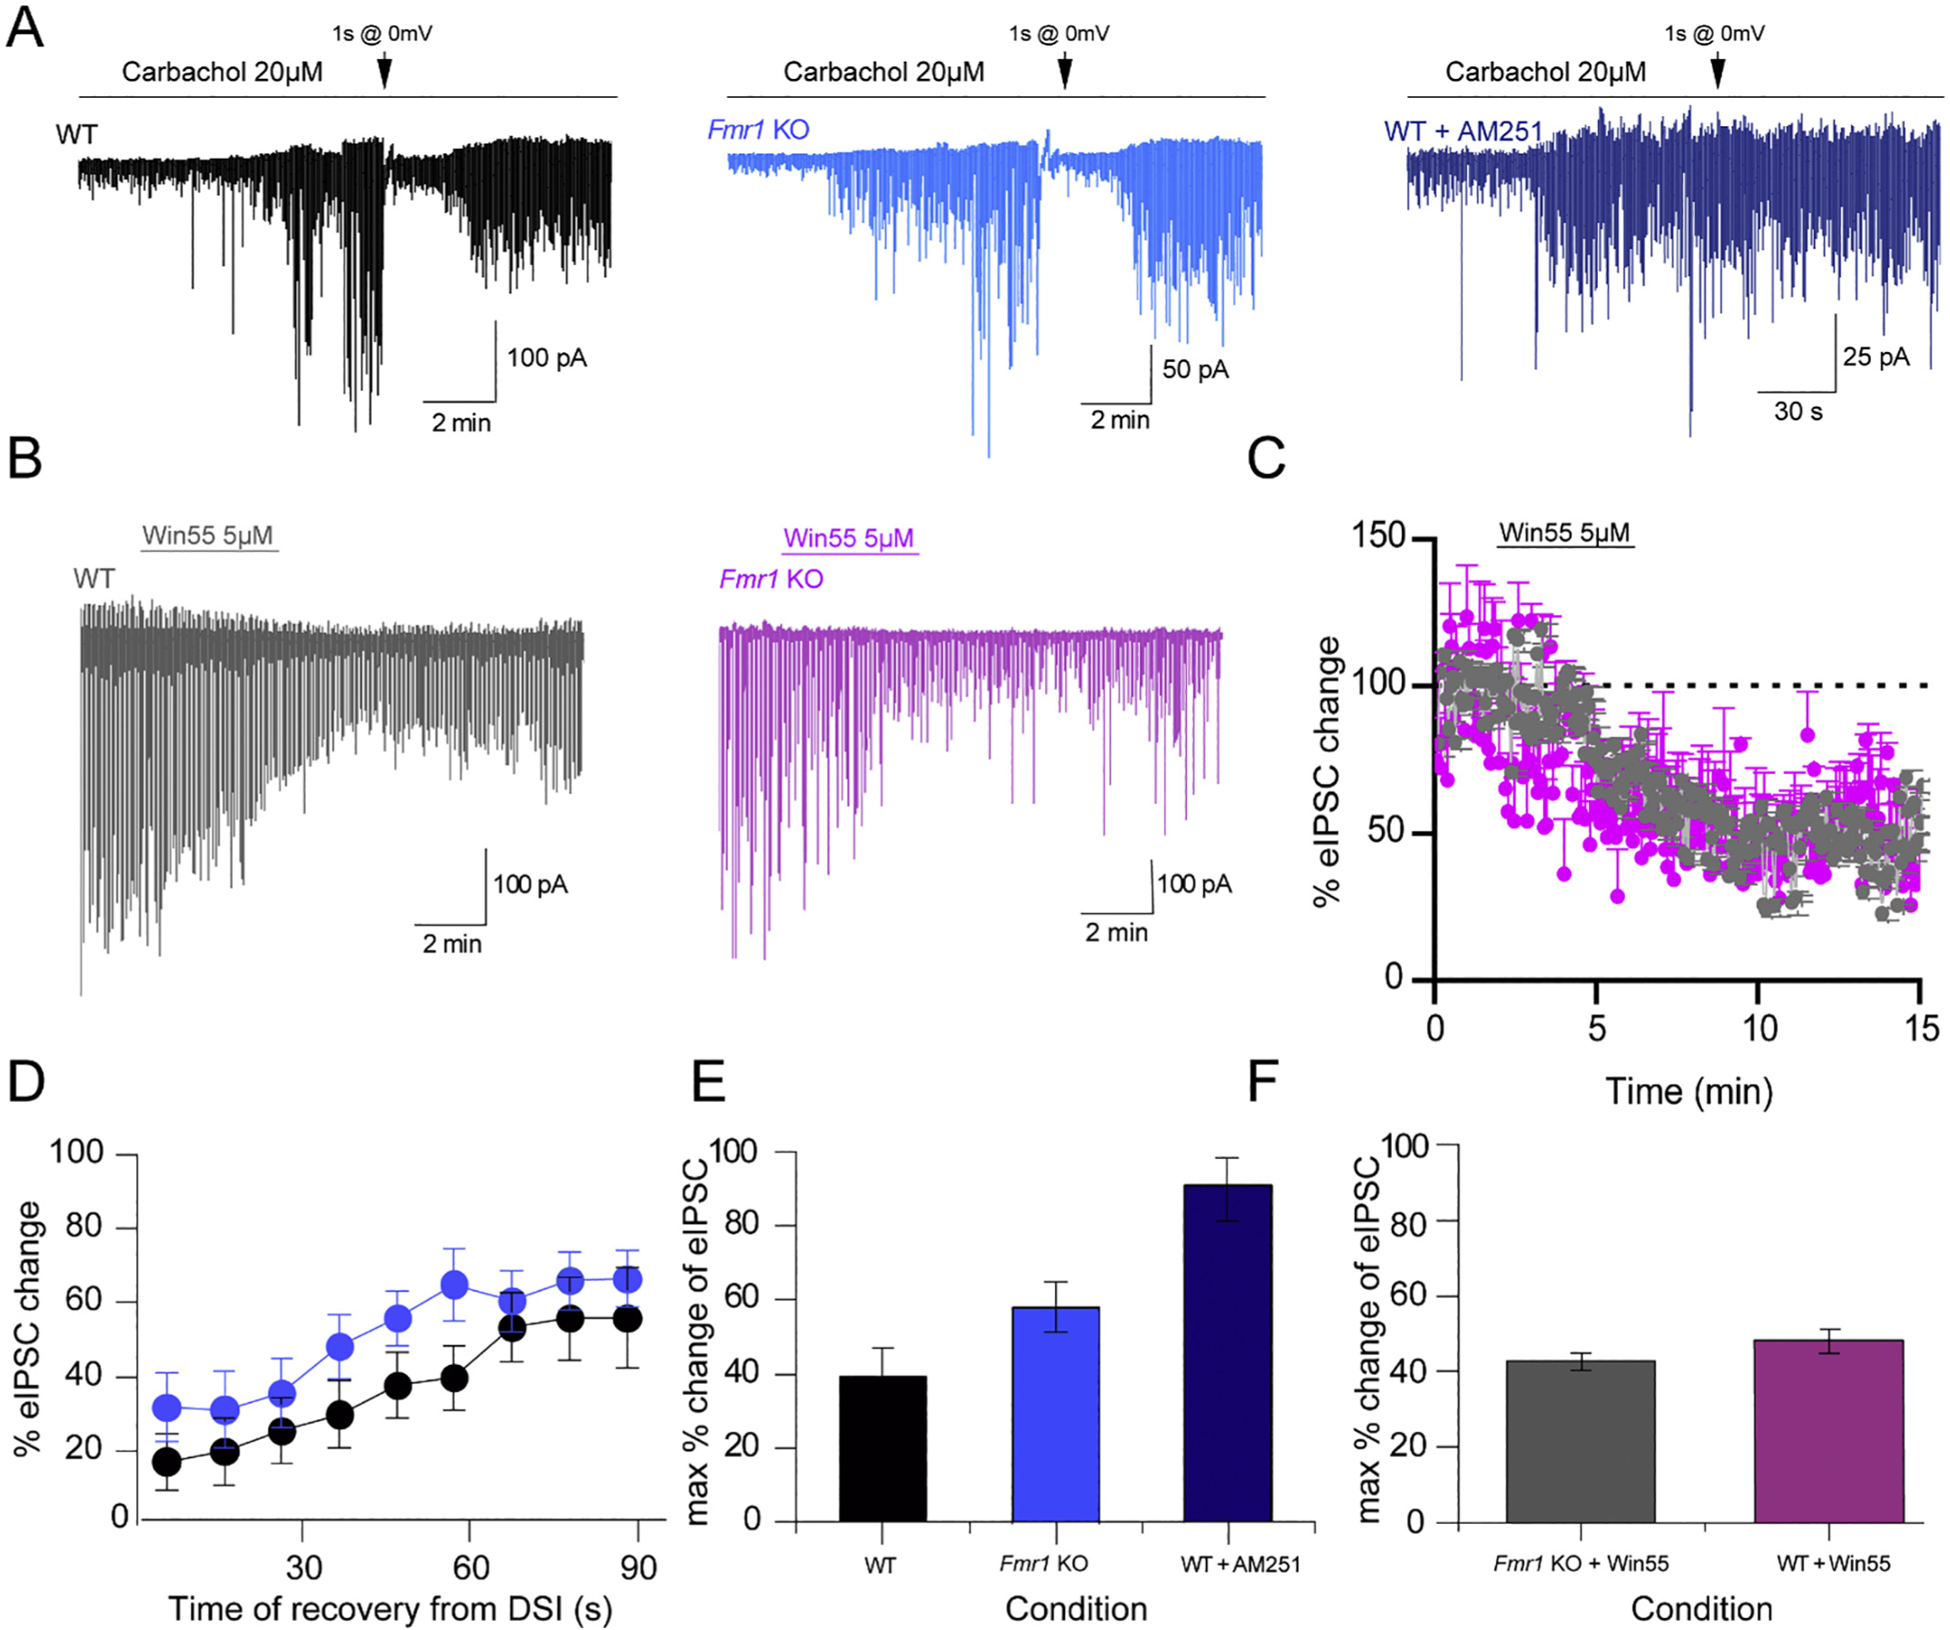
Fragile X Syndrome (FXS) is a neurodevelopmental disorder instigated by the absence of a key translation regulating protein, Fragile X Mental Retardation Protein (FMRP). The loss of FMRP in the CNS leads to abnormal synaptic development, disruption of critical periods of plasticity, and an overall deficiency in proper sensory circuit coding leading to hyperexcitable sensory networks. However, little is known about how this hyperexcitable environment affects inhibitory synaptic plasticity. Here, we show that in vivo layer 2/3 of the primary somatosensory cortex of the Fmr1 KO mouse exhibits basal hyperexcitability and an increase in neuronal firing rate suppression during whisker activation. This aligns with our in vitro data that indicate an increase in GABAergic spontaneous activity, a faulty mGluR-mediated inhibitory input and impaired inhibitory plasticity processes. Specifically, we find that mGluR activation sensitivity is overall diminished in the Fmr1 KO mouse leading to both a decreased spontaneous inhibitory postsynaptic input to principal cells and a disrupted form of inhibitory long-term depression (I-LTD). These data suggest an adaptive mechanism that acts to homeostatically counterbalance the cortical hyperexcitability observed in FXS.

Keywords: Cortex; Fragile X syndrome; Inhibitory neurotransmission; Interneurons; Plasticity.


Figures

Fig. 1.
Fig. 1.
S1 L2/3 neurons exhibit basal hyperexcitability and an increase in neuronal firing rate suppression during whisker activation in Fmr1 KOs. (A) Upper panels: Diagram of the experimental set-up of in vivo electrophysiological recording in anesthetized mice. Mice implanted in L2/3 with a movable device with 4 tetrodes were anesthetized and contralateral whiskers were stimulated with an air puff (~3 L/min). Bottom panel: representative electrophysiological recording of one electrode. (B) Comparison of the basal firing rate of all the neurons recorded in the WT (grey) and Fmr1 KO (blue; n = 29 units from 3 WT and n = 24 units from 3 Fmr1 KO; mean ± S.E.M; **p = .02). Inset: cumulative probability function of the data (K–S test p < .005) (C) Left: representative excitatory response (10 trials, spikes and peristimulus time histogram (PSTH) shown, bar 10 spikes) of two units (top panel WT, bottom panel, Fmr1 KO) in response to the stimulus. The air puff was delivered for 1 s. Right: population graph depicting the number and percentage of units that exhibited a statistically significant increase, decrease or no change in FR after stimulus delivery. (D) Left, bar graph showing units separated by their statistical change in firing rate (FR) before and after stimulus presentation in the WT and KO response to the air puff (determined by a t-test corrected for multiple comparison, *p = .04) and population graph depicting the number and percentage of units that exhibited a statistically significant increase, decrease or no change in FR after stimulus delivery. Right, summary of the neuronal response to air puff of the units that exhibited a statistical change in FR after the air puff. (E) Top, diagram of experimental design of DHPG infusion. Twenty trials of baseline activity were recorded in the awake and freely moving mouse. The mouse was then anesthetized and DHPG (100 μM) was infused directly into L2/3. 30 min after infusion, twenty trials of extracellular activity were recorded. Bottom, representative raster plots of a unit during baseline condition and after DHPG infusion in the WT and Fmr1 KO. (F) Left, cumulative probability analysis of the mean baseline FR of awake and freely moving WT and Fmr1 KO mice (n = 16 units and n = 25 units from 3 WT and 3 Fmr1 KO, respectively; mean ± S.E.M; **p = .008). Left inset, bar graph describing the mean basal firing rate with scatter plot overlaid on top (t-test, P = .046). Right, bar graph depicting the delta FR of all the units recorded in basal conditions and after DHPG infusion.
Fig. 2.
Fig. 2.
In vitro recordings show augmented basal inhibition and a diminished inhibitory drive mediated by mGluR activation in Fmr1 KO L2/3 of the somatosensory cortex. (A-D) Representative voltage clamp traces of sIPSC and sEPSC activity before and after application of DHPG (10 μM) from WT and Fmr1 KO mice, respectively. (E-F) Representative voltage clamp traces for sIPSC frequency before and after application of carbachol (10 μM) from WT and Fmr1 KO mice. (G) Bar population plot of sIPSC frequency from A and B. (H) Bar population plot of sEPSC frequency from C and D (I) Bar population plot of sIPSC frequency from E and F. (J) Single (open) and average (filled) baseline sIPSC frequency from WT and Fmr1 KO mice. (K-L) Logarithmic population plot of sIPSC frequency ratio and sIPSC amplitude ratio, respectively, before and after application of different concentrations of DHPG from WT (black circles) and Fmr1 KO (blue circles). All recordings are from L2/3 pyramidal neurons.
Fig. 3.
Fig. 3.
Heterosynaptic I-LTD is disrupted in L2/3 of Fmr1 KO mice. (A) Percentage of eIPSC activity change over time from L2/3 pyramidal cells of WT mice before and after an electrical HFS stimulation and (B) in the presence of AM251 (an eCB receptor inverse agonist). (C) Percentage of eIPSC activity change over time from L2/3 pyramidal cells of Fmr1 KO mice before and after an electrical HFS stimulation. Inset shows representative eIPSC waveform before (1) and after (2) HFS protocol. (D) Percentage of eIPSC activity change over time from L2/3 pyramidal cells of WT mice before and after an electrical HFS stimulation (black filled circles), chemically-induced protocol (grey open circles), in the presence of a mGluR antagonist cocktail of MPEP/LY367385 (blue open circles) or in the presence of H89 (a PKA inhibitor) (green open circles). (E) Percentage of eIPSC activity change over time from L2/3 pyramidal cells of WT (black circles) and Fmr1 KO (blue circles) mice before and after 10 min application of muscarine (10 μM).
Fig. 4.
Fig. 4.
Chemically induced mGluR activation fails to replicate the heterosynaptic I-LTD in Fmr1 KO mice. (A) Representative traces of DHPG-induced I-LTD in pyramidal cells of WT L2/3 in the absence (upper trace) and presence (lower trace) of AM251 (4 μM). (B) Representative traces of DHPG-induced I-LTD in L2/3 pyramidal cells of Fmr1 KO in the absence (upper trace) and presence of AM251 (lower trace). (C) Percentage of change in eIPSC activity over time from L2/3 pyramidal cell population of WT mice in the absence (open black circles) and presence of AM251 (filled black circles) before and after 10 min application of DHPG (10 μM). (D) Percentage of change in eIPSC activity over time from L2/3 pyramidal cell population of Fmr1 KO mice in the absence (open blue circles) and presence (filled blue circles) of AM251 before and after 10 min application of DHPG.
Fig. 5.
Fig. 5.
eCB machinery is intact in Fmr1 KO mice. (A) Representative carbachol induced sIPSCs before, and after a DSI protocol of 1 s of depolarization to 0 mV from WT (black traces), Fmr1 KO (blue traces) and WT in the presence of AM251 (indigo trace) L2/3 pyramidal cell recordings. (B) Representative traces of eIPSCs before and after application of Win55 (5 μM), a CB1R agonist, from WT (black traces) and Fmr1 KO (violet traces) L2/3 pyramidal cells. (C) Data population of percentage of change in eIPSC activity from WT (grey circles) and Fmr1 KO (violet circles) L2/3 pyramidal cells in the presence of Win55 (5 μM) from baseline. (D) Data population of percentage of change in eIPSC activity over time 90 s after the DSI induction protocol for WT (black circles) and Fmr1 KO (blue circles) L2/3 pyramidal cells from baseline. (E) Data population bar plots of maximum percentage of change in eIPSC activity after induction of DSI protocol. (F) Data population bar plots of maximum percentage of change in eIPSC activity after application of Win55 (5 μM).

Similar articles

Cited by

References

    1. Antoine MW, Langberg T, Schnepel P, Feldman DE, 2019. Increased excitation-inhibition ratio stabilizes synapse and circuit excitability in four autism mouse models. Neuron 101 (648–661), e644. - PMC - PubMed
    1. Arnett MT, Herman DH, McGee AW, 2014. Deficits in tactile learning in a mouse model of fragile X syndrome. PLoS ONE 9, e109116. - PMC - PubMed
    1. Auerbach BD, Bear MF, 2010. Loss of the fragile X mental retardation protein de-couples metabotropic glutamate receptor dependent priming of long-term potentiation from protein synthesis. J. Neurophysiol 104, 1047–1051. - PMC - PubMed
    1. Bagni C, Greenough WT, 2005. From mRNP trafficking to spine dysmorphogenesis: the roots of fragile X syndrome. Nat. Rev. Neurosci 6, 376–387. - PubMed
    1. Bear MF, Huber KM, Warren ST, 2004. The mGluR theory of fragile X mental retardation. Trends Neurosci. 27, 370–377. - PubMed

Publication types

MeSH terms

Substances