

Changes in U.S. air pollution during the COVID-19 pandemic
- PMID: 32512381
- PMCID: PMC7442629
- DOI: 10.1016/j.scitotenv.2020.139864
Changes in U.S. air pollution during the COVID-19 pandemic
Abstract
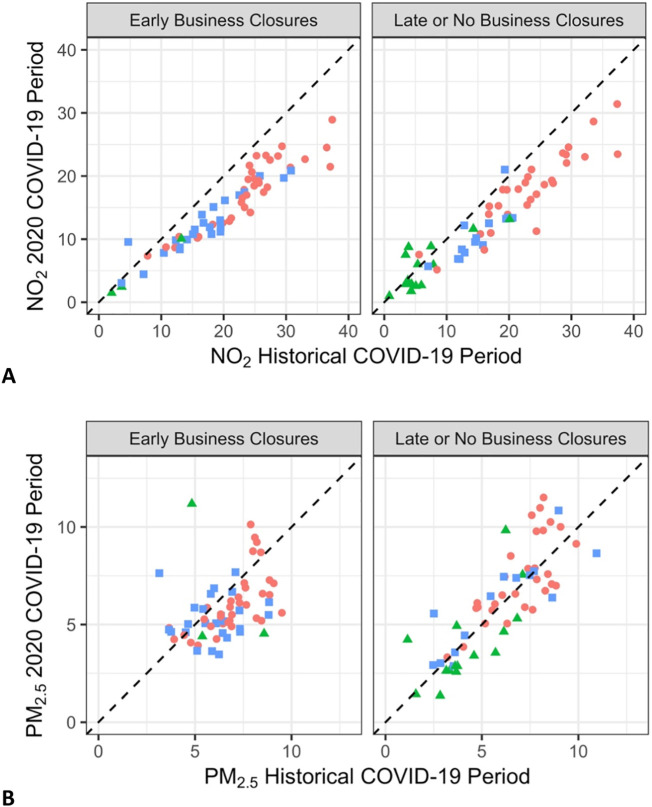
The COVID-19 global pandemic has likely affected air quality due to extreme changes in human behavior. We assessed air quality during the COVID-19 pandemic for fine particulate matter (PM2.5) and nitrogen dioxide (NO2) in the continental United States from January 8th-April 21st in 2017-2020. We considered pollution during the COVID-19 period (March 13-April 21st) and the pre-COVID-19 period (January 8th-March 12th) with 2020 representing 'current' data and 2017-2019 representing 'historical' data. County-level pollution concentrations were compared between historical versus current periods, and counties were stratified by institution of early or late non-essential business closures. Statistically significant NO2 declines were observed during the current COVID-19 period compared to historical data: a 25.5% reduction with absolute decrease of 4.8 ppb. PM2.5 also showed decreases during the COVID-19 period, and the reduction is statistically significant in urban counties and counties from states instituting early non-essential business closures. Understanding how air pollution is affected during COVID-19 pandemic will provide important clues regarding health effects and control of emissions. Further investigation is warranted to link this finding with health implications.
Keywords: Air pollution; COVID-19; NO(2); PM(2.5); Pandemic.
Copyright © 2020 Elsevier B.V. All rights reserved.
Conflict of interest statement
Declaration of competing interest The authors declare that they have no known competing financial interests or personal relationships that could have appeared to influence the work reported in this paper. The opinions expressed in this article are those of the authors and do not represent those of their affiliations.
Figures

References
-
- Bechle M.J., Millet D.B., Marshall J.D. Remote sensing of exposure to NO2: satellite versus ground-based measurement in a large urban area. Atmos. Environ. 2013;69:345–353. doi: 10.1016/j.atmosenv.2012.11.046. - DOI
-
- Blumberg S. Data shows 30 percent drop in air pollution over northeast U.S. [WWW document]. NASA. 2020. http://www.nasa.gov/feature/goddard/2020/drop-in-air-pollution-over-nort... URL.
-
- Burnett R., Chen H., Szyszkowicz M., Fann N., Hubbell B., Pope C.A., Apte J.S., Brauer M., Cohen A., Weichenthal S., Coggins J., Di Q., Brunekreef B., Frostad J., Lim S.S., Kan H., Walker K.D., Thurston G.D., Hayes R.B., Lim C.C., Turner M.C., Jerrett M., Krewski D., Gapstur S.M., Diver W.R., Ostro B., Goldberg D., Crouse D.L., Martin R.V., Peters P., Pinault L., Tjepkema M., Donkelaar A. van, Villeneuve P.J., Miller A.B., Yin P., Zhou M., Wang L., Janssen N.A.H., Marra M., Atkinson R.W., Tsang H., Thach T.Q., Cannon J.B., Allen R.T., Hart J.E., Laden F., Cesaroni G., Forastiere F., Weinmayr G., Jaensch A., Nagel G., Concin H., Spadaro J.V. Global estimates of mortality associated with long-term exposure to outdoor fine particulate matter. PNAS. 2018;115:9592–9597. doi: 10.1073/pnas.1803222115. - DOI - PMC - PubMed
-
- CDC Homepage of the National Center for Health Statistics [WWW document] 2017. http://www.cdc.gov/nchs/index.htm URL.
MeSH terms
Substances
Grants and funding
LinkOut - more resources
Full Text Sources
Medical
Miscellaneous
