. 2020 Jun 8;17(1):23.
doi: 10.1186/s12989-020-00353-3.

Silica nanoparticles induce lung inflammation in mice via ROS/PARP/TRPM2 signaling-mediated lysosome impairment and autophagy dysfunction

Affiliations

Silica nanoparticles induce lung inflammation in mice via ROS/PARP/TRPM2 signaling-mediated lysosome impairment and autophagy dysfunction

Mingxiang Wang et al. Part Fibre Toxicol. .

Abstract

Background: Wide applications of nanoparticles (NPs) have raised increasing concerns about safety to humans. Oxidative stress and inflammation are extensively investigated as mechanisms for NPs-induced toxicity. Autophagy and lysosomal dysfunction are emerging molecular mechanisms. Inhalation is one of the main pathways of exposing humans to NPs, which has been reported to induce severe pulmonary inflammation. However, the underlying mechanisms and, more specifically, the interplays of above-mentioned mechanisms in NPs-induced pulmonary inflammation are still largely obscure. Considered that NPs exposure in modern society is often unavoidable, it is highly desirable to develop effective strategies that could help to prevent nanomaterials-induced pulmonary inflammation.

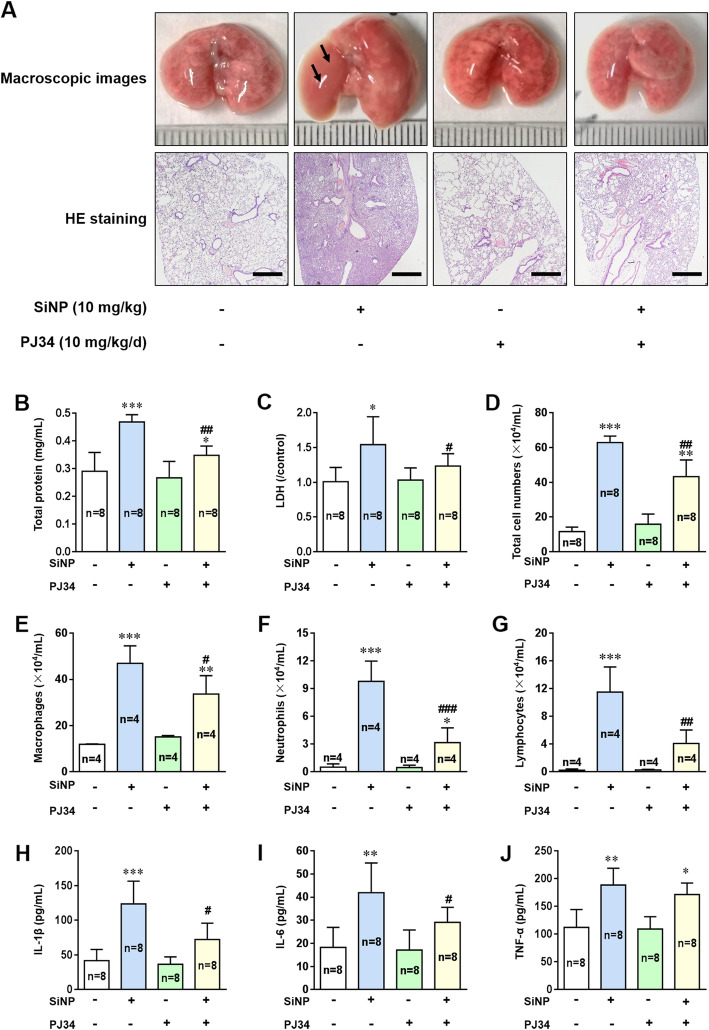
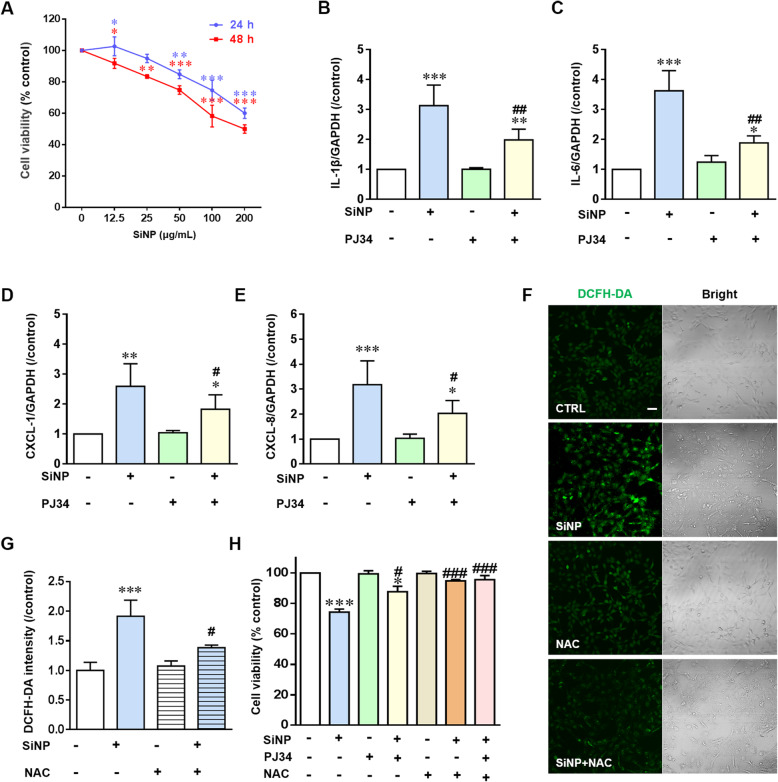
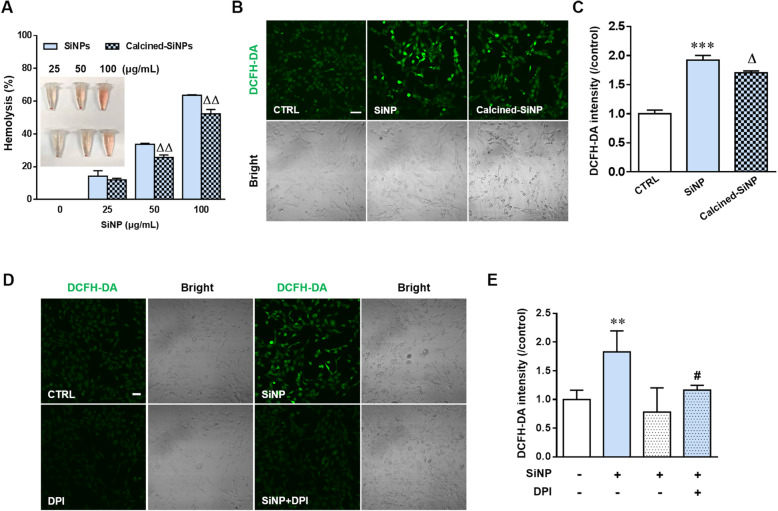
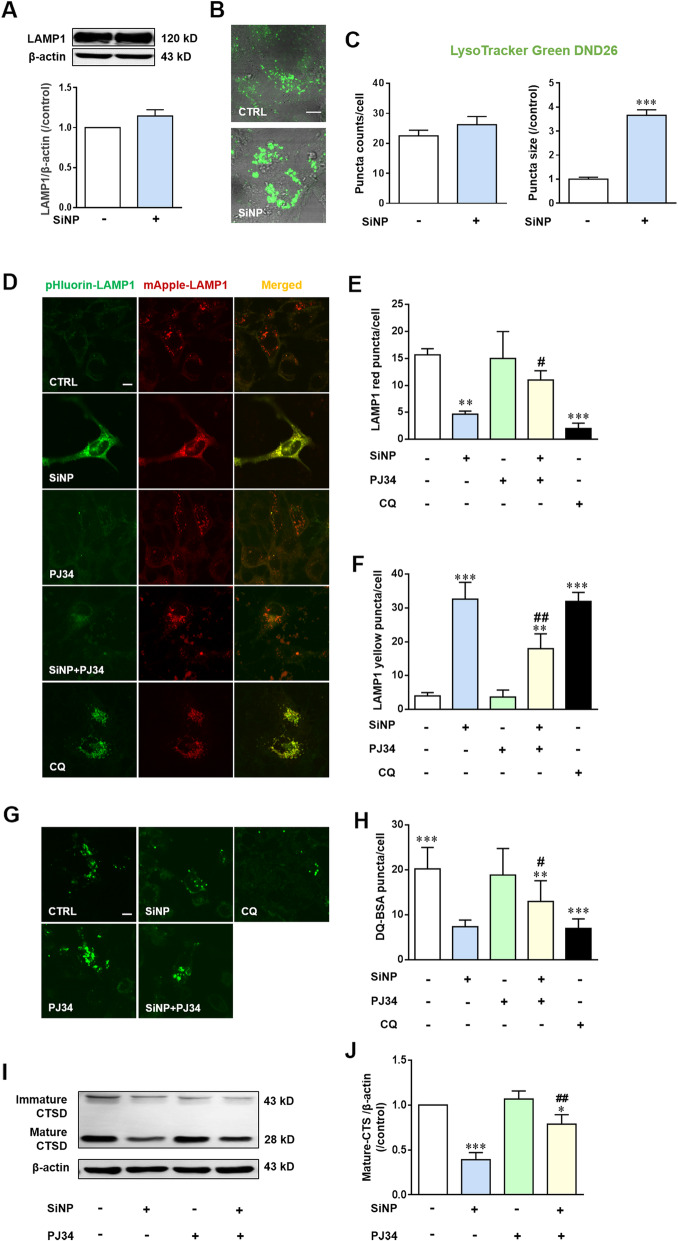
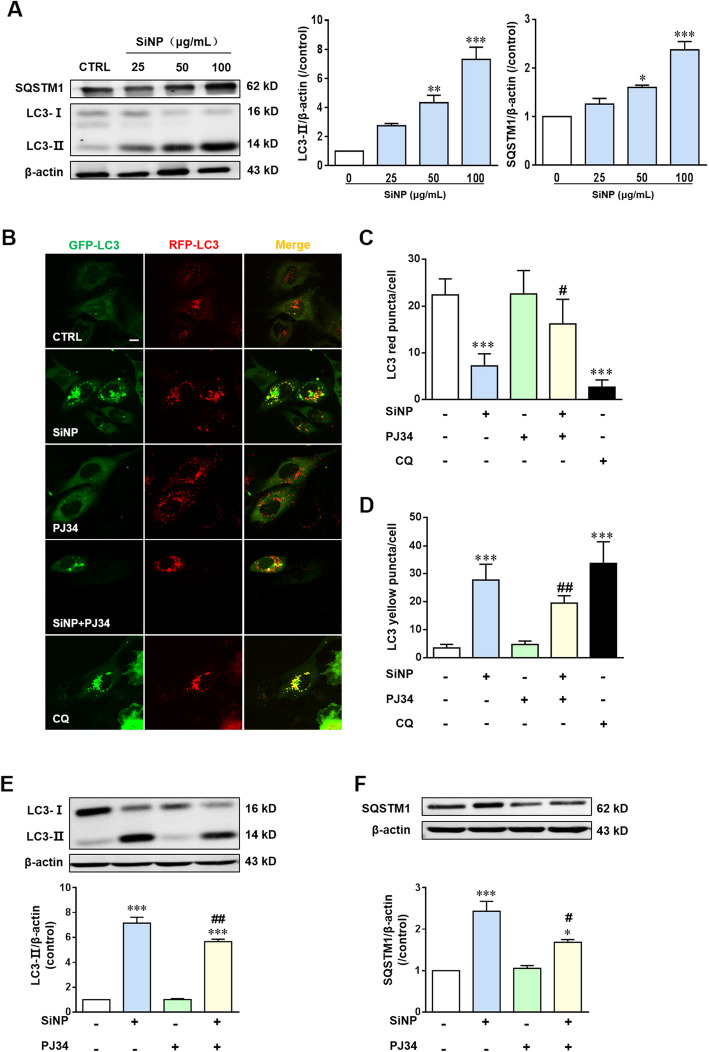
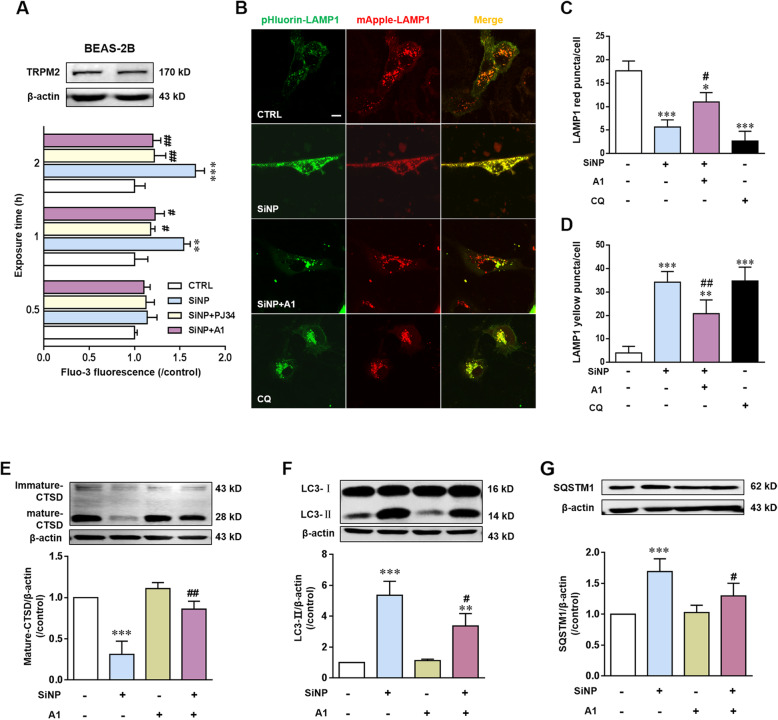
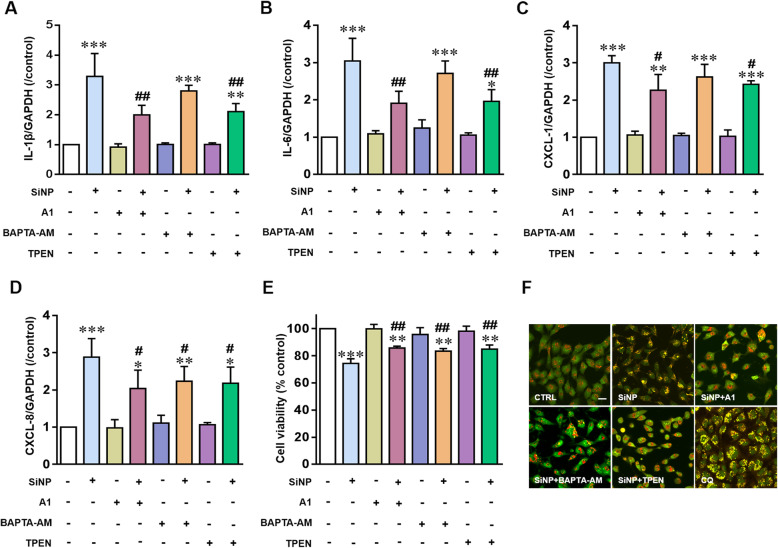
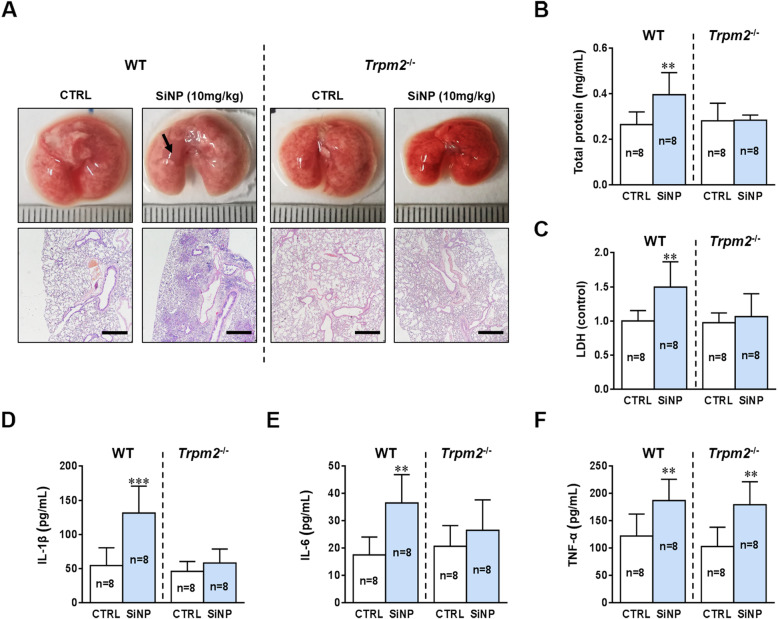
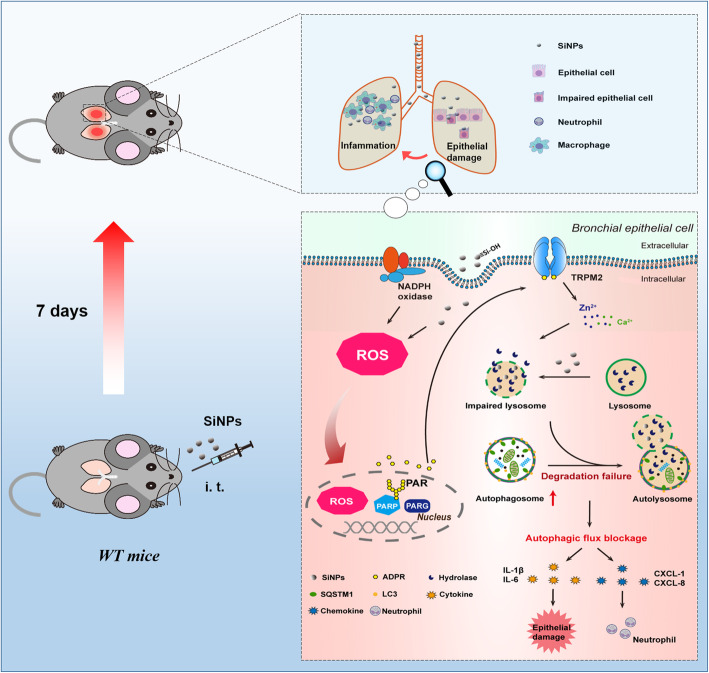
Results: Pulmonary inflammation induced by intratracheal instillation of silica nanoparticles (SiNPs) in C57BL/6 mice was prevented by PJ34, a poly (ADP-ribose) polymerase (PARP) inhibitor. In human lung bronchial epithelial (BEAS-2B) cells, exposure to SiNPs reduced cell viability, and induced ROS generation, impairment in lysosome function and autophagic flux. Inhibition of ROS generation, PARP and TRPM2 channel suppressed SiNPs-induced lysosome impairment and autophagy dysfunction and consequent inflammatory responses. Consistently, SiNPs-induced pulmonary inflammation was prevented in TRPM2 deficient mice.

Conclusion: The ROS/PARP/TRPM2 signaling is critical in SiNPs-induced pulmonary inflammation, providing novel mechanistic insights into NPs-induced lung injury. Our study identifies TRPM2 channel as a new target for the development of preventive and therapeutic strategies to mitigate nanomaterials-induced lung inflammation.

Keywords: Autophagy dysfunction; Lysosomal impairment; Nanoparticles; Pulmonary inflammation; ROS/PARP/TRPM2 signaling.


Conflict of interest statement

The authors declare no conflict of interest.

Figures

Fig. 1
Fig. 1
Characterization of SiNPs in suspension. a The FTIR spectrum of SiNPs. Insert: The spectrum enlarged in the range of 4700–3700 cm− 1. b TG analysis showing the weight loss of SiNPs during heating to 800 °C. C Derivative EPR data of SiNPs in the presence (red) or absence (blue) of H2O2, and DMPO without SiNPs as a negative control (green)
Fig. 2
Fig. 2
Exposure to SiNPs induces severe lung injury and inflammation in mice, depending on PARP activation. a Representative lung histopathology on the 7th day in mice after treated with normal saline or SiNPs (10 mg/kg) in the absence or presence of PJ34 (10 mg/kg/d). Black arrows indicate lung tissue edema. Scale bar = 500 μm. b-g Total protein concentrations (b), LDH release (c), total cells numbers (d), macrophages numbers (e), neutrophils numbers (f), and lymphocytes numbers (g) in the BALFs of mice determined on the 7th day after treated with normal saline or SiNPs (10 mg/kg) in the absence or presence of PJ34 (10 mg/kg/d). h-j The concentrations of IL-1β (h), IL-6 (i), and TNF-α (j) in the BALFs of mice under the same conditions as shown for b-g, as markers of local inflammation were measured by ELISA. *P < 0.05, **P < 0.01, ***P < 0.001 compared with the control group. #P < 0.05, ##P < 0.01 compared with SiNPs-treated group
Fig. 3
Fig. 3
Roles of oxidative stress and PARP activation in SiNPs-induced cytotoxicity in BEAS-2B cells. a Cell viability determined using a Cell Counting Kit-8 (CCK-8) after exposure to SiNPs at different doses (0, 12.5, 25, 50, 100 and 200 μg/mL) for 24  and 48 h. b-e The levels of mRNA expression for IL-1β (b), IL-6 (c), CXCL-1 (d) and CXCL-8 (e) in cells under control or after exposure to SiNPs (100 μg/mL) in the absence or presence of PJ34 (10 μM). f Representative confocal microscopic images showing DCFH-DA fluorescence intensity in cells under control condition (CTRL), or after treatment with SiNPs (100 μg/mL) for 12 h in the absence or presence of NAC (5 mM), or NAC (5 mM) alone. Scale bar = 50 μm. g Mean DCFH-DA fluorescence intensity under indicated conditions, as shown in f, from 200 cells analyzed for each condition. h Cell viability under control condition and after exposure to SiNPs (100 μg/mL) for 24 h, NAC (5 mM), PJ34 (10 μM) or in combinations. *P < 0.05, **P < 0.01, ***P < 0.001 compared to the control group. #P < 0.05, ##P < 0.01, ###P < 0.001 compared to SiNPs-treated group
Fig. 4
Fig. 4
Contribution of surface silanol groups and NADPH oxidases in SiNPs-induced oxidative stress. a Hemolysis to mouse RBCs after exposure to 25–100 μg/mL SiNPs (100 μg/mL) or calcined-SiNPs for 3 h at room temperature. The insert represents hemoglobin release indicated by red color in the supernatant. b Representative confocal microscopic images showing DCFH-DA fluorescence in BEAS-2B cells under control (CTRL) condition, or after treatment with SiNPs (100 μg/mL) or calcined-SiNPs (100 μg/mL). Scale bar = 50 μm. c Mean DCFH-DA fluorescence intensity under indicated conditions as shown in b, from 200 cells analyzed for each condition. d Representative confocal microscopic images showing DCFH-DA fluorescence in BEAS-2B cells under control (CTRL) condition or after treatment with SiNPs (100 μg/mL) in the absence or presence of DPI (0.1 μM). e. Mean DCFH-DA fluorescence intensity under indicated conditions as shown in d, from 200 cells analyzed for each condition. **P < 0.01, ***P < 0.001 compared to control group. #P < 0.05 compared to SiNPs-treated group. ΔP < 0.05, ΔΔP < 0.01 compared to calcined-SiNPs at the same concentration
Fig. 5
Fig. 5
PARP activation mediates SiNPs-induced lysosomal alkalization and reduced degradation capacity in BEAS-2B cells. a LAMP1 expression determined by western blotting. b Representative images showing LysoTracker Green DND-26 fluorescence in cells under control conditions or after treated with SiNPs (100 μg/mL) for 24 h. c The mean number and size of lysosomes in cells as shown in b, from 50 cells for each condition. Scale bar = 10 μm. d Representative confocal microscopic images showing mApple-LAMP1-pHluorin in cells under control (CTRL) condition or after treatment with SiNPs (100 μg/mL) for 24 h in the absence or presence of PJ34 (10 μM). Cells were incubated with CQ (50 μM) for 3 h as the positive control. Scale bar = 10 μm. e-f Mean number of puncta in each cell under the conditions shown in d, from 30 cells for each condition. g Representative confocal microscopic images showing DQ-BSA analysis of lysosomal proteolytic activity in cells under control condition or after treatment with SiNPs (100 μg/mL) for 24 h in the absence or presence of PJ34 (10 μM). Scale bar = 10 μm. h Mean number of puncta in each cell under indicated conditions shown in g, from 30 cells for each condition. i-j Western blotting analysis of CTSD in BEAS-2B cells under control condition or treatment with SiNPs (100 μg/mL) in the absence or presence of PJ34 (10 μM), from three independent experiments. *P < 0.05, **P < 0.01, ***P < 0.001 compared to the control cells, and #P < 0.05, ##P < 0.01 compared to cells treated with SiNPs alone
Fig. 6
Fig. 6
PARP activation mediates SiNPs-induced blockage of autophagic flux in BEAS-2B. a Western blotting analysis of the levels of LC3 and SQSTM1 in BEAS-2B cells treated with different concentrations of SiNPs for 24 h. b Representative confocal images showing GFP-LC3-RFP in cells treated with SiNPs (100 μg/mL) in the absence or presence of PJ34 (10 μM) at 24 h. Scale bar = 10 μm. c-d Mean number of yellow puncta (autophagosomes) and red puncta (autolysosomes) in each cell from 30 cells for each condition. e-f. Western blotting analysis of the levels of LC3 (e) and SQSTM1 (f) in BEAS-2B cells under control condition or after treated with SiNPs (100 μg/mL) in the absence or presence of PJ34 (10 μM), from three independent experiments. *P < 0.05, **P < 0.01, ***P < 0.001 compared to control cells, and #P < 0.05, ##P < 0.01 compared to cells treated with SiNPs alone
Fig. 7
Fig. 7
TRPM2 channel activation mediates SiNPs-induced lysosome impairment and blockage of autophagic flux in BEAS-2B cells. a Western blotting analysis of TRPM2 expression in cells (top) and single cell imaging analysis using Fluo-3 of intracellular free Ca2+ levels in cells treated with SiNPs (100 μg/mL) for 0.5, 1, 2, 3 h in the absence or presence of PJ34 (10 μM) and compound A1 (10 μM) (bottom). b Representative confocal microscopic images showing mApple-LAMP1-pHluorin fluorescence in cells under control condition or after treated with SiNPs (100 μg/mL) for 24 h in the absence or presence of compound A1 (10 μM). Scale bar = 10 μm. c-d Mean number of puncta in each cell under indicated onditions shown in B, from 30 cells for each condition. e-g Western blotting analysis the levels of CTSD (e), LC3 (f) and SQSTM1 (g) in cells under control condition or after treatment with SiNPs (100 μg/mL) in the absence or presence of compound A1 (10 μM), from three independent experiments. *P < 0.05, **P < 0.01, ***P < 0.001 compared to the control cells, and #P < 0.05, ##P < 0.01 compared to cells treated with SiNPs alone
Fig. 8
Fig. 8
TRPM2-mediated lysosomal and autophagic dysfunction in SiNPs-induced inflammation in BEAS-2B cells. a-d Quantitative RT-PCR analysis of the mRNA expression levels for IL-1β (a), IL-6 (b), CXCL-1 (c) and CXCL-8 (d) in cells under control condition or after treatment with SiNPs (100 μg/mL) for 24 h with or without prior treatment with compound A1 (10 μM), TPEN (5 μM) or BAPTA-AM (1 μM). e Mean cell viability in cells under control condition or after exposure to SiNPs (100 μg/mL) for 24 h with prior treatment with compound A1 (10 μM), TPEN (5 μM) or BAPTA-AM (1 μM), from three independent experiments. f Representative confocal microscopic images showing acridine orange (AO) staining in cells under control condition or after exposure to SiNPs (100 μg/mL) for 24 h with or without prior treatment with compound A1 (10 μM), TPEN (5 μM) or BAPTA-AM (1 μM). Cells were incubated with CQ (50 μM) for 3 h as positive control. Scale bar = 20 μm. Data are from *P < 0.05, **P < 0.01, ***P < 0.001 compared to the control cells, and #P < 0.05, ##P < 0.01 compared to cells treated with SiNPs alone
Fig. 9
Fig. 9
TRPM2 deficiency eliminates SiNPs-induced pulmonary inflammation in C57BL/6 mice. a Lung histopathology on the 7th day after treatment with saline or SiNPs (100 μg/mL). Scale bar = 500 μm. b-c Total protein concentrations (b), and LDH (c) in the BALF of Trpm2−/− mice on the 7th day after exposure to saline or SiNPs (100 μg/mL). d-f Mean concentrations of IL-1β (d), IL-6 (e), and TNF-α (f) in the BALFs measured by ELISA. The data from the WT mice were displayed on the left side of the dotted line, and the Trpm2−/− data on the right side. * P < 0.05 compared with the control group
Fig. 10
Fig. 10
Schematic illustration of the ROS/PARP/TRPM2 signaling pathway that mediates SiNPs-induced pulmonary inflammation in mice. SiNPs are ingested through intratracheal exposure and, upon endocytosis into bronchial epithelial cells, induce ROS production, which activates the TRPM2 channel through the PARP-mediated generation of ADPR in the nucleus. TRPM2 channel activation in turn increases intracellular zinc and calcium ions to impair the degradation function of lysosomes. Lysosomal dysfunction blocks autophagic flux that triggers inflammation by generating cytokines, IL-1β and IL-6, and also chemokines, CXCL-1 and CXCL-8, which are critical for neutrophil recruitment

References

    1. Napierska D, Thomassen LC, Lison D, Martens JA, Hoet PH. The nanosilica hazard: another variable entity. Part Fibre Toxicol. 2010;7(1):39. - PMC - PubMed
    1. Hamilton RF, Jr, Thakur SA, Holian A. Silica binding and toxicity in alveolar macrophages. Free Radic Biol Med. 2008;44(7):1246–1258. - PMC - PubMed
    1. Tomonaga T, Izumi H, Yoshiura Y, Myojo T, Oyabu T, Lee BW, Okada T, Marui T, Wang KY, Kubo M, et al. Usefulness of myeloperoxidase as a biomarker for the ranking of pulmonary toxicity of nanomaterials. Part Fibre Toxicol. 2018;15(1):41. - PMC - PubMed
    1. Murugadoss S, Lison D, Godderis L, Van Den Brule S, Mast J, Brassinne F, Sebaihi N, Hoet PH. Toxicology of silica nanoparticles: an update. Arch Toxicol. 2017;91(9):2967–3010. - PMC - PubMed
    1. Yang H, Wu QY, Li MY, Lao CS, Zhang YJ. Pulmonary toxicity in rats caused by exposure to Intratracheal instillation of SiO2 nanoparticles. Biomed Environ Sci. 2017;30(4):264–279. - PubMed

Publication types