

Heat map visualization for electrocardiogram data analysis
- PMID: 32513239
- PMCID: PMC7281952
- DOI: 10.1186/s12872-020-01560-8
Heat map visualization for electrocardiogram data analysis
Abstract
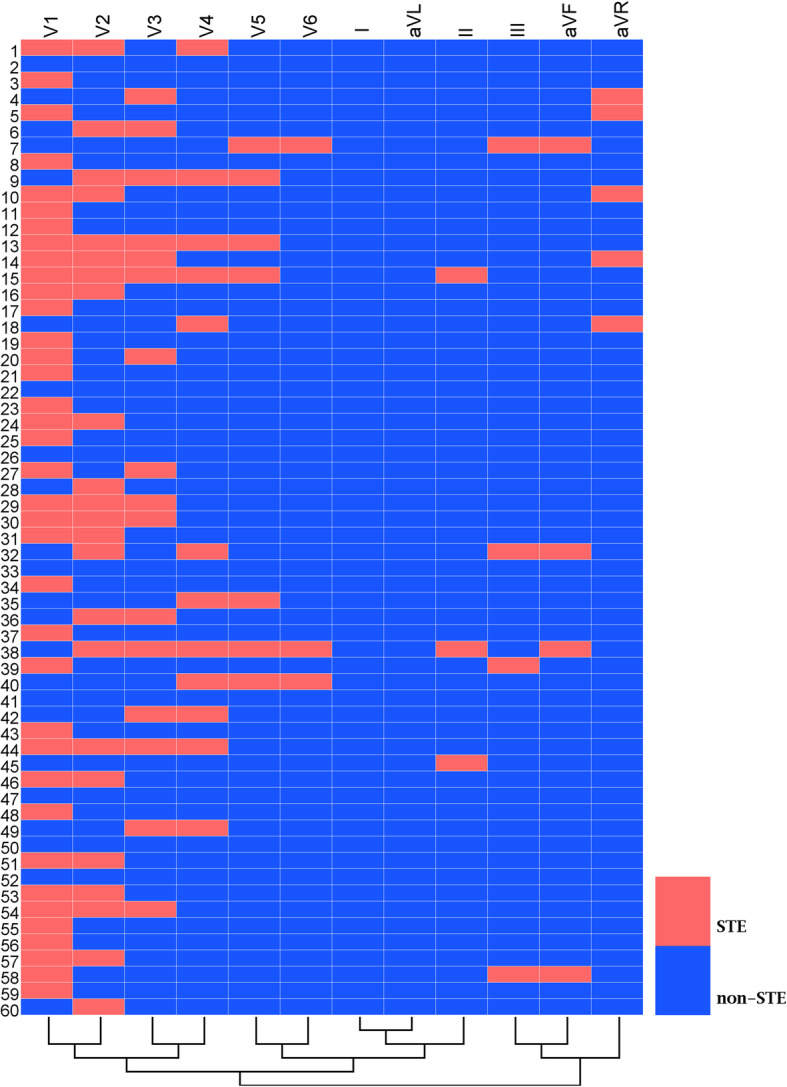
Background: Most electrocardiogram (ECG) studies still take advantage of traditional statistical functions, and the results are mostly presented in tables, histograms, and curves. Few papers display ECG data by visual means. The aim of this study was to analyze and show data for electrocardiographic left ventricular hypertrophy (LVH) with ST-segment elevation (STE) by a heat map in order to explore the feasibility and clinical value of heat mapping for ECG data visualization.
Methods: We sequentially collected the electrocardiograms of inpatients in the First Affiliated Hospital of Shantou University Medical College from July 2015 to December 2015 in order to screen cases of LVH with STE. HemI 1.0 software was used to draw heat maps to display the STE of each lead of each collected ECG. Cluster analysis was carried out based on the heat map and the results were drawn as tree maps (pedigree maps) in the heat map.
Results: In total, 60 cases of electrocardiographic LVH with STE were screened and analyzed. STE leads were mainly in the V1, V2 and V3 leads. The ST-segment shifts of each lead of each collected ECG could be conveniently visualized in the heat map. According to cluster analysis in the heat map, STE leads were clustered into two categories, comprising of the right precordial leads (V1, V2, V3) and others (V4, V5, V6, I, II, III, aVF, aVL, aVR). Moreover, the STE amplitude in 40% (24 out of 60) of cases reached the threshold specified in the STEMI guideline. These cases also could be fully displayed and visualized in the heat map. Cluster analysis in the heat map showed that the III, aVF and aVR leads could be clustered together, the V1, V2, V3 and V4 leads could be clustered together, and the V5, V6, I and aVL leads could be clustered together.
Conclusion: Heat maps and cluster analysis can be used to fully display every lead of each electrocardiogram and provide relatively comprehensive information.
Keywords: Data analysis; Electrocardiogram; Heat map; Visualization.
Conflict of interest statement
The authors declare that they have no competing interests.
Figures

References
-
- Lindow T, Birnbaum Y, Nikus K, Maan A, Ekelund U, Pahlm O. Why complicate an important task? An orderly display of the limb leads in the 12-lead electrocardiogram and its implications for recognition of acute coronary syndrome. BMC Cardiovasc Disord. 2019;19(1):13. doi: 10.1186/s12872-018-0979-x. - DOI - PMC - PubMed
-
- Ohannessian R, Benet T, Argaud L, Guerin C, Guichon C, Piriou V, Rimmele T, Girard R, Gerbier-Colomban S, Vanhems P. Heat map for data visualization in infection control epidemiology: an application describing the relationship between hospital-acquired infections, simplified acute physiological score II, and length of stay in adult intensive care units. Am J Infect Control. 2017;45(7):746–749. doi: 10.1016/j.ajic.2017.02.012. - DOI - PubMed
Publication types
MeSH terms
Grants and funding
- A2019219/Medical Scientific Research Foundation of Guangdong Province of China/International
- 2018-157-42/Strategic Fund for Science and Technology Innovation in Guangdong Province (Vertical Collaborative Management Direction)/International
- Shantou [2020] No. 5-7/Science and Technology Plan Project of Shantou City/International
LinkOut - more resources
Full Text Sources
Research Materials
